Week 1 Bottom 10: The Biggest Upsets
November 12, 2025The 2025-26 college basketball season opened with considerable chaos. From November 3-9, three Division I programs suffered home losses to non-Division I opponents—a rare occurrence that happens in less than 2% of such matchups historically. Additionally, 67 Division I versus Division I games produced results contrary to our predictive model’s expectations.
This article examines the top 10 upsets from Week 1, counting down from #10 to #1. Non-Division I upsets automatically rank as the most significant failures, as Division I teams are universally expected to defeat non-Division I opponents, particularly on home courts. Division I versus Division I upsets are ranked by magnitude—the difference between predicted and actual scoring margins.
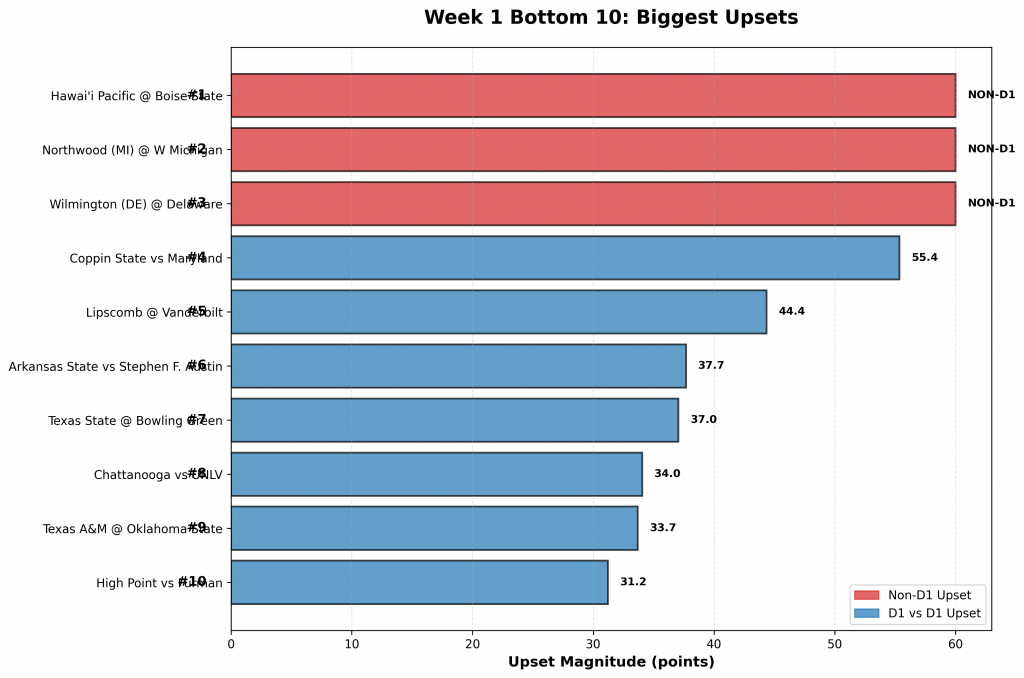
Figure 1: The ten biggest upsets of Week 1, ranked by significance. Red bars indicate non-D1 upsets (D1 teams losing to non-D1 opponents), which rank #1-#3 as the most catastrophic results. Blue bars show D1 versus D1 upsets (#4-#10) ranked by prediction error magnitude.
Historical Context: Non-D1 Upsets
Over the past decade, Division I teams lose to non-Division I opponents in 0.74-3.24% of matchups, with most seasons falling in the 1-2% range. Three such losses in the opening week represents an unusual concentration of failures.
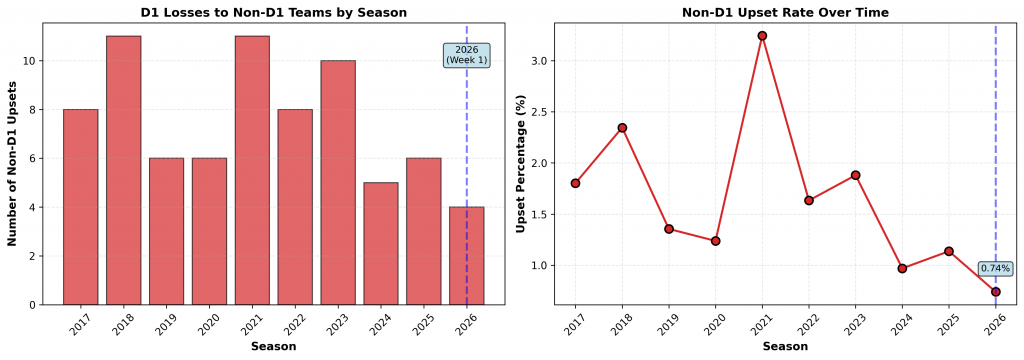
Figure 2: Left panel shows annual counts of D1 losses to non-D1 teams. Right panel displays the upset percentage over time. The 2026 season already has three such upsets from just Week 1.
The historical data confirms the rarity of these outcomes. While individual seasons occasionally see elevated rates (2021 saw 11 upsets, 3.24%), most years remain well below 2%. Three upsets in seven days suggests 2025-26 may see an elevated total.
The Bottom 10
#10: High Point Destroys Furman
Final Score: High Point 97, Furman 71
Date: November 3, 2025
Upset Magnitude: 31.2 points
Predicted: Furman 78.8, High Point 73.6
Actual: High Point 97, Furman 71
Our model favored Furman by 5.2 points. Instead, High Point won by 26 points—a 31.2-point swing.
Game Flow:
Furman established an early double-digit lead within the first 10 minutes and dominated the first half, leading 55-40 at halftime. However, High Point staged a remarkable second-half comeback, outscoring Furman decisively to turn a 15-point halftime deficit into a 26-point victory. The final margin underscores High Point’s complete control in the second half.
#9: Oklahoma State Dismantles Texas A&M
Final Score: Oklahoma State 87, Texas A&M 63
Date: November 9, 2025
Upset Magnitude: 33.7 points
Predicted: Oklahoma State 71.0, Texas A&M 80.7
Actual: Oklahoma State 87, Texas A&M 63
Our model favored Texas A&M by 9.7 points on the road. Instead, Oklahoma State delivered a 24-point victory—a 33.7-point turnaround.
Game Flow:
Oklahoma State established an early double-digit lead within the first 10 minutes and never looked back. The Aggies attempted a brief challenge but could not sustain momentum. Oklahoma State maintained comfortable control throughout.
What Went Wrong for Texas A&M:
- Shooting was abysmal: 20-62 (32.3%) from the field and 9-35 (25.7%) from three-point range
- 15 turnovers compared to 9 for Oklahoma State contributed to the lopsided result
- Despite competing reasonably on the boards (33-36 deficit), Texas A&M’s inability to convert possessions into points was fatal
Oklahoma State shot 48.5% from the field and controlled pace throughout. Texas A&M’s poor shooting rendered other efforts meaningless, resulting in a thorough defeat our model failed to anticipate.
#8: UNLV Routes Chattanooga
Final Score: UNLV 101, Chattanooga 69
Date: November 8, 2025
Upset Magnitude: 34.0 points
Predicted: UNLV 73.5, Chattanooga 75.5
Actual: UNLV 101, Chattanooga 69
Our model gave Chattanooga a slight edge. UNLV had different ideas, winning by 32 points.
What Went Wrong for Chattanooga:
- Foul trouble was severe: 2 players fouled out, and 3 starters accumulated 4+ fouls, decimating rotation depth
- Free throw disparity was significant (15 attempts vs 37 for UNLV), indicating Chattanooga couldn’t attack the paint without fouling
- Chattanooga was outrebounded 20-36, giving UNLV easy scoring opportunities
- UNLV’s superior ball movement (23 assists vs 16 for Chattanooga) created open looks
Despite shooting respectably (45.3% FG, 33.3% 3PT), Chattanooga’s foul trouble and rebounding deficiency rendered offensive efficiency irrelevant.
#7: Bowling Green Destroys Texas State
Final Score: Bowling Green 83, Texas State 48
Date: November 3, 2025
Upset Magnitude: 37.0 points
Predicted: Bowling Green 75.0, Texas State 77.0
Actual: Bowling Green 83, Texas State 48
A predicted two-point Texas State victory became a 35-point demolition by Bowling Green.
Game Flow:
Bowling Green established an early double-digit lead within the first 10 minutes. The final 35-point margin reflects complete domination from opening tip to final buzzer.
What Went Wrong for Texas State:
- Three-point shooting collapsed at 3-17 (17.6%), eliminating any chance of an efficient offense
- Free throw attempts were minimal (3-7), indicating an inability to attack the basket effectively
- Bowling Green’s ball movement was superior (16 assists vs 10 for Texas State)
Bowling Green shot 53.4% from the field and 45.5% from three-point range, executing its game plan to perfection while Texas State struggled to generate quality scoring opportunities.
#6: Stephen F. Austin Dominates Arkansas State
Final Score: Stephen F. Austin 90, Arkansas State 65
Date: November 7, 2025
Upset Magnitude: 37.7 points
Predicted: Stephen F. Austin 66.8, Arkansas State 79.5
Actual: Stephen F. Austin 90, Arkansas State 65
Our model favored Arkansas State by 12.7 points. Instead, Stephen F. Austin won by 25 points—a 37.7-point swing.
Game Flow:
Stephen F. Austin dominated the first half, leading 46-31 at halftime. The rout continued in the second half with Stephen F. Austin maintaining control throughout. The final 25-point margin reflects consistent superiority.
What Went Wrong for Arkansas State:
- Shooting was dismal: 17-54 (31.5%) from the field with particularly poor three-point shooting at 5-27 (18.5%)
- Arkansas State was thoroughly outrebounded 22-40, giving Stephen F. Austin numerous second-chance opportunities
- Despite getting to the free throw line frequently (33 attempts to 19 for Stephen F. Austin), the poor shooting from the floor was insurmountable
Stephen F. Austin’s 48.6% shooting and 16 offensive rebounds created consistent scoring opportunities that Arkansas State could not match.
#5: Vanderbilt Demolishes Lipscomb
Final Score: Vanderbilt 105, Lipscomb 61
Date: November 3, 2025
Upset Magnitude: 44.4 points
Predicted: Vanderbilt 77.1, Lipscomb 77.4
Actual: Vanderbilt 105, Lipscomb 61
Our model anticipated a virtually even matchup, predicting a one-point game. Instead, Vanderbilt delivered a 44-point blowout.
Game Flow:
Vanderbilt established an early double-digit lead within the first 10 minutes and dominated the first half, leading 56-26 at halftime. The rout continued in the second half with Vanderbilt maintaining control throughout. The final 44-point margin does not fully capture the dominance displayed by Vanderbilt.
What Went Wrong for Lipscomb:
- Shooting was catastrophic: 17-56 (30.4%) from the field and 6-26 (23.1%) from three-point range
- 17 turnovers compared to just 6 for Vanderbilt compounded the shooting struggles
- Vanderbilt’s ball movement was superior (23 assists vs 8 for Lipscomb)
- Despite winning the free throw battle percentage-wise (95.5% vs 70.6%), Lipscomb’s poor shooting from the floor negated this advantage
Vanderbilt shot 55.9% from the field and an exceptional 54.8% from three-point range, overwhelming Lipscomb from start to finish.
#4: Maryland Overcomes Coppin State Despite Upset Prediction
Final Score: Maryland 83, Coppin State 61
Date: November 3, 2025
Upset Magnitude: 55.4 points
Predicted: Maryland 58.4, Coppin State 91.7
Actual: Maryland 83, Coppin State 61
This game represents the largest prediction error of the week, though Maryland ultimately won. Our model significantly underestimated Maryland’s capability while overestimating Coppin State, resulting in a 55-point differential between predicted and actual margins.
Game Flow:
Maryland dominated the first half, leading 47-32 at halftime. The rout continued in the second half with Maryland maintaining control throughout.
What Went Wrong for Coppin State:
- Coppin State committed 20 turnovers compared to 12 for Maryland, directly contributing to the defeat
- One player fouled out, and two starters accumulated 4+ fouls, limiting their availability
- Maryland dominated at the free throw line, converting 23-25 (92.0%) while Coppin State managed 12-16 (75.0%)
Despite competitive shooting percentages, Coppin State’s inability to protect the ball and manage foul trouble prevented any chance of pulling off the upset our model incorrectly forecasted.
#3: Wilmington Defeats Delaware
Final Score: Wilmington (DE) 71, Delaware 62
Date: November 7, 2025
Venue: Delaware (Home)
Delaware’s nine-point home loss to Wilmington, a non-Division I program, represents not just an upset but a thorough defeat. Unlike close games that come down to final possessions, Delaware was outplayed decisively by a non-Division I opponent on its own court. The margin suggests fundamental execution issues that extend beyond a few missed opportunities.
Game Flow:
After a competitive first half (Delaware 37, Wilmington 38), Wilmington pulled away in the second half to secure the nine-point victory. The game featured 9 ties, indicating competitiveness early, but Wilmington’s ability to maintain a lead and expand it in the second half demonstrates control when it mattered most.
Home-court advantage should be decisive against non-Division I competition, yet Delaware failed to leverage that advantage. The nine-point margin indicates this was not a fluke finish but a well-earned victory for Wilmington.
#2: Northwood Upsets Western Michigan
Final Score: Northwood (MI) 85, Western Michigan 81
Date: November 6, 2025
Venue: Western Michigan (Home)
Western Michigan became the second Division I victim of a non-Division I upset, falling to Northwood on its home floor. The four-point loss indicates competitive play, but the result remains unacceptable for a Division I program.
Game Flow:
After a competitive first half (W Michigan 39, Northwood 44), the game remained close throughout, decided by just 4 points. With 6 ties and 2 lead changes, this was a genuine battle that Northwood won through execution down the stretch.
Home-court advantage should be decisive against non-Division I competition, yet Western Michigan failed to leverage that advantage. The relatively close margin makes the loss more palatable than a blowout, but a home defeat to a non-Division I opponent remains an unacceptable outcome regardless of final score.
#1: Hawai’i Pacific Stuns Boise State
Final Score: Hawai’i Pacific 79, Boise State 78
Date: November 3, 2025
Venue: Boise State (Home)
The season opened with a stunner in Idaho. Boise State, playing its first game of the season at home, fell in a one-point heartbreaker to Hawai’i Pacific, a non-Division I program. Home losses to non-Division I opponents rank among the most embarrassing defeats in college basketball, and Boise State’s inability to protect its home court in the season opener sets an unwelcome tone for the year ahead.
Game Flow:
The game was tightly contested early with 17 ties and 8 lead changes. After a competitive first half (Boise State 37, Hawai’i Pacific 38), the game remained close throughout, decided by just 1 point. This was not a case of Boise State being overwhelmed—they had numerous opportunities to win this game but failed to execute in crucial moments.
The razor-thin margin makes this particularly painful. Boise State was one possession away from victory multiple times but could not close. For a Division I program on its home floor, this represents a catastrophic failure. The competitive nature of the game throughout only emphasizes that Boise State should have won—and didn’t.
Model Performance
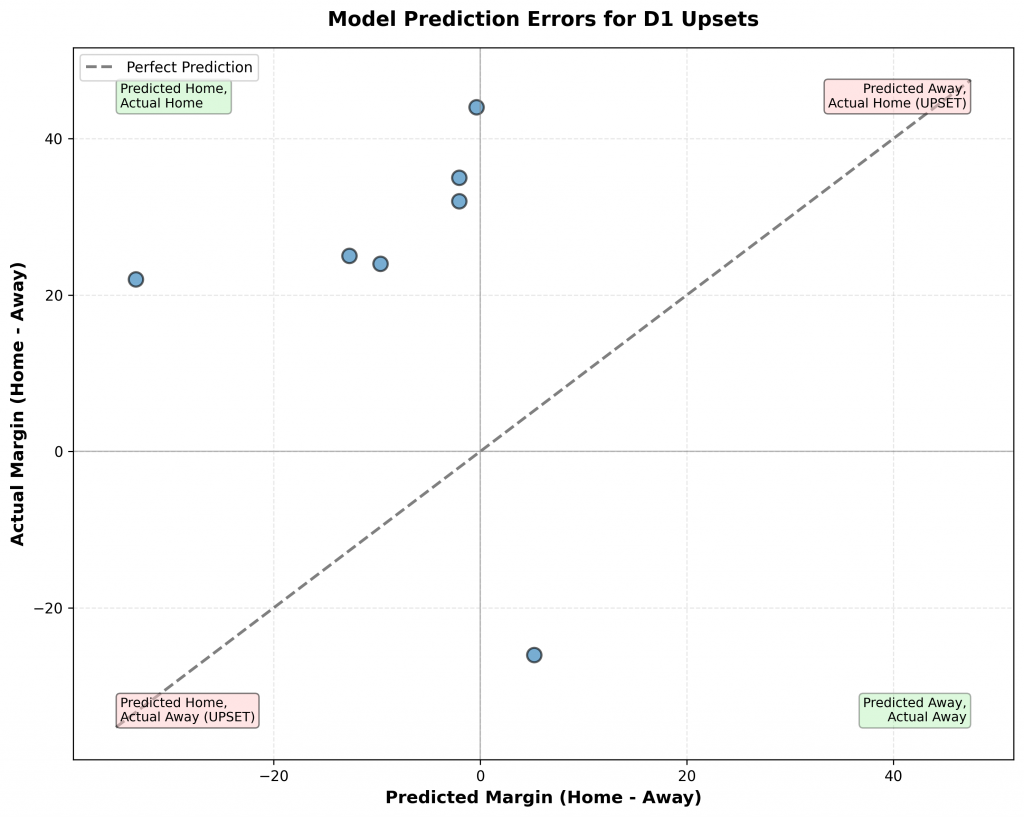
Figure 3: Scatter plot showing predicted margins versus actual margins for D1 upsets. Points in the upper-left and lower-right quadrants represent upsets where the model predicted the wrong winner. The distance from the diagonal line indicates prediction error magnitude.
The first week of the season provided a challenging test for our predictive model. While many games aligned with expectations, 70 of the completed matchups produced results contrary to predictions. The largest errors tended to involve teams with limited historical data or significant roster changes, highlighting the difficulty of early-season forecasting when team identities remain unclear.
The three non-Division I upsets represent failures that no predictive model anticipates, as Division I teams are universally expected to defeat non-Division I opponents, particularly at home. These results suggest deeper issues with the affected programs that will require attention throughout the season.
Looking Ahead
Week 1 established that the 2025-26 season will be unpredictable. Three home losses to non-Division I opponents in the opening week signal that several programs face substantial challenges ahead. For Boise State, Western Michigan, and Delaware, these defeats will require honest assessment of roster capabilities and strategic adjustments.
For the remaining teams that suffered upsets, early-season struggles provide opportunities to identify weaknesses and implement corrections before conference play begins. Teams like Texas A&M, Lipscomb, and Arkansas State must address the shooting, turnover, and defensive issues that led to blowout defeats.
As the season progresses and teams establish their identities, prediction accuracy should improve. Week 1 serves as a reminder that college basketball, particularly early in the season, remains resistant to perfect forecasting—and that’s part of what makes it compelling.
Analysis based on games played November 3-9, 2025. Predictions generated using our advanced statistical model incorporating Four Factors efficiency metrics and pace-adjusted statistics from publicly available data.