Week 1: 2026’s Biggest Bullies
November 14, 2025College basketball efficiency rankings can be misleading. Some teams inflate their numbers by demolishing weaker opponents far beyond what statistical models predict, while simultaneously failing to meet expectations against quality competition.
This weekly feature identifies the biggest “bullies” in Division I basketball: teams whose efficiency metrics are artificially elevated by their performance against inferior opponents.
The rankings below count from #1 (biggest bully) to #25, highlighting teams that excel at padding stats against overmatched opponents while struggling to meet expectations against quality competition.
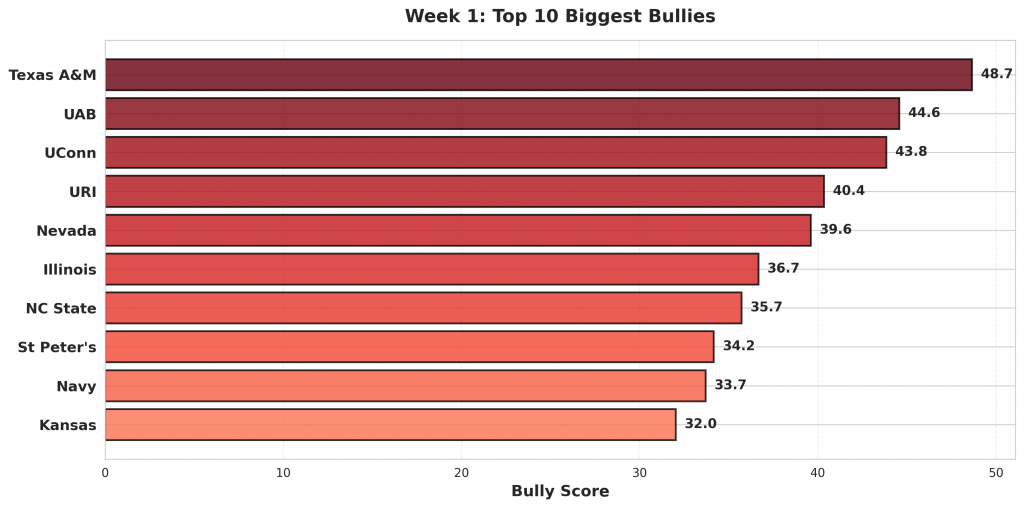
Figure 1: Top 10 teams with the highest bully scores in Week 1. Bully scores reflect the combination of overperformance against weak opponents and underperformance against quality competition.
#1: Texas A&M (2-1)
Working off efficiency projections, Texas A&M was expected to defeat Texas Southern by 18 points. Instead, Texas A&M poured it on, routing them 104-70, winning by 34 points and exceeding the projection by 16 points. Against higher-rated Oklahoma State, however, Texas A&M failed to meet expectations. They lost 87-63, falling short by 24 points when they were projected to win by 10.
Bully Metrics: Exceeded projections by 29.9 total points against weak opponents (2 games); underperformed by 33.7 points against quality competition (1 games).
#2: UAB (1-1)
Against overmatched Mississippi Valley State, UAB poured it on, routing them 106-55. Projected to win by 33, they instead won by 51, exceeding expectations by 18 points. Against higher-rated NC State, however, UAB failed to meet expectations. They lost 94-70, falling short by 24 points when they were projected to win by 2.
Bully Metrics: Exceeded projections by 18.0 total points against weak opponents (1 games); underperformed by 26.5 points against quality competition (1 games).
#3: UConn (3-0)
UConn was favored by 19 points over UMass Lowell. They poured it on, routing them 110-47, winning by 63 and far exceeding that projection by 44 points.
Bully Metrics: Exceeded projections by 43.8 total points against weak opponents (1 games).
#4: URI (1-1)
Projected to win by 13 over Stetson, URI instead poured it on, routing them 93-62, winning by 31 points and exceeding the projection by 18 points. Against higher-rated Tulsa, however, URI failed to meet expectations. They lost 82-65, falling short by 17 points when they were projected to win by 6.
Bully Metrics: Exceeded projections by 17.9 total points against weak opponents (1 games); underperformed by 22.5 points against quality competition (1 games).
#5: Nevada (2-0)
Working off efficiency projections, Nevada was expected to defeat Louisiana Tech by 2 points. Instead, Nevada poured it on, routing them 77-50, winning by 27 points and exceeding the projection by 25 points. Against higher-rated Pacific, Nevada won 78-77 but underperformed the 16-point projection by 15 points.
Bully Metrics: Exceeded projections by 24.6 total points against weak opponents (1 games); underperformed by 15.0 points against quality competition (1 games).
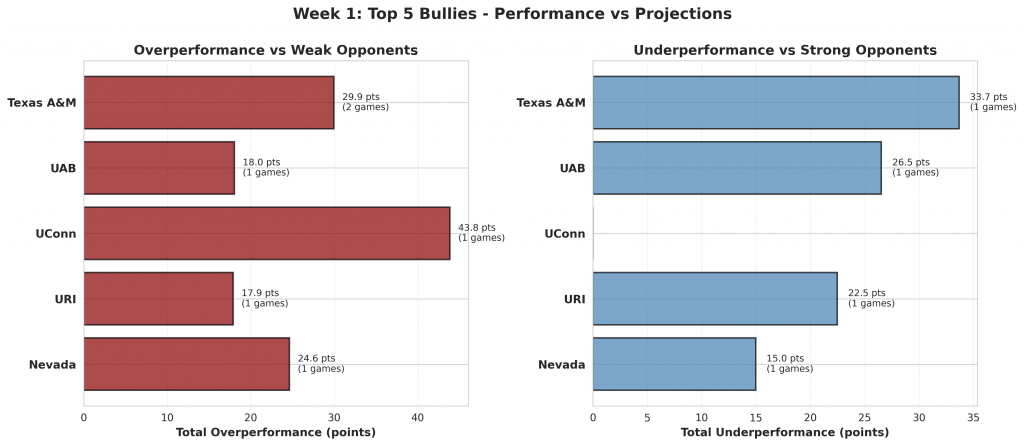
Figure 2: Performance comparison for the top 5 biggest bullies. Red bars show total overperformance against weak opponents; blue bars show total underperformance against strong opponents.
#6: Illinois (2-0)
Against overmatched Jackson State, Illinois poured it on, routing them 113-55. Projected to win by 21, they instead won by 58, exceeding expectations by 37 points. To their credit, Illinois met expectations against stronger Florida Gulf Coast, suggesting they may simply be that good rather than inflating numbers against weak competition.
Bully Metrics: Exceeded projections by 36.7 total points against weak opponents (1 games); underperformed by 0.0 points against quality competition (1 games).
#7: NC State (2-0)
NC State was favored by 12 points over North Carolina Central. They poured it on, routing them 114-66, winning by 48 and far exceeding that projection by 36 points.
Bully Metrics: Exceeded projections by 35.7 total points against weak opponents (1 games).
#8: St Peter’s (1-1)
Projected to win by 3 over Fairleigh Dickinson, St Peter’s instead dominated Fairleigh Dickinson 93-83, winning by 10 points and exceeding the projection by 7 points. Against higher-rated Seton Hall, however, St Peter’s failed to meet expectations. They lost 77-50, falling short by 27 points when they were projected to lose by 0.
Bully Metrics: Exceeded projections by 7.3 total points against weak opponents (1 games); underperformed by 26.8 points against quality competition (1 games).
#9: Navy (1-1)
Working off efficiency projections, Navy was expected to defeat Presbyterian by 3 points. Instead, Navy poured it on, routing them 76-55, winning by 21 points and exceeding the projection by 18 points. Against higher-rated Yale, however, Navy failed to meet expectations. They lost 97-68, falling short by 29 points when they were projected to lose by 14.
Bully Metrics: Exceeded projections by 18.4 total points against weak opponents (1 games); underperformed by 15.3 points against quality competition (1 games).
#10: Kansas (1-1)
Against overmatched Green Bay, Kansas poured it on, routing them 94-51. Projected to win by 23, they instead won by 43, exceeding expectations by 20 points. Against higher-rated North Carolina, however, Kansas failed to meet expectations. They lost 87-74, falling short by 13 points when they were projected to lose by 1.
Bully Metrics: Exceeded projections by 19.7 total points against weak opponents (1 games); underperformed by 12.3 points against quality competition (1 games).
#11: Georgia (3-0)
Georgia was favored by 25 points over Maryland Eastern Shore. They poured it on, routing them 94-29, winning by 65 and far exceeding that projection by 40 points. To their credit, Georgia met expectations against stronger Bellarmine, suggesting they may simply be that good rather than inflating numbers against weak competition.
Bully Metrics: Exceeded projections by 63.4 total points against weak opponents (2 games); underperformed by 0.0 points against quality competition (1 games).
#12: TCU (2-1)
Projected to win by 10 over Saint Francis, TCU instead poured it on, routing them 104-63, winning by 41 points and exceeding the projection by 31 points.
Bully Metrics: Exceeded projections by 31.2 total points against weak opponents (1 games).
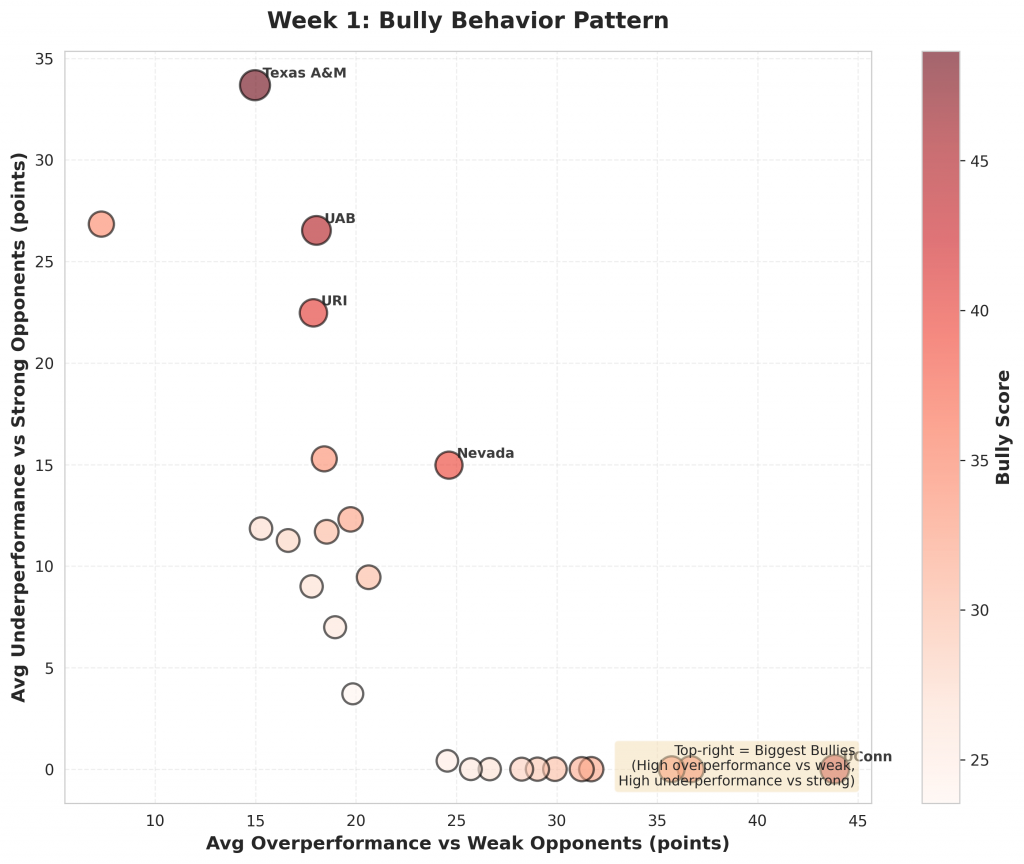
Figure 3: Scatter plot showing the relationship between overperformance against weak opponents (x-axis) and underperformance against strong opponents (y-axis). Bubble size and color indicate bully score magnitude. Top-right quadrant represents the biggest bullies.
#13: Tennessee (2-0)
Working off efficiency projections, Tennessee was expected to defeat Northern Kentucky by 20 points. Instead, Tennessee poured it on, routing them 95-56, winning by 39 points and exceeding the projection by 18 points. Against higher-rated Mercer, Tennessee won 76-61 but underperformed the 27-point projection by 12 points.
Bully Metrics: Exceeded projections by 18.5 total points against weak opponents (1 games); underperformed by 11.7 points against quality competition (1 games).
#14: Bradley (1-1)
Against overmatched Central Michigan, Bradley poured it on, routing them 85-54. Projected to win by 10, they instead won by 31, exceeding expectations by 21 points. Against higher-rated St. Bonaventure, however, Bradley failed to meet expectations. They lost 69-63, falling short by 6 points when they were projected to win by 3.
Bully Metrics: Exceeded projections by 20.6 total points against weak opponents (1 games); underperformed by 9.4 points against quality competition (1 games).
#15: Louisville (2-0)
Louisville was favored by 15 points over South Carolina State. They poured it on, routing them 104-45, winning by 59 and far exceeding that projection by 44 points.
Bully Metrics: Exceeded projections by 59.8 total points against weak opponents (2 games).
#16: Syracuse (2-0)
Projected to win by 8 over Binghamton, Syracuse instead poured it on, routing them 85-47, winning by 38 points and exceeding the projection by 30 points.
Bully Metrics: Exceeded projections by 58.1 total points against weak opponents (2 games).
#17: Gonzaga (2-0)
Working off efficiency projections, Gonzaga was expected to defeat Texas Southern by 27 points. Instead, Gonzaga poured it on, routing them 98-43, winning by 55 points and exceeding the projection by 28 points. To their credit, Gonzaga met expectations against stronger Oklahoma, suggesting they may simply be that good rather than inflating numbers against weak competition.
Bully Metrics: Exceeded projections by 28.2 total points against weak opponents (1 games); underperformed by 0.0 points against quality competition (1 games).
#18: Dayton (2-0)
Against overmatched Canisius, Dayton poured it on, routing them 88-48. Projected to win by 23, they instead won by 40, exceeding expectations by 17 points. Against higher-rated UMBC, Dayton won 77-71 but underperformed the 17-point projection by 11 points.
Bully Metrics: Exceeded projections by 16.6 total points against weak opponents (1 games); underperformed by 11.3 points against quality competition (1 games).
#19: Florida (1-1)
Florida was favored by 25 points over North Florida. They poured it on, routing them 104-64, winning by 40 and far exceeding that projection by 15 points. Against higher-rated Arizona, however, Florida failed to meet expectations. They lost 93-87, falling short by 6 points when they were projected to win by 6.
Bully Metrics: Exceeded projections by 15.3 total points against weak opponents (1 games); underperformed by 11.9 points against quality competition (1 games).
#20: Fresno State (2-1)
Projected to win by 2 over Long Beach State, Fresno State instead poured it on, routing them 82-62, winning by 20 points and exceeding the projection by 18 points. Against higher-rated South Carolina Upstate, however, Fresno State failed to meet expectations. They lost 67-66, falling short by 1 points when they were projected to win by 8.
Bully Metrics: Exceeded projections by 17.8 total points against weak opponents (1 games); underperformed by 9.0 points against quality competition (1 games).
#21: Minnesota (2-0)
Working off efficiency projections, Minnesota was expected to defeat Alcorn State by 10 points. Instead, Minnesota poured it on, routing them 95-50, winning by 45 points and exceeding the projection by 35 points.
Bully Metrics: Exceeded projections by 53.3 total points against weak opponents (2 games).
#22: St John’s (1-1)
Against overmatched Quinnipiac, St John’s poured it on, routing them 108-74. Projected to win by 15, they instead won by 34, exceeding expectations by 19 points. Against higher-rated Alabama, however, St John’s failed to meet expectations. They lost 103-96, falling short by 7 points when they were projected to lose by 0.
Bully Metrics: Exceeded projections by 19.0 total points against weak opponents (1 games); underperformed by 7.0 points against quality competition (1 games).
#23: Kansas State (2-0)
Kansas State was favored by 3 points over UNC Greensboro. They poured it on, routing them 93-64, winning by 29 and far exceeding that projection by 26 points. To their credit, Kansas State met expectations against stronger Bellarmine, suggesting they may simply be that good rather than inflating numbers against weak competition.
Bully Metrics: Exceeded projections by 25.7 total points against weak opponents (1 games); underperformed by 0.0 points against quality competition (1 games).
#24: USF (1-1)
Projected to win by 10 over Florida A&M, USF instead poured it on, routing them 102-67, winning by 35 points and exceeding the projection by 24 points. Against higher-rated George Washington, however, USF failed to meet expectations. They lost 99-95, falling short by 4 points when they were projected to lose by 4.
Bully Metrics: Exceeded projections by 24.5 total points against weak opponents (1 games); underperformed by 0.4 points against quality competition (1 games).
#25: Oklahoma (1-1)
Working off efficiency projections, Oklahoma was expected to defeat Saint Francis by 16 points. Instead, Oklahoma poured it on, routing them 102-66, winning by 36 points and exceeding the projection by 20 points. Against higher-rated Gonzaga, however, Oklahoma failed to meet expectations. They lost 83-68, falling short by 15 points when they were projected to lose by 11.
Bully Metrics: Exceeded projections by 19.8 total points against weak opponents (1 games); underperformed by 3.7 points against quality competition (1 games).
What This Means
These rankings highlight teams whose efficiency numbers may not tell the full story. While crushing inferior opponents is expected, doing so far beyond statistical projections while simultaneously underperforming against quality teams suggests inflated metrics.
As the season progresses, these teams will face the ultimate test: can they maintain their efficiency rankings when conference play forces them to face quality opponents night after night?
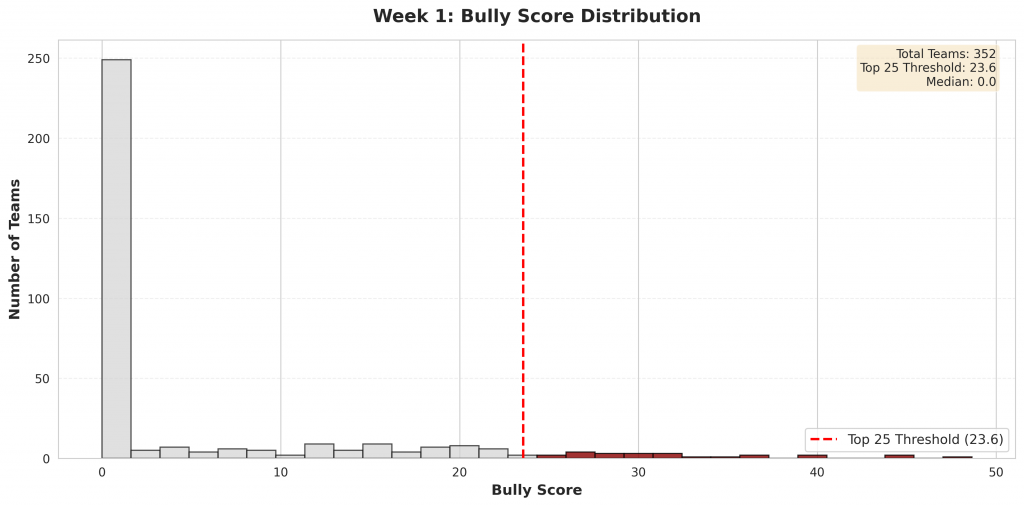
Figure 4: Distribution of bully scores across all Division I teams. The top 25 bullies (highlighted in red) represent teams whose efficiency metrics are most inflated by their performance patterns.
Check back next week for updated bully rankings.