Big Sky Update: Week 1
November 16, 2025The Big Sky enters Week 1 with teams showing diverse trending patterns. This analysis examines each team’s performance trends using MACD (Moving Average Convergence Divergence) indicators to identify not just where teams stand, but where they’re headed.
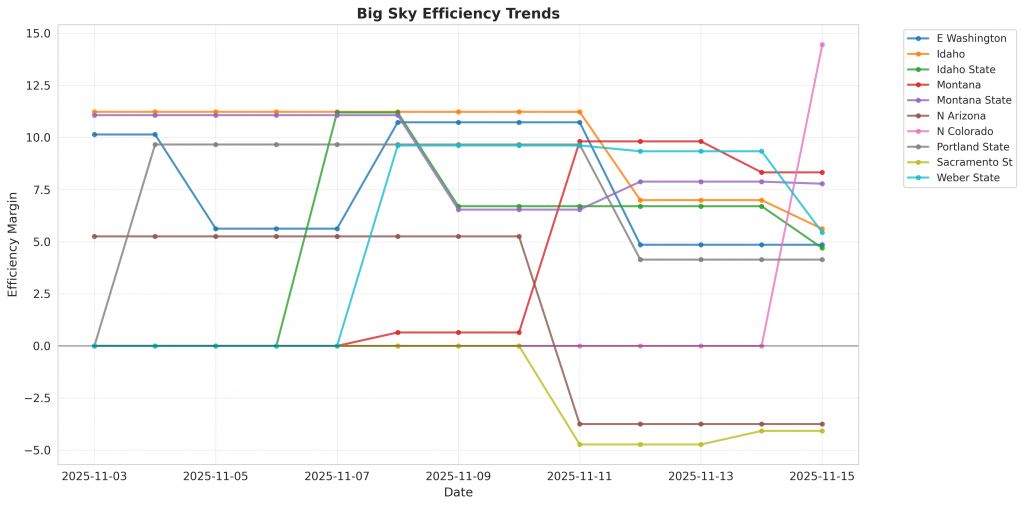
Figure 1: Efficiency margin trends for Big Sky teams throughout the season. Teams trending upward show improving performance, while downward trends indicate struggles.
Conference Snapshot
- Week Dates: November 03 – November 09, 2025
- Trending Up (Efficiency): Idaho, Sacramento St
- Trending Down (Efficiency): E Washington, Idaho State, Montana, Montana State, N Arizona
Team-by-Team Analysis
E Washington
Record: 0-4 | Elo: 1426.7 (ranked 285 of 365) | Efficiency Margin: +4.85 (ranked 195 of 365)
Insufficient games played for meaningful trend analysis (MACD requires 12+ games).
Idaho
Record: 1-2 | Elo: 1425.2 (ranked 289 of 365) | Efficiency Margin: +5.62 (ranked 189 of 365)
Offensive Trends:
- FTR (Free Throw Rate (FTM/FGA – getting to the line and converting)): Currently ranked 195 of 365 in D1. Trending up strongly.
Defensive Trends:
- DR_PCT (Defensive Rebound Rate (% of available defensive rebounds secured)): Currently ranked 15 of 365 in D1. Trending up strongly.
- FTR (FTR Allowed (opponent free throws – lower is better)): Currently ranked 284 of 365 in D1. Trending up strongly.
Idaho State
Record: 2-2 | Elo: 1456.2 (ranked 257 of 365) | Efficiency Margin: +4.70 (ranked 198 of 365)
Offensive Trends:
- EFG (Effective Field Goal % (adjusts for 3-pointers being worth more)): Currently ranked 144 of 365 in D1. Trending up strongly.
- FTR (Free Throw Rate (FTM/FGA – getting to the line and converting)): Currently ranked 266 of 365 in D1. Trending down moderately.
Defensive Trends:
- FTR (FTR Allowed (opponent free throws – lower is better)): Currently ranked 38 of 365 in D1. Trending down strongly.
- EFG (eFG% Allowed (lower is better – opponents shooting less efficiently)): Currently ranked 356 of 365 in D1. Trending up strongly.
Montana
Record: 3-1 | Elo: 1591.5 (ranked 65 of 365) | Efficiency Margin: +8.33 (ranked 163 of 365)
Defensive Trends:
- DR_PCT (Defensive Rebound Rate (% of available defensive rebounds secured)): Currently ranked 201 of 365 in D1. Trending down moderately.
Montana State
Record: 0-4 | Elo: 1459.3 (ranked 251 of 365) | Efficiency Margin: +7.78 (ranked 169 of 365)
Offensive Trends:
- FTR (Free Throw Rate (FTM/FGA – getting to the line and converting)): Currently ranked 353 of 365 in D1. Trending down strongly.
Defensive Trends:
- FTR (FTR Allowed (opponent free throws – lower is better)): Currently ranked 252 of 365 in D1. Trending up moderately.
- DR_PCT (Defensive Rebound Rate (% of available defensive rebounds secured)): Currently ranked 199 of 365 in D1. Trending down moderately.
N Arizona
Record: 0-2 | Elo: 1446.5 (ranked 263 of 365) | Efficiency Margin: -3.75 (ranked 283 of 365)
Insufficient games played for meaningful trend analysis (MACD requires 12+ games).
N Colorado
Record: 1-0 | Elo: 1569.6 (ranked 90 of 365) | Efficiency Margin: +14.46 (ranked 120 of 365)
Offensive Trends:
- FTR (Free Throw Rate (FTM/FGA – getting to the line and converting)): Currently ranked 173 of 365 in D1. Trending up strongly.
Defensive Trends:
- DR_PCT (Defensive Rebound Rate (% of available defensive rebounds secured)): Currently ranked 57 of 365 in D1. Trending down moderately.
Portland State
Record: 0-2 | Elo: 1480.5 (ranked 219 of 365) | Efficiency Margin: +4.14 (ranked 201 of 365)
Offensive Trends:
- FTR (Free Throw Rate (FTM/FGA – getting to the line and converting)): Currently ranked 330 of 365 in D1. Trending down strongly.
Defensive Trends:
- FTR (FTR Allowed (opponent free throws – lower is better)): Currently ranked 316 of 365 in D1. Trending up strongly.
Sacramento St
Record: 0-2 | Elo: 1328.1 (ranked 357 of 365) | Efficiency Margin: -4.08 (ranked 285 of 365)
Offensive Trends:
- EFG (Effective Field Goal % (adjusts for 3-pointers being worth more)): Currently ranked 110 of 365 in D1. Trending up strongly.
Defensive Trends:
- DR_PCT (Defensive Rebound Rate (% of available defensive rebounds secured)): Currently ranked 57 of 365 in D1. Trending down moderately.
- EFG (eFG% Allowed (lower is better – opponents shooting less efficiently)): Currently ranked 250 of 365 in D1. Trending up moderately.
Weber State
Record: 1-3 | Elo: 1426.7 (ranked 284 of 365) | Efficiency Margin: +5.44 (ranked 191 of 365)
Offensive Trends:
- EFG (Effective Field Goal % (adjusts for 3-pointers being worth more)): Currently ranked 312 of 365 in D1. Trending down strongly.
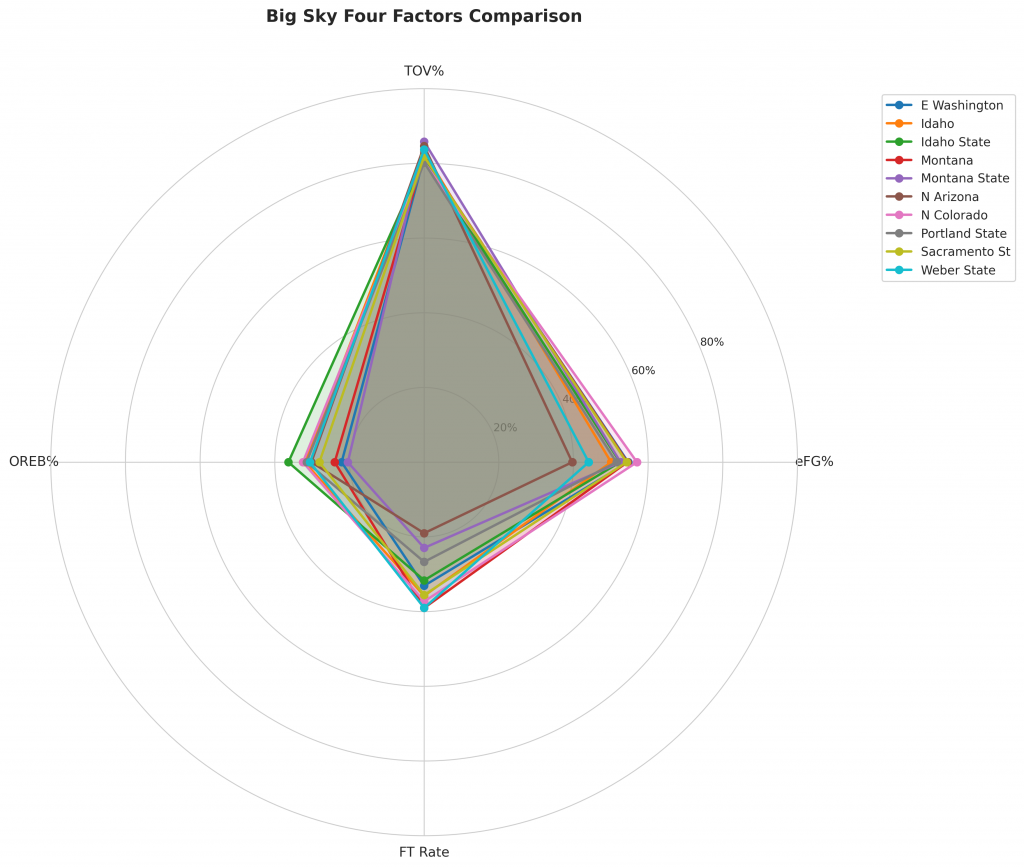
Figure 2: Four Factors comparison across Big Sky teams. The radar chart shows each team’s offensive efficiency (eFG%), ball security (TOV%), rebounding (OREB%), and free throw generation (FT Rate).
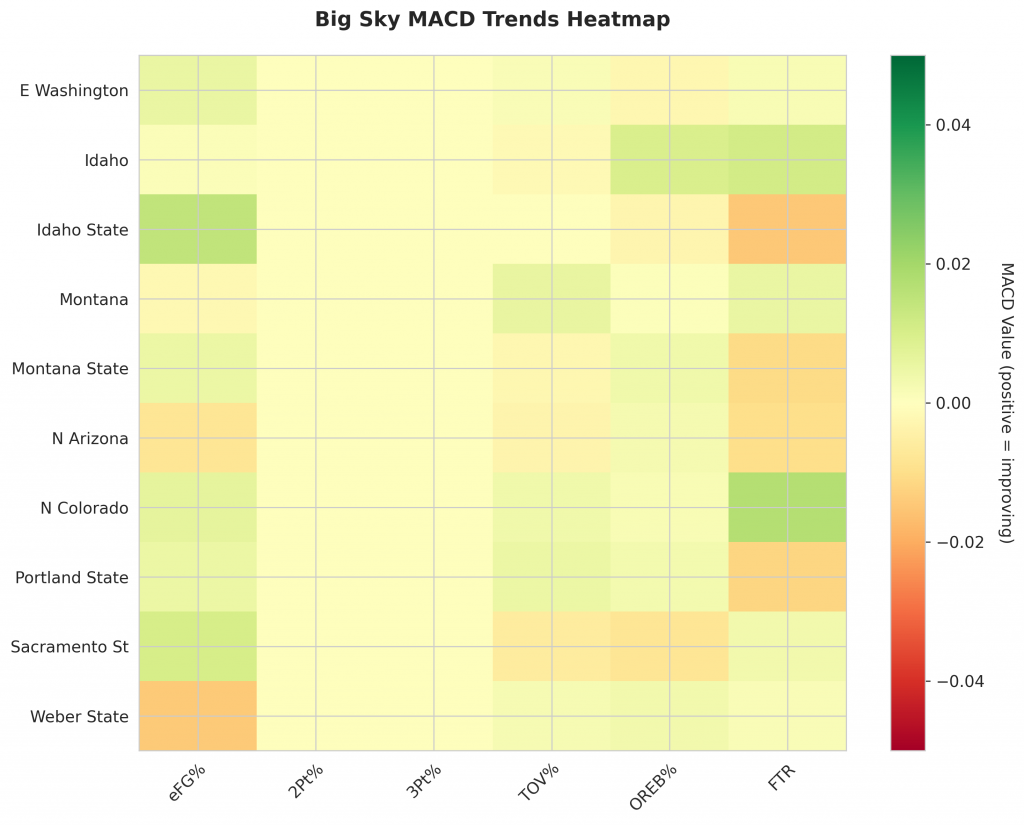
Figure 3: MACD trends heatmap showing which metrics are improving (green) or declining (red) for each team. Stronger colors indicate more pronounced trends.
Looking Ahead
As Big Sky teams continue their season, the MACD trending indicators will help identify which teams are genuinely improving versus those riding unsustainable momentum. Check back next week for updated analysis.
Metrics Glossary
Four Factors (Dean Oliver’s framework for basketball success):
- eFG% (Effective Field Goal %): Field goal percentage adjusted for 3-pointers being worth more (FGM + 0.5×3PM) / FGA. Higher is better offensively, lower is better defensively.
- TOV% (Turnover Rate): Turnovers per 100 possessions. Lower is better offensively (taking care of the ball), higher is better defensively (forcing turnovers).
- OREB% / DREB% (Offensive/Defensive Rebound Rate): Percentage of available rebounds grabbed. Offensive rebounds create second-chance points; defensive rebounds end opponent possessions.
- FTR (Free Throw Rate): Free throws made per field goal attempt (FTM/FGA). Measures ability to get to the line AND convert. Higher is better offensively, lower is better defensively.
Other Metrics:
- Elo Rating: Chess-style rating system that updates based on game results and opponent strength. Higher Elo indicates stronger team.
- Efficiency Margin: Point differential per 100 possessions (Offensive Efficiency – Defensive Efficiency). Accounts for pace of play.
- MACD (Moving Average Convergence Divergence): Trend indicator comparing 12-game and 26-game exponential moving averages. Positive MACD = improving trend, Negative MACD = declining trend.
Analysis powered by HoopSci’s advanced metrics and MACD trending indicators.