Big West Update: Week 1
November 16, 2025The Big West enters Week 1 with teams showing diverse trending patterns. This analysis examines each team’s performance trends using MACD (Moving Average Convergence Divergence) indicators to identify not just where teams stand, but where they’re headed.
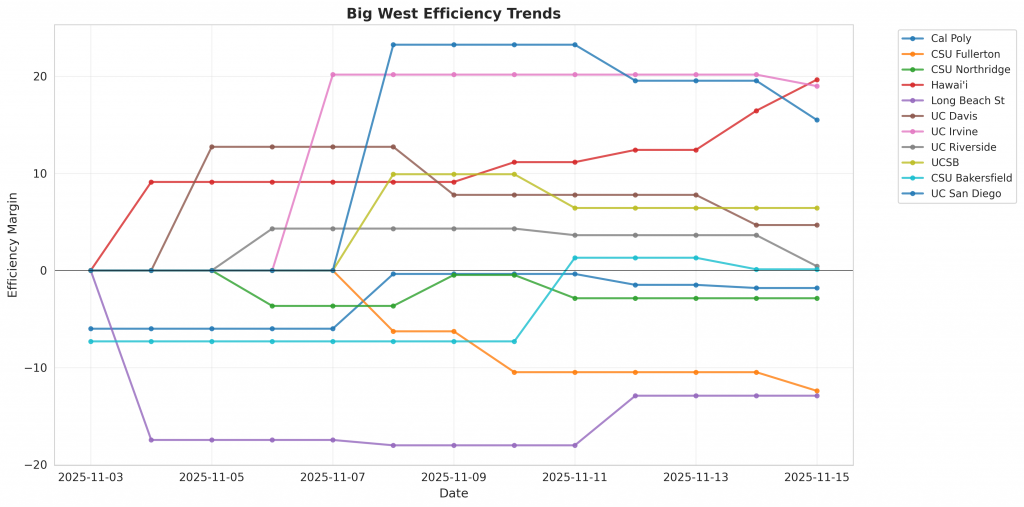
Figure 1: Efficiency margin trends for Big West teams throughout the season. Teams trending upward show improving performance, while downward trends indicate struggles.
Conference Snapshot
- Week Dates: November 03 – November 09, 2025
- Trending Up (Efficiency): UCSB
- Trending Down (Efficiency): Cal Poly, CSU Fullerton, CSU Northridge, Hawai’i, Long Beach St
Team-by-Team Analysis
CSU Bakersfield
Record: 2-2 | Elo: 1435.1 (ranked 277 of 365) | Efficiency Margin: +0.12 (ranked 239 of 365)
Offensive Trends:
- FTR (Free Throw Rate (FTM/FGA – getting to the line and converting)): Currently ranked 63 of 365 in D1. Trending up strongly.
Defensive Trends:
- FTR (FTR Allowed (opponent free throws – lower is better)): Currently ranked 240 of 365 in D1. Trending down strongly.
CSU Fullerton
Record: 1-3 | Elo: 1354.6 (ranked 348 of 365) | Efficiency Margin: -12.40 (ranked 334 of 365)
Insufficient games played for meaningful trend analysis (MACD requires 12+ games).
CSU Northridge
Record: 1-2 | Elo: 1529.0 (ranked 139 of 365) | Efficiency Margin: -2.86 (ranked 274 of 365)
Defensive Trends:
- FTR (FTR Allowed (opponent free throws – lower is better)): Currently ranked 111 of 365 in D1. Trending down strongly.
- DR_PCT (Defensive Rebound Rate (% of available defensive rebounds secured)): Currently ranked 51 of 365 in D1. Trending down moderately.
Cal Poly
Record: 1-3 | Elo: 1440.0 (ranked 273 of 365) | Efficiency Margin: -1.81 (ranked 259 of 365)
Insufficient games played for meaningful trend analysis (MACD requires 12+ games).
Hawai’i
Record: 4-1 | Elo: 1493.4 (ranked 195 of 365) | Efficiency Margin: +19.66 (ranked 86 of 365)
Offensive Trends:
- FTR (Free Throw Rate (FTM/FGA – getting to the line and converting)): Currently ranked 8 of 365 in D1. Trending up strongly.
- OR_PCT (Offensive Rebound Rate (% of available offensive rebounds grabbed)): Currently ranked 60 of 365 in D1. Trending up strongly.
Defensive Trends:
- TOV_PCT (Forced Turnover Rate (causing opponent turnovers – higher is better)): Currently ranked 154 of 365 in D1. Trending up strongly.
- EFG (eFG% Allowed (lower is better – opponents shooting less efficiently)): Currently ranked 34 of 365 in D1. Trending down strongly.
Long Beach St
Record: 0-3 | Elo: 1384.8 (ranked 330 of 365) | Efficiency Margin: -12.90 (ranked 337 of 365)
Offensive Trends:
- EFG (Effective Field Goal % (adjusts for 3-pointers being worth more)): Currently ranked 335 of 365 in D1. Trending down strongly.
- FTR (Free Throw Rate (FTM/FGA – getting to the line and converting)): Currently ranked 267 of 365 in D1. Trending down strongly.
Defensive Trends:
- DR_PCT (Defensive Rebound Rate (% of available defensive rebounds secured)): Currently ranked 293 of 365 in D1. Trending down moderately.
UC Davis
Record: 2-1 | Elo: 1485.7 (ranked 211 of 365) | Efficiency Margin: +4.68 (ranked 199 of 365)
Offensive Trends:
- FTR (Free Throw Rate (FTM/FGA – getting to the line and converting)): Currently ranked 188 of 365 in D1. Trending down strongly.
- EFG (Effective Field Goal % (adjusts for 3-pointers being worth more)): Currently ranked 152 of 365 in D1. Trending up strongly.
Defensive Trends:
- DR_PCT (Defensive Rebound Rate (% of available defensive rebounds secured)): Currently ranked 303 of 365 in D1. Trending down moderately.
- FTR (FTR Allowed (opponent free throws – lower is better)): Currently ranked 139 of 365 in D1. Trending down strongly.
UC Irvine
Record: 1-1 | Elo: 1637.2 (ranked 36 of 365) | Efficiency Margin: +18.99 (ranked 92 of 365)
Offensive Trends:
- FTR (Free Throw Rate (FTM/FGA – getting to the line and converting)): Currently ranked 40 of 365 in D1. Trending up strongly.
Defensive Trends:
- DR_PCT (Defensive Rebound Rate (% of available defensive rebounds secured)): Currently ranked 306 of 365 in D1. Trending down moderately.
UC Riverside
Record: 1-2 | Elo: 1529.2 (ranked 138 of 365) | Efficiency Margin: +0.43 (ranked 236 of 365)
Offensive Trends:
- FTR (Free Throw Rate (FTM/FGA – getting to the line and converting)): Currently ranked 135 of 365 in D1. Trending up strongly.
- EFG (Effective Field Goal % (adjusts for 3-pointers being worth more)): Currently ranked 51 of 365 in D1. Trending up strongly.
Defensive Trends:
- DR_PCT (Defensive Rebound Rate (% of available defensive rebounds secured)): Currently ranked 95 of 365 in D1. Trending down moderately.
UC San Diego
Record: 3-0 | Elo: 1641.0 (ranked 34 of 365) | Efficiency Margin: +15.50 (ranked 114 of 365)
Offensive Trends:
- FTR (Free Throw Rate (FTM/FGA – getting to the line and converting)): Currently ranked 233 of 365 in D1. Trending down moderately.
- EFG (Effective Field Goal % (adjusts for 3-pointers being worth more)): Currently ranked 56 of 365 in D1. Trending up strongly.
Defensive Trends:
- DR_PCT (Defensive Rebound Rate (% of available defensive rebounds secured)): Currently ranked 127 of 365 in D1. Trending down moderately.
UCSB
Record: 2-0 | Elo: 1541.5 (ranked 122 of 365) | Efficiency Margin: +6.44 (ranked 183 of 365)
Defensive Trends:
- DR_PCT (Defensive Rebound Rate (% of available defensive rebounds secured)): Currently ranked 226 of 365 in D1. Trending down moderately.
- FTR (FTR Allowed (opponent free throws – lower is better)): Currently ranked 207 of 365 in D1. Trending up moderately.
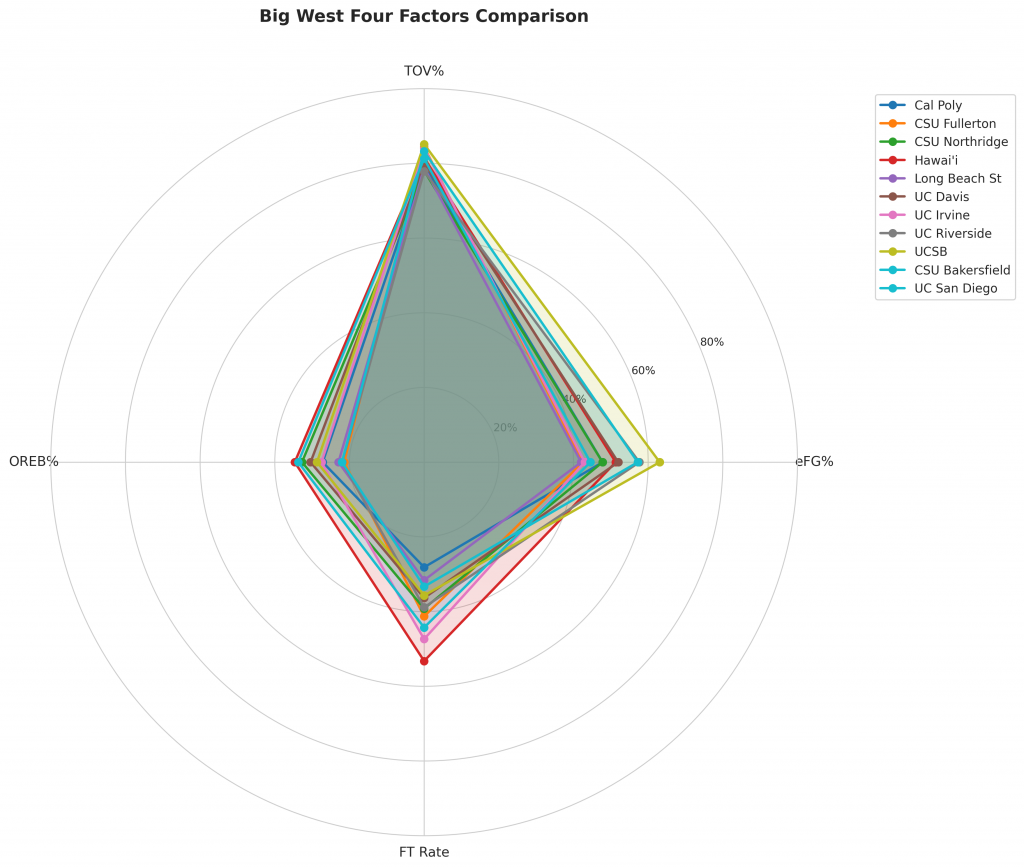
Figure 2: Four Factors comparison across Big West teams. The radar chart shows each team’s offensive efficiency (eFG%), ball security (TOV%), rebounding (OREB%), and free throw generation (FT Rate).
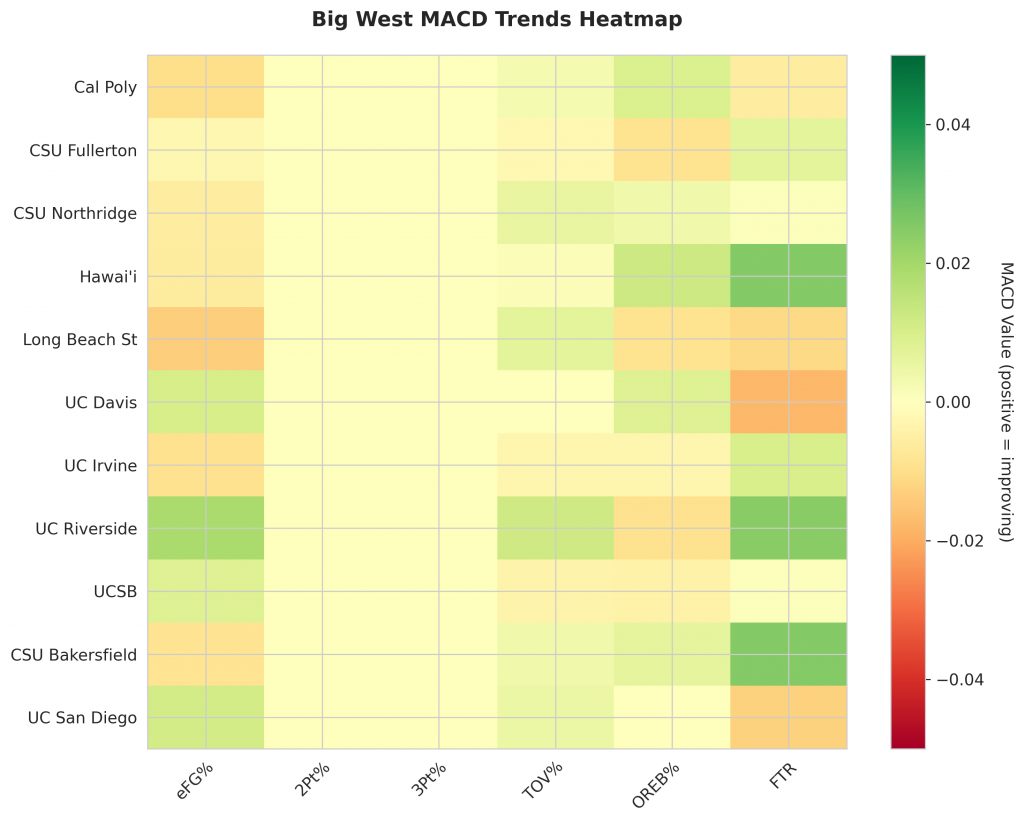
Figure 3: MACD trends heatmap showing which metrics are improving (green) or declining (red) for each team. Stronger colors indicate more pronounced trends.
Looking Ahead
As Big West teams continue their season, the MACD trending indicators will help identify which teams are genuinely improving versus those riding unsustainable momentum. Check back next week for updated analysis.
Metrics Glossary
Four Factors (Dean Oliver’s framework for basketball success):
- eFG% (Effective Field Goal %): Field goal percentage adjusted for 3-pointers being worth more (FGM + 0.5×3PM) / FGA. Higher is better offensively, lower is better defensively.
- TOV% (Turnover Rate): Turnovers per 100 possessions. Lower is better offensively (taking care of the ball), higher is better defensively (forcing turnovers).
- OREB% / DREB% (Offensive/Defensive Rebound Rate): Percentage of available rebounds grabbed. Offensive rebounds create second-chance points; defensive rebounds end opponent possessions.
- FTR (Free Throw Rate): Free throws made per field goal attempt (FTM/FGA). Measures ability to get to the line AND convert. Higher is better offensively, lower is better defensively.
Other Metrics:
- Elo Rating: Chess-style rating system that updates based on game results and opponent strength. Higher Elo indicates stronger team.
- Efficiency Margin: Point differential per 100 possessions (Offensive Efficiency – Defensive Efficiency). Accounts for pace of play.
- MACD (Moving Average Convergence Divergence): Trend indicator comparing 12-game and 26-game exponential moving averages. Positive MACD = improving trend, Negative MACD = declining trend.
Analysis powered by HoopSci’s advanced metrics and MACD trending indicators.