Ivy Update: Week 1
November 16, 2025The Ivy enters Week 1 with teams showing diverse trending patterns. This analysis examines each team’s performance trends using MACD (Moving Average Convergence Divergence) indicators to identify not just where teams stand, but where they’re headed.
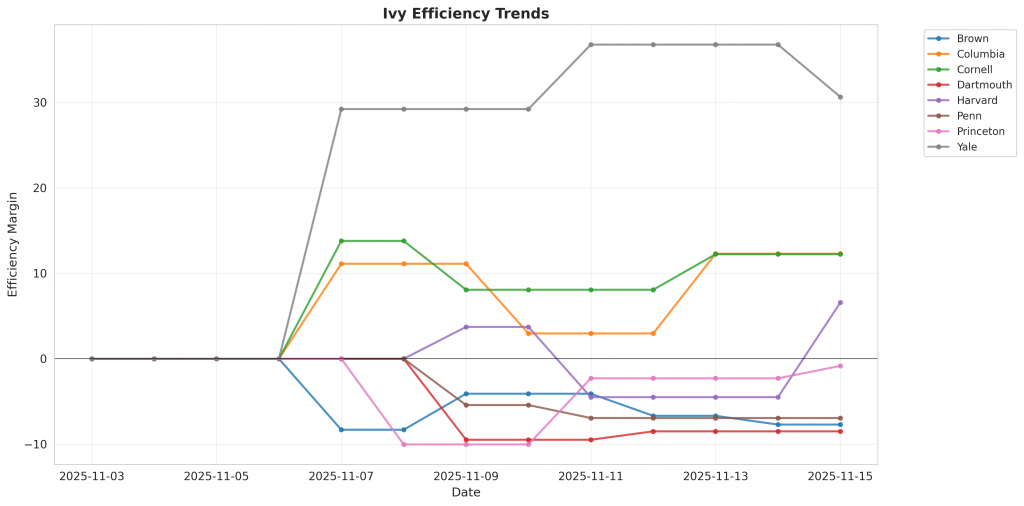
Figure 1: Efficiency margin trends for Ivy teams throughout the season. Teams trending upward show improving performance, while downward trends indicate struggles.
Conference Snapshot
- Week Dates: November 03 – November 09, 2025
- Trending Up (Efficiency): Cornell, Yale
- Trending Down (Efficiency): Brown, Columbia, Dartmouth, Harvard, Penn
Team-by-Team Analysis
Brown
Record: 0-4 | Elo: 1456.7 (ranked 255 of 365) | Efficiency Margin: -7.70 (ranked 310 of 365)
Offensive Trends:
- OR_PCT (Offensive Rebound Rate (% of available offensive rebounds grabbed)): Currently ranked 276 of 365 in D1. Trending down strongly.
- EFG (Effective Field Goal % (adjusts for 3-pointers being worth more)): Currently ranked 199 of 365 in D1. Trending down moderately.
Defensive Trends:
- DR_PCT (Defensive Rebound Rate (% of available defensive rebounds secured)): Currently ranked 322 of 365 in D1. Trending down strongly.
Columbia
Record: 2-1 | Elo: 1435.2 (ranked 276 of 365) | Efficiency Margin: +12.30 (ranked 135 of 365)
Defensive Trends:
- DR_PCT (Defensive Rebound Rate (% of available defensive rebounds secured)): Currently ranked 54 of 365 in D1. Trending up strongly.
Cornell
Record: 1-2 | Elo: 1555.5 (ranked 103 of 365) | Efficiency Margin: +12.25 (ranked 136 of 365)
Defensive Trends:
- FTR (FTR Allowed (opponent free throws – lower is better)): Currently ranked 310 of 365 in D1. Trending up strongly.
- EFG (eFG% Allowed (lower is better – opponents shooting less efficiently)): Currently ranked 296 of 365 in D1. Trending up strongly.
Dartmouth
Record: 0-2 | Elo: 1442.2 (ranked 270 of 365) | Efficiency Margin: -8.49 (ranked 316 of 365)
Defensive Trends:
- FTR (FTR Allowed (opponent free throws – lower is better)): Currently ranked 12 of 365 in D1. Trending down moderately.
Harvard
Record: 2-1 | Elo: 1495.7 (ranked 190 of 365) | Efficiency Margin: +6.60 (ranked 182 of 365)
Offensive Trends:
- OR_PCT (Offensive Rebound Rate (% of available offensive rebounds grabbed)): Currently ranked 345 of 365 in D1. Trending down moderately.
Defensive Trends:
- DR_PCT (Defensive Rebound Rate (% of available defensive rebounds secured)): Currently ranked 102 of 365 in D1. Trending down moderately.
Penn
Record: 0-2 | Elo: 1417.3 (ranked 303 of 365) | Efficiency Margin: -6.93 (ranked 303 of 365)
Offensive Trends:
- OR_PCT (Offensive Rebound Rate (% of available offensive rebounds grabbed)): Currently ranked 323 of 365 in D1. Trending down moderately.
Defensive Trends:
- DR_PCT (Defensive Rebound Rate (% of available defensive rebounds secured)): Currently ranked 282 of 365 in D1. Trending down moderately.
- FTR (FTR Allowed (opponent free throws – lower is better)): Currently ranked 112 of 365 in D1. Trending up moderately.
Princeton
Record: 1-2 | Elo: 1574.5 (ranked 85 of 365) | Efficiency Margin: -0.83 (ranked 248 of 365)
Offensive Trends:
- EFG (Effective Field Goal % (adjusts for 3-pointers being worth more)): Currently ranked 306 of 365 in D1. Trending down strongly.
Defensive Trends:
- FTR (FTR Allowed (opponent free throws – lower is better)): Currently ranked 227 of 365 in D1. Trending up strongly.
Yale
Record: 3-0 | Elo: 1656.1 (ranked 21 of 365) | Efficiency Margin: +30.65 (ranked 32 of 365)
Offensive Trends:
- EFG (Effective Field Goal % (adjusts for 3-pointers being worth more)): Currently ranked 15 of 365 in D1. Trending up strongly.
- OR_PCT (Offensive Rebound Rate (% of available offensive rebounds grabbed)): Currently ranked 36 of 365 in D1. Trending up strongly.
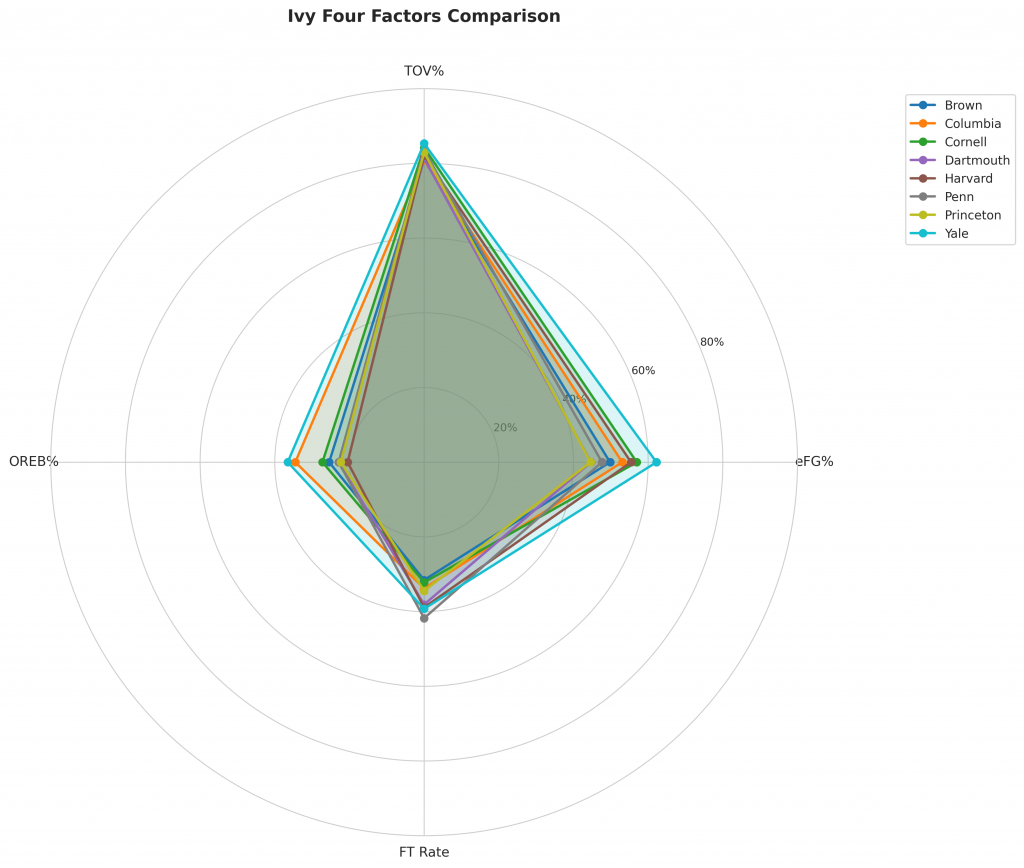
Figure 2: Four Factors comparison across Ivy teams. The radar chart shows each team’s offensive efficiency (eFG%), ball security (TOV%), rebounding (OREB%), and free throw generation (FT Rate).
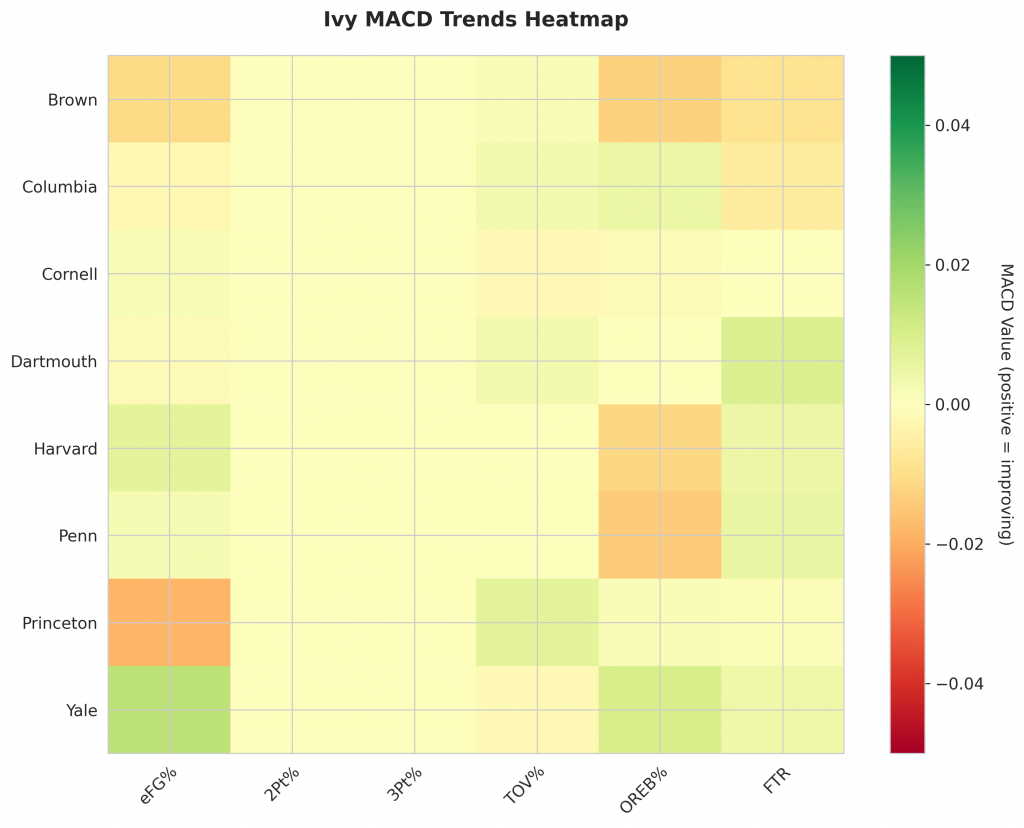
Figure 3: MACD trends heatmap showing which metrics are improving (green) or declining (red) for each team. Stronger colors indicate more pronounced trends.
Looking Ahead
As Ivy teams continue their season, the MACD trending indicators will help identify which teams are genuinely improving versus those riding unsustainable momentum. Check back next week for updated analysis.
Metrics Glossary
Four Factors (Dean Oliver’s framework for basketball success):
- eFG% (Effective Field Goal %): Field goal percentage adjusted for 3-pointers being worth more (FGM + 0.5×3PM) / FGA. Higher is better offensively, lower is better defensively.
- TOV% (Turnover Rate): Turnovers per 100 possessions. Lower is better offensively (taking care of the ball), higher is better defensively (forcing turnovers).
- OREB% / DREB% (Offensive/Defensive Rebound Rate): Percentage of available rebounds grabbed. Offensive rebounds create second-chance points; defensive rebounds end opponent possessions.
- FTR (Free Throw Rate): Free throws made per field goal attempt (FTM/FGA). Measures ability to get to the line AND convert. Higher is better offensively, lower is better defensively.
Other Metrics:
- Elo Rating: Chess-style rating system that updates based on game results and opponent strength. Higher Elo indicates stronger team.
- Efficiency Margin: Point differential per 100 possessions (Offensive Efficiency – Defensive Efficiency). Accounts for pace of play.
- MACD (Moving Average Convergence Divergence): Trend indicator comparing 12-game and 26-game exponential moving averages. Positive MACD = improving trend, Negative MACD = declining trend.
Analysis powered by HoopSci’s advanced metrics and MACD trending indicators.