Mid-American Update: Week 1
November 16, 2025The Mid-American enters Week 1 with teams showing diverse trending patterns. This analysis examines each team’s performance trends using MACD (Moving Average Convergence Divergence) indicators to identify not just where teams stand, but where they’re headed.
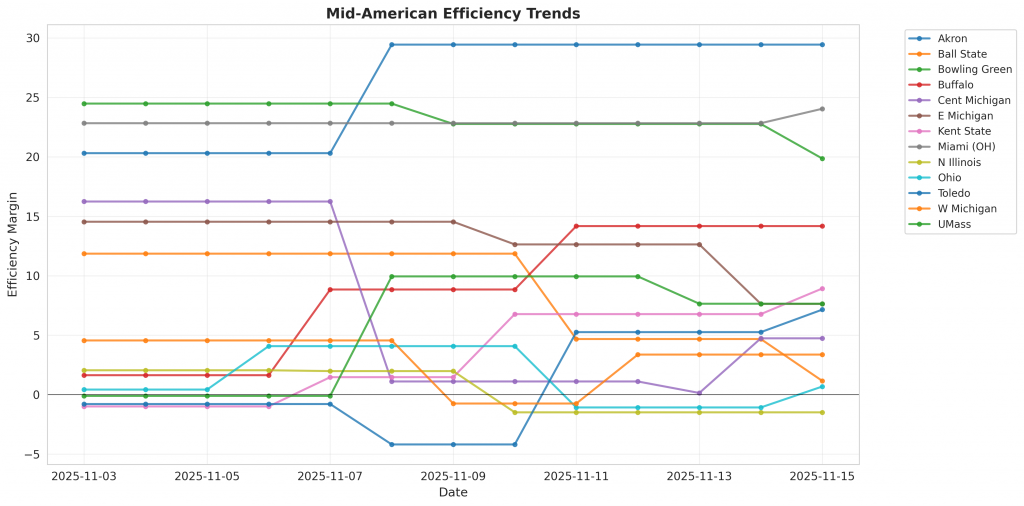
Figure 1: Efficiency margin trends for Mid-American teams throughout the season. Teams trending upward show improving performance, while downward trends indicate struggles.
Conference Snapshot
- Week Dates: November 03 – November 09, 2025
- Trending Up (Efficiency): Akron, Buffalo, Kent State, Miami (OH), N Illinois
- Trending Down (Efficiency): Ball State, Bowling Green, Cent Michigan, E Michigan, Ohio
Team-by-Team Analysis
Akron
Record: 2-0 | Elo: 1641.8 (ranked 33 of 365) | Efficiency Margin: +29.45 (ranked 36 of 365)
Insufficient games played for meaningful trend analysis (MACD requires 12+ games).
Ball State
Record: 1-2 | Elo: 1438.8 (ranked 274 of 365) | Efficiency Margin: +1.15 (ranked 229 of 365)
Defensive Trends:
- FTR (FTR Allowed (opponent free throws – lower is better)): Currently ranked 6 of 365 in D1. Trending down strongly.
Bowling Green
Record: 3-1 | Elo: 1459.7 (ranked 249 of 365) | Efficiency Margin: +19.86 (ranked 85 of 365)
Offensive Trends:
- EFG (Effective Field Goal % (adjusts for 3-pointers being worth more)): Currently ranked 127 of 365 in D1. Trending up moderately.
Defensive Trends:
- EFG (eFG% Allowed (lower is better – opponents shooting less efficiently)): Currently ranked 190 of 365 in D1. Trending down moderately.
- TOV_PCT (Forced Turnover Rate (causing opponent turnovers – higher is better)): Currently ranked 5 of 365 in D1. Trending up strongly.
Buffalo
Record: 3-0 | Elo: 1399.9 (ranked 317 of 365) | Efficiency Margin: +14.18 (ranked 122 of 365)
Offensive Trends:
- FTR (Free Throw Rate (FTM/FGA – getting to the line and converting)): Currently ranked 1 of 365 in D1. Trending up strongly.
- OR_PCT (Offensive Rebound Rate (% of available offensive rebounds grabbed)): Currently ranked 175 of 365 in D1. Trending up strongly.
Defensive Trends:
- FTR (FTR Allowed (opponent free throws – lower is better)): Currently ranked 228 of 365 in D1. Trending up strongly.
- DR_PCT (Defensive Rebound Rate (% of available defensive rebounds secured)): Currently ranked 97 of 365 in D1. Trending up strongly.
Cent Michigan
Record: 2-2 | Elo: 1457.9 (ranked 253 of 365) | Efficiency Margin: +4.74 (ranked 197 of 365)
Offensive Trends:
- OR_PCT (Offensive Rebound Rate (% of available offensive rebounds grabbed)): Currently ranked 79 of 365 in D1. Trending up strongly.
E Michigan
Record: 1-2 | Elo: 1449.1 (ranked 260 of 365) | Efficiency Margin: +7.64 (ranked 171 of 365)
Offensive Trends:
- OR_PCT (Offensive Rebound Rate (% of available offensive rebounds grabbed)): Currently ranked 63 of 365 in D1. Trending up strongly.
Defensive Trends:
- FTR (FTR Allowed (opponent free throws – lower is better)): Currently ranked 68 of 365 in D1. Trending down strongly.
- EFG (eFG% Allowed (lower is better – opponents shooting less efficiently)): Currently ranked 178 of 365 in D1. Trending down moderately.
Kent State
Record: 3-1 | Elo: 1588.9 (ranked 67 of 365) | Efficiency Margin: +8.93 (ranked 157 of 365)
Offensive Trends:
- FTR (Free Throw Rate (FTM/FGA – getting to the line and converting)): Currently ranked 24 of 365 in D1. Trending up strongly.
- EFG (Effective Field Goal % (adjusts for 3-pointers being worth more)): Currently ranked 31 of 365 in D1. Trending up strongly.
Defensive Trends:
- EFG (eFG% Allowed (lower is better – opponents shooting less efficiently)): Currently ranked 307 of 365 in D1. Trending up strongly.
Miami (OH)
Record: 2-0 | Elo: 1560.4 (ranked 98 of 365) | Efficiency Margin: +24.05 (ranked 64 of 365)
Insufficient games played for meaningful trend analysis (MACD requires 12+ games).
N Illinois
Record: 1-2 | Elo: 1349.6 (ranked 349 of 365) | Efficiency Margin: -1.49 (ranked 256 of 365)
Offensive Trends:
- OR_PCT (Offensive Rebound Rate (% of available offensive rebounds grabbed)): Currently ranked 199 of 365 in D1. Trending up strongly.
- EFG (Effective Field Goal % (adjusts for 3-pointers being worth more)): Currently ranked 118 of 365 in D1. Trending up strongly.
Defensive Trends:
- FTR (FTR Allowed (opponent free throws – lower is better)): Currently ranked 293 of 365 in D1. Trending up moderately.
Ohio
Record: 1-3 | Elo: 1495.9 (ranked 189 of 365) | Efficiency Margin: +0.69 (ranked 231 of 365)
Defensive Trends:
- DR_PCT (Defensive Rebound Rate (% of available defensive rebounds secured)): Currently ranked 328 of 365 in D1. Trending down strongly.
Toledo
Record: 2-2 | Elo: 1527.1 (ranked 145 of 365) | Efficiency Margin: +7.15 (ranked 174 of 365)
Offensive Trends:
- FTR (Free Throw Rate (FTM/FGA – getting to the line and converting)): Currently ranked 230 of 365 in D1. Trending down moderately.
Defensive Trends:
- EFG (eFG% Allowed (lower is better – opponents shooting less efficiently)): Currently ranked 329 of 365 in D1. Trending up moderately.
UMass
Record: 2-1 | Elo: 1515.1 (ranked 163 of 365) | Efficiency Margin: +7.65 (ranked 170 of 365)
Offensive Trends:
- FTR (Free Throw Rate (FTM/FGA – getting to the line and converting)): Currently ranked 56 of 365 in D1. Trending up strongly.
W Michigan
Record: 2-1 | Elo: 1434.9 (ranked 278 of 365) | Efficiency Margin: +3.37 (ranked 208 of 365)
Offensive Trends:
- FTR (Free Throw Rate (FTM/FGA – getting to the line and converting)): Currently ranked 107 of 365 in D1. Trending up strongly.
- OR_PCT (Offensive Rebound Rate (% of available offensive rebounds grabbed)): Currently ranked 208 of 365 in D1. Trending down strongly.
Defensive Trends:
- FTR (FTR Allowed (opponent free throws – lower is better)): Currently ranked 263 of 365 in D1. Trending up strongly.
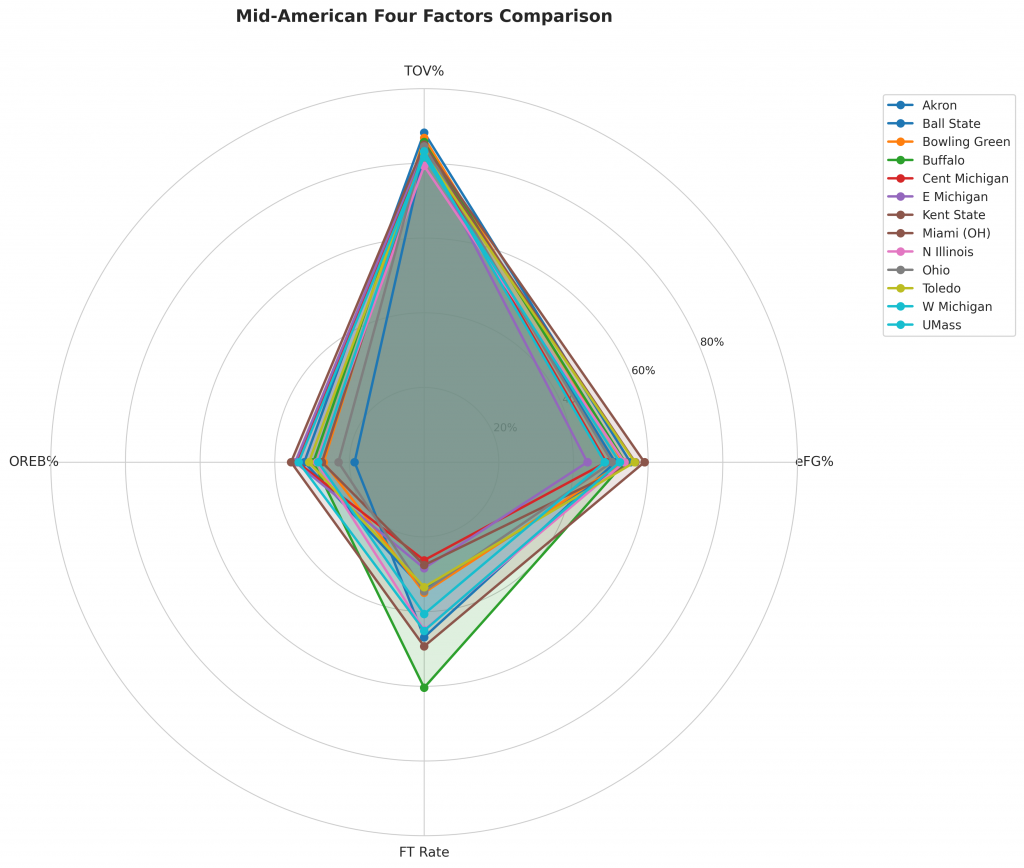
Figure 2: Four Factors comparison across Mid-American teams. The radar chart shows each team’s offensive efficiency (eFG%), ball security (TOV%), rebounding (OREB%), and free throw generation (FT Rate).
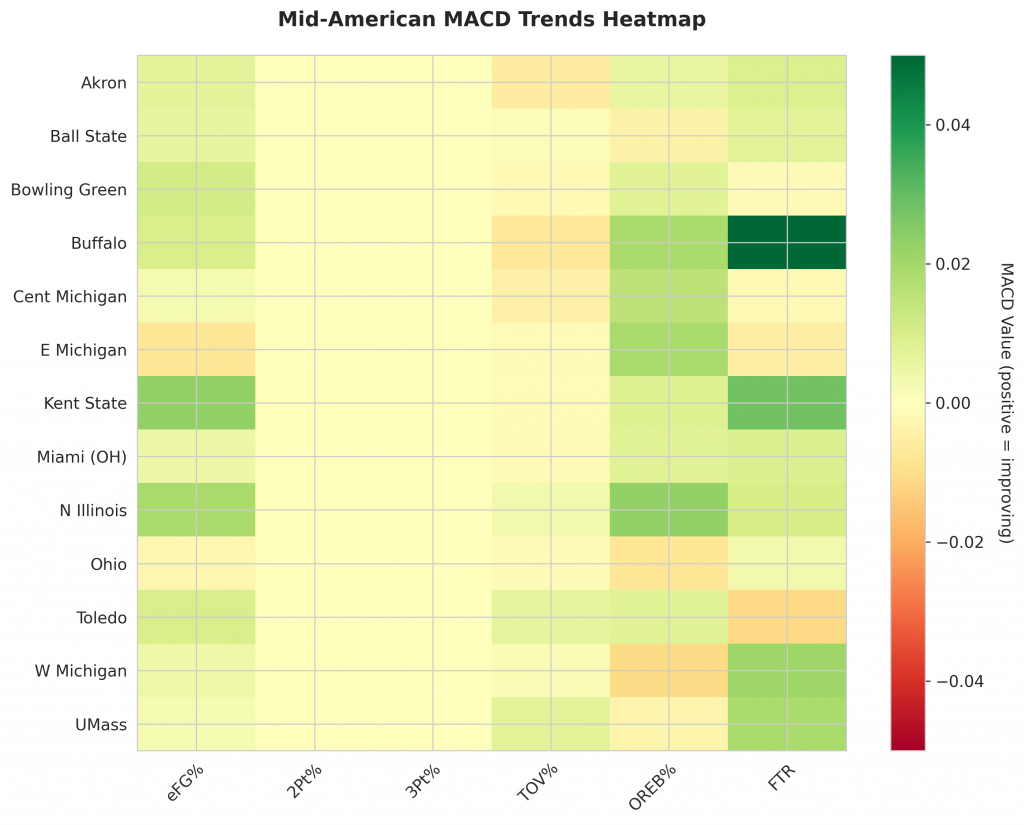
Figure 3: MACD trends heatmap showing which metrics are improving (green) or declining (red) for each team. Stronger colors indicate more pronounced trends.
Looking Ahead
As Mid-American teams continue their season, the MACD trending indicators will help identify which teams are genuinely improving versus those riding unsustainable momentum. Check back next week for updated analysis.
Metrics Glossary
Four Factors (Dean Oliver’s framework for basketball success):
- eFG% (Effective Field Goal %): Field goal percentage adjusted for 3-pointers being worth more (FGM + 0.5×3PM) / FGA. Higher is better offensively, lower is better defensively.
- TOV% (Turnover Rate): Turnovers per 100 possessions. Lower is better offensively (taking care of the ball), higher is better defensively (forcing turnovers).
- OREB% / DREB% (Offensive/Defensive Rebound Rate): Percentage of available rebounds grabbed. Offensive rebounds create second-chance points; defensive rebounds end opponent possessions.
- FTR (Free Throw Rate): Free throws made per field goal attempt (FTM/FGA). Measures ability to get to the line AND convert. Higher is better offensively, lower is better defensively.
Other Metrics:
- Elo Rating: Chess-style rating system that updates based on game results and opponent strength. Higher Elo indicates stronger team.
- Efficiency Margin: Point differential per 100 possessions (Offensive Efficiency – Defensive Efficiency). Accounts for pace of play.
- MACD (Moving Average Convergence Divergence): Trend indicator comparing 12-game and 26-game exponential moving averages. Positive MACD = improving trend, Negative MACD = declining trend.
Analysis powered by HoopSci’s advanced metrics and MACD trending indicators.