Missouri Valley Update: Week 1
November 16, 2025The Missouri Valley enters Week 1 with teams showing diverse trending patterns. This analysis examines each team’s performance trends using MACD (Moving Average Convergence Divergence) indicators to identify not just where teams stand, but where they’re headed.
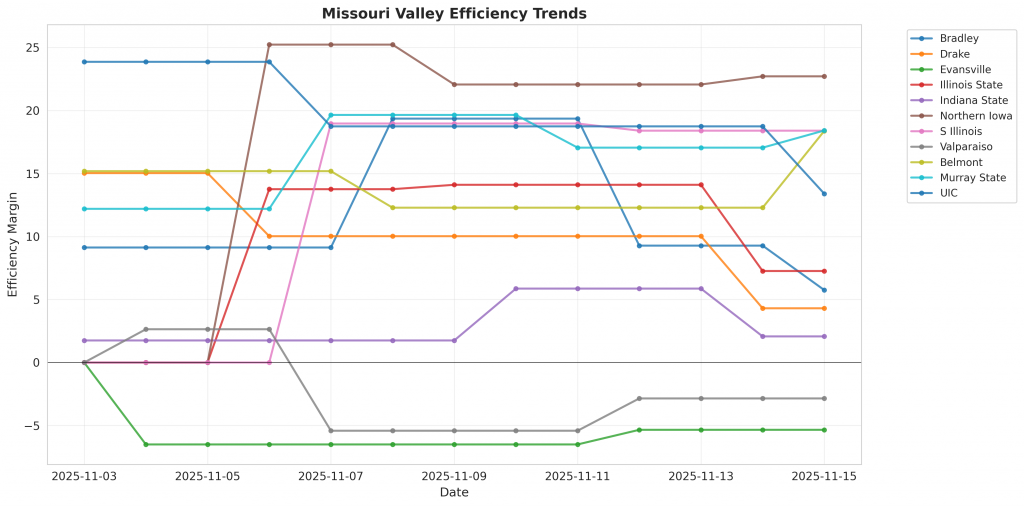
Figure 1: Efficiency margin trends for Missouri Valley teams throughout the season. Teams trending upward show improving performance, while downward trends indicate struggles.
Conference Snapshot
- Week Dates: November 03 – November 09, 2025
- Trending Up (Efficiency): S Illinois
- Trending Down (Efficiency): Bradley, Drake, Evansville, Illinois State, Indiana State
Team-by-Team Analysis
Belmont
Record: 3-0 | Elo: 1597.0 (ranked 61 of 365) | Efficiency Margin: +18.39 (ranked 95 of 365)
Offensive Trends:
- FTR (Free Throw Rate (FTM/FGA – getting to the line and converting)): Currently ranked 119 of 365 in D1. Trending up strongly.
Defensive Trends:
- DR_PCT (Defensive Rebound Rate (% of available defensive rebounds secured)): Currently ranked 215 of 365 in D1. Trending down moderately.
Bradley
Record: 1-3 | Elo: 1595.1 (ranked 64 of 365) | Efficiency Margin: +5.75 (ranked 188 of 365)
Offensive Trends:
- EFG (Effective Field Goal % (adjusts for 3-pointers being worth more)): Currently ranked 282 of 365 in D1. Trending down strongly.
- OR_PCT (Offensive Rebound Rate (% of available offensive rebounds grabbed)): Currently ranked 348 of 365 in D1. Trending down strongly.
Defensive Trends:
- DR_PCT (Defensive Rebound Rate (% of available defensive rebounds secured)): Currently ranked 268 of 365 in D1. Trending down strongly.
Drake
Record: 1-2 | Elo: 1663.6 (ranked 18 of 365) | Efficiency Margin: +4.31 (ranked 200 of 365)
Offensive Trends:
- EFG (Effective Field Goal % (adjusts for 3-pointers being worth more)): Currently ranked 277 of 365 in D1. Trending down strongly.
Defensive Trends:
- FTR (FTR Allowed (opponent free throws – lower is better)): Currently ranked 8 of 365 in D1. Trending down strongly.
- DR_PCT (Defensive Rebound Rate (% of available defensive rebounds secured)): Currently ranked 252 of 365 in D1. Trending down strongly.
Evansville
Record: 0-2 | Elo: 1423.8 (ranked 293 of 365) | Efficiency Margin: -5.34 (ranked 293 of 365)
Offensive Trends:
- OR_PCT (Offensive Rebound Rate (% of available offensive rebounds grabbed)): Currently ranked 236 of 365 in D1. Trending up strongly.
Illinois State
Record: 1-2 | Elo: 1522.5 (ranked 151 of 365) | Efficiency Margin: +7.26 (ranked 173 of 365)
Defensive Trends:
- FTR (FTR Allowed (opponent free throws – lower is better)): Currently ranked 311 of 365 in D1. Trending up strongly.
Indiana State
Record: 1-2 | Elo: 1522.1 (ranked 152 of 365) | Efficiency Margin: +2.07 (ranked 223 of 365)
Offensive Trends:
- EFG (Effective Field Goal % (adjusts for 3-pointers being worth more)): Currently ranked 269 of 365 in D1. Trending down strongly.
Defensive Trends:
- DR_PCT (Defensive Rebound Rate (% of available defensive rebounds secured)): Currently ranked 345 of 365 in D1. Trending down strongly.
Murray State
Record: 3-1 | Elo: 1512.8 (ranked 166 of 365) | Efficiency Margin: +18.42 (ranked 93 of 365)
Defensive Trends:
- DR_PCT (Defensive Rebound Rate (% of available defensive rebounds secured)): Currently ranked 264 of 365 in D1. Trending down strongly.
- EFG (eFG% Allowed (lower is better – opponents shooting less efficiently)): Currently ranked 89 of 365 in D1. Trending down strongly.
Northern Iowa
Record: 3-0 | Elo: 1577.8 (ranked 81 of 365) | Efficiency Margin: +22.72 (ranked 69 of 365)
Defensive Trends:
- EFG (eFG% Allowed (lower is better – opponents shooting less efficiently)): Currently ranked 45 of 365 in D1. Trending down strongly.
- TOV_PCT (Forced Turnover Rate (causing opponent turnovers – higher is better)): Currently ranked 29 of 365 in D1. Trending up strongly.
S Illinois
Record: 2-1 | Elo: 1495.9 (ranked 187 of 365) | Efficiency Margin: +18.40 (ranked 94 of 365)
Offensive Trends:
- EFG (Effective Field Goal % (adjusts for 3-pointers being worth more)): Currently ranked 41 of 365 in D1. Trending up strongly.
- OR_PCT (Offensive Rebound Rate (% of available offensive rebounds grabbed)): Currently ranked 160 of 365 in D1. Trending up moderately.
Defensive Trends:
- EFG (eFG% Allowed (lower is better – opponents shooting less efficiently)): Currently ranked 43 of 365 in D1. Trending down strongly.
UIC
Record: 2-1 | Elo: 1489.2 (ranked 202 of 365) | Efficiency Margin: +13.40 (ranked 128 of 365)
Offensive Trends:
- FTR (Free Throw Rate (FTM/FGA – getting to the line and converting)): Currently ranked 29 of 365 in D1. Trending up strongly.
Defensive Trends:
- DR_PCT (Defensive Rebound Rate (% of available defensive rebounds secured)): Currently ranked 332 of 365 in D1. Trending down strongly.
- EFG (eFG% Allowed (lower is better – opponents shooting less efficiently)): Currently ranked 82 of 365 in D1. Trending down strongly.
Valparaiso
Record: 2-1 | Elo: 1447.9 (ranked 261 of 365) | Efficiency Margin: -2.85 (ranked 272 of 365)
Offensive Trends:
- FTR (Free Throw Rate (FTM/FGA – getting to the line and converting)): Currently ranked 77 of 365 in D1. Trending up strongly.
Defensive Trends:
- FTR (FTR Allowed (opponent free throws – lower is better)): Currently ranked 266 of 365 in D1. Trending up moderately.
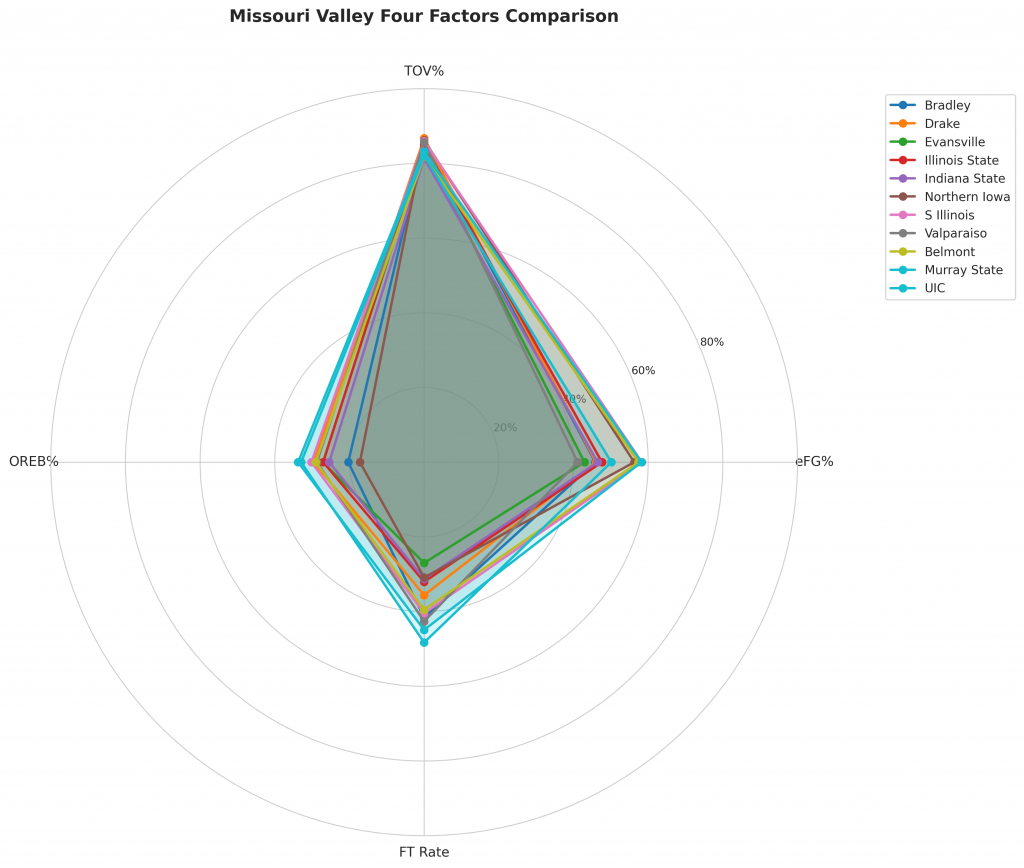
Figure 2: Four Factors comparison across Missouri Valley teams. The radar chart shows each team’s offensive efficiency (eFG%), ball security (TOV%), rebounding (OREB%), and free throw generation (FT Rate).
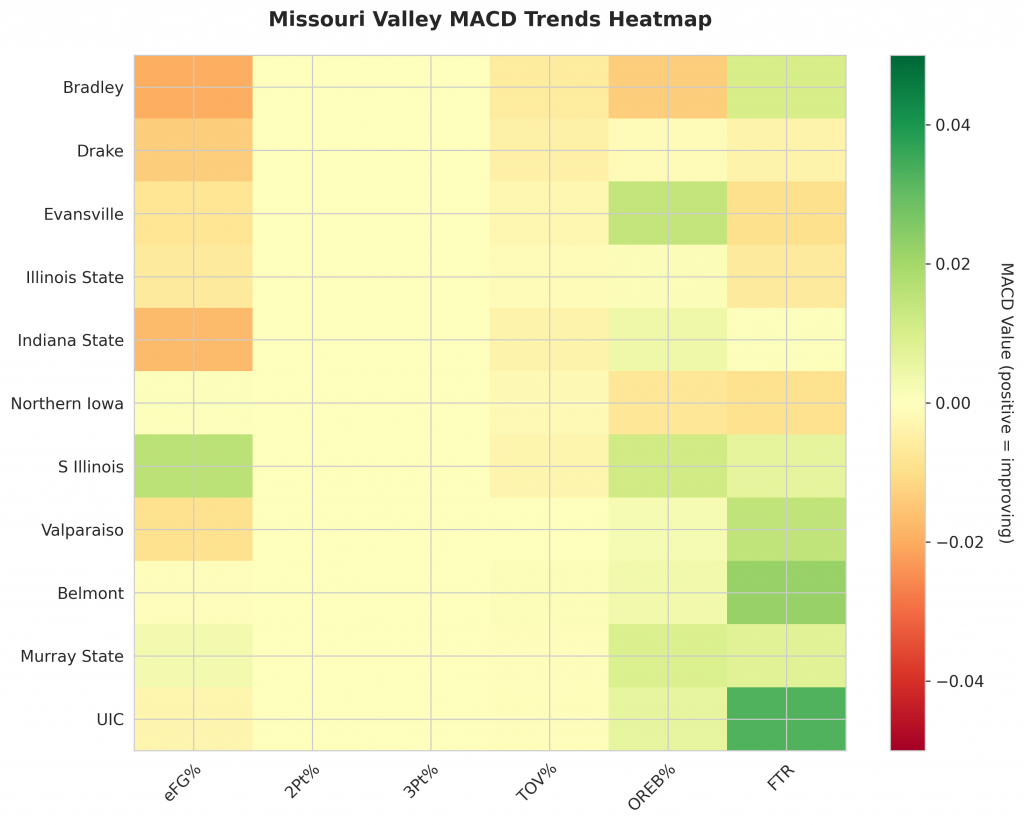
Figure 3: MACD trends heatmap showing which metrics are improving (green) or declining (red) for each team. Stronger colors indicate more pronounced trends.
Looking Ahead
As Missouri Valley teams continue their season, the MACD trending indicators will help identify which teams are genuinely improving versus those riding unsustainable momentum. Check back next week for updated analysis.
Metrics Glossary
Four Factors (Dean Oliver’s framework for basketball success):
- eFG% (Effective Field Goal %): Field goal percentage adjusted for 3-pointers being worth more (FGM + 0.5×3PM) / FGA. Higher is better offensively, lower is better defensively.
- TOV% (Turnover Rate): Turnovers per 100 possessions. Lower is better offensively (taking care of the ball), higher is better defensively (forcing turnovers).
- OREB% / DREB% (Offensive/Defensive Rebound Rate): Percentage of available rebounds grabbed. Offensive rebounds create second-chance points; defensive rebounds end opponent possessions.
- FTR (Free Throw Rate): Free throws made per field goal attempt (FTM/FGA). Measures ability to get to the line AND convert. Higher is better offensively, lower is better defensively.
Other Metrics:
- Elo Rating: Chess-style rating system that updates based on game results and opponent strength. Higher Elo indicates stronger team.
- Efficiency Margin: Point differential per 100 possessions (Offensive Efficiency – Defensive Efficiency). Accounts for pace of play.
- MACD (Moving Average Convergence Divergence): Trend indicator comparing 12-game and 26-game exponential moving averages. Positive MACD = improving trend, Negative MACD = declining trend.
Analysis powered by HoopSci’s advanced metrics and MACD trending indicators.