Mountain West Update: Week 1
November 16, 2025The Mountain West enters Week 1 with teams showing diverse trending patterns. This analysis examines each team’s performance trends using MACD (Moving Average Convergence Divergence) indicators to identify not just where teams stand, but where they’re headed.
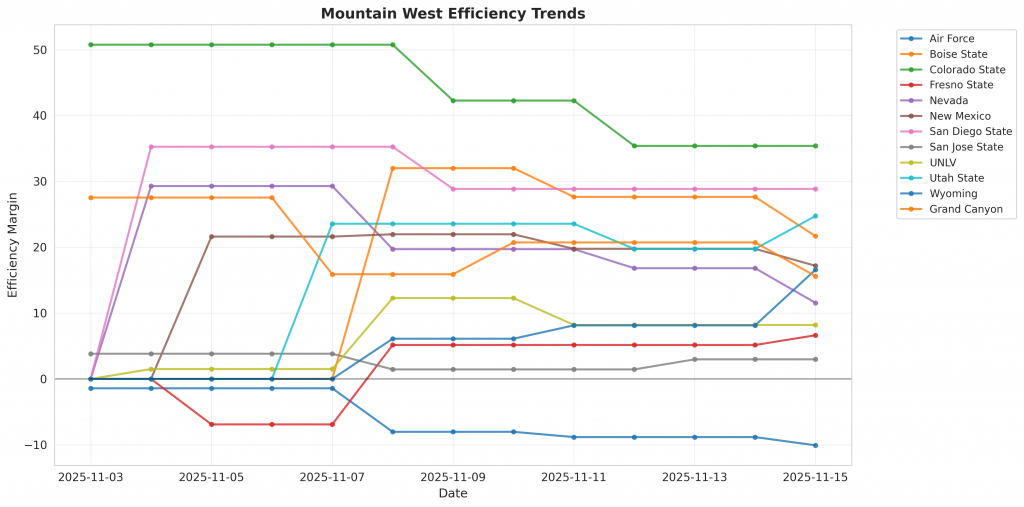
Figure 1: Efficiency margin trends for Mountain West teams throughout the season. Teams trending upward show improving performance, while downward trends indicate struggles.
Conference Snapshot
- Week Dates: November 03 – November 09, 2025
- Trending Up (Efficiency): Colorado State
- Trending Down (Efficiency): Air Force, Boise State, Fresno State, Nevada, New Mexico
Team-by-Team Analysis
Air Force
Record: 0-4 | Elo: 1324.2 (ranked 359 of 365) | Efficiency Margin: -10.08 (ranked 327 of 365)
Offensive Trends:
- OR_PCT (Offensive Rebound Rate (% of available offensive rebounds grabbed)): Currently ranked 180 of 365 in D1. Trending up strongly.
- TOV_PCT (Turnover Rate (turnovers per 100 possessions – lower is better)): Currently ranked 352 of 365 in D1. Trending up strongly.
Defensive Trends:
- FTR (FTR Allowed (opponent free throws – lower is better)): Currently ranked 269 of 365 in D1. Trending up strongly.
Boise State
Record: 3-0 | Elo: 1646.1 (ranked 31 of 365) | Efficiency Margin: +21.68 (ranked 75 of 365)
Offensive Trends:
- FTR (Free Throw Rate (FTM/FGA – getting to the line and converting)): Currently ranked 35 of 365 in D1. Trending up strongly.
Defensive Trends:
- DR_PCT (Defensive Rebound Rate (% of available defensive rebounds secured)): Currently ranked 7 of 365 in D1. Trending down moderately.
Colorado State
Record: 3-0 | Elo: 1659.5 (ranked 20 of 365) | Efficiency Margin: +35.39 (ranked 22 of 365)
Offensive Trends:
- FTR (Free Throw Rate (FTM/FGA – getting to the line and converting)): Currently ranked 33 of 365 in D1. Trending up strongly.
- EFG (Effective Field Goal % (adjusts for 3-pointers being worth more)): Currently ranked 3 of 365 in D1. Trending up strongly.
Fresno State
Record: 2-2 | Elo: 1393.2 (ranked 323 of 365) | Efficiency Margin: +6.64 (ranked 181 of 365)
Offensive Trends:
- FTR (Free Throw Rate (FTM/FGA – getting to the line and converting)): Currently ranked 86 of 365 in D1. Trending up strongly.
- OR_PCT (Offensive Rebound Rate (% of available offensive rebounds grabbed)): Currently ranked 208 of 365 in D1. Trending up strongly.
Defensive Trends:
- FTR (FTR Allowed (opponent free throws – lower is better)): Currently ranked 178 of 365 in D1. Trending up strongly.
- DR_PCT (Defensive Rebound Rate (% of available defensive rebounds secured)): Currently ranked 138 of 365 in D1. Trending down moderately.
Grand Canyon
Record: 2-2 | Elo: 1619.6 (ranked 46 of 365) | Efficiency Margin: +15.60 (ranked 113 of 365)
Offensive Trends:
- FTR (Free Throw Rate (FTM/FGA – getting to the line and converting)): Currently ranked 201 of 365 in D1. Trending down strongly.
- EFG (Effective Field Goal % (adjusts for 3-pointers being worth more)): Currently ranked 162 of 365 in D1. Trending up moderately.
Nevada
Record: 3-1 | Elo: 1561.9 (ranked 94 of 365) | Efficiency Margin: +11.55 (ranked 140 of 365)
Offensive Trends:
- OR_PCT (Offensive Rebound Rate (% of available offensive rebounds grabbed)): Currently ranked 32 of 365 in D1. Trending up strongly.
- EFG (Effective Field Goal % (adjusts for 3-pointers being worth more)): Currently ranked 261 of 365 in D1. Trending down strongly.
New Mexico
Record: 3-1 | Elo: 1646.3 (ranked 30 of 365) | Efficiency Margin: +17.18 (ranked 100 of 365)
Defensive Trends:
- EFG (eFG% Allowed (lower is better – opponents shooting less efficiently)): Currently ranked 73 of 365 in D1. Trending down moderately.
San Diego State
Record: 2-0 | Elo: 1639.0 (ranked 35 of 365) | Efficiency Margin: +28.86 (ranked 41 of 365)
Defensive Trends:
- FTR (FTR Allowed (opponent free throws – lower is better)): Currently ranked 29 of 365 in D1. Trending down strongly.
- TOV_PCT (Forced Turnover Rate (causing opponent turnovers – higher is better)): Currently ranked 3 of 365 in D1. Trending up strongly.
San Jose State
Record: 0-3 | Elo: 1445.4 (ranked 266 of 365) | Efficiency Margin: +2.98 (ranked 215 of 365)
Offensive Trends:
- OR_PCT (Offensive Rebound Rate (% of available offensive rebounds grabbed)): Currently ranked 207 of 365 in D1. Trending up strongly.
Defensive Trends:
- EFG (eFG% Allowed (lower is better – opponents shooting less efficiently)): Currently ranked 339 of 365 in D1. Trending up strongly.
- DR_PCT (Defensive Rebound Rate (% of available defensive rebounds secured)): Currently ranked 303 of 365 in D1. Trending down strongly.
UNLV
Record: 1-2 | Elo: 1541.7 (ranked 121 of 365) | Efficiency Margin: +8.20 (ranked 164 of 365)
Offensive Trends:
- FTR (Free Throw Rate (FTM/FGA – getting to the line and converting)): Currently ranked 9 of 365 in D1. Trending up strongly.
Defensive Trends:
- FTR (FTR Allowed (opponent free throws – lower is better)): Currently ranked 331 of 365 in D1. Trending up strongly.
- DR_PCT (Defensive Rebound Rate (% of available defensive rebounds secured)): Currently ranked 77 of 365 in D1. Trending up strongly.
Utah State
Record: 3-0 | Elo: 1668.0 (ranked 17 of 365) | Efficiency Margin: +24.75 (ranked 58 of 365)
Offensive Trends:
- FTR (Free Throw Rate (FTM/FGA – getting to the line and converting)): Currently ranked 14 of 365 in D1. Trending up strongly.
Defensive Trends:
- DR_PCT (Defensive Rebound Rate (% of available defensive rebounds secured)): Currently ranked 158 of 365 in D1. Trending down moderately.
- FTR (FTR Allowed (opponent free throws – lower is better)): Currently ranked 279 of 365 in D1. Trending up strongly.
Wyoming
Record: 3-0 | Elo: 1467.6 (ranked 233 of 365) | Efficiency Margin: +16.60 (ranked 104 of 365)
Defensive Trends:
- FTR (FTR Allowed (opponent free throws – lower is better)): Currently ranked 361 of 365 in D1. Trending up strongly.
- DR_PCT (Defensive Rebound Rate (% of available defensive rebounds secured)): Currently ranked 24 of 365 in D1. Trending down moderately.
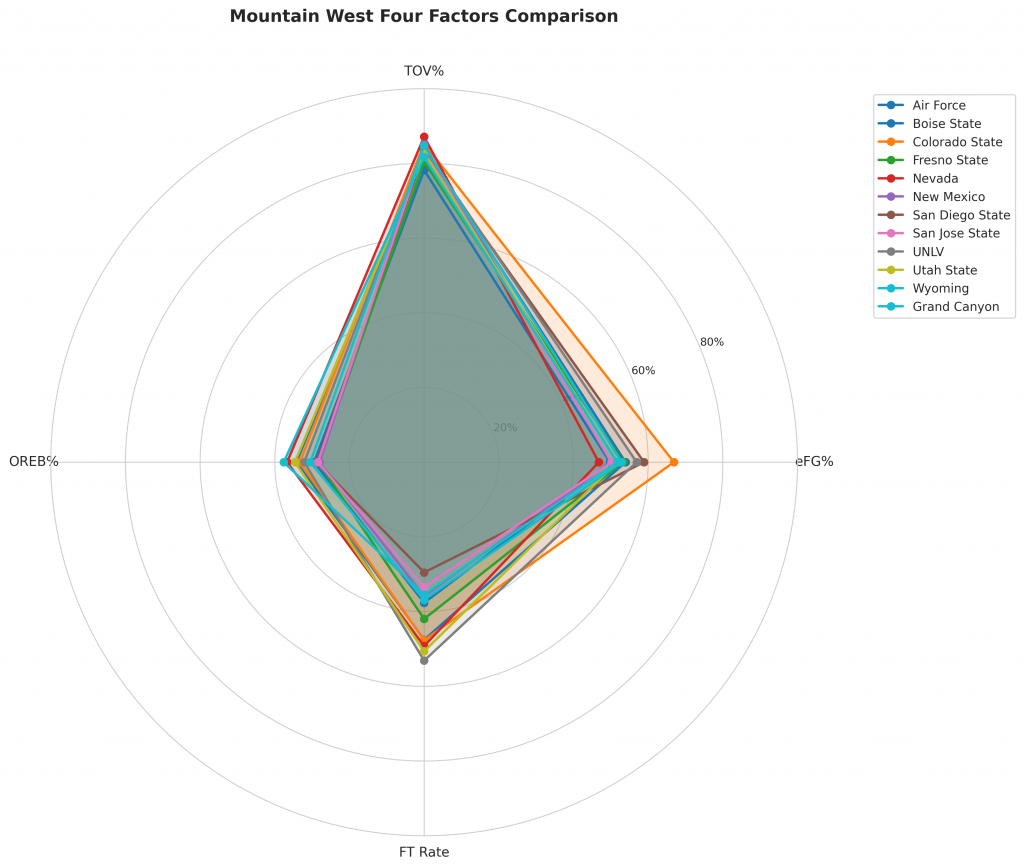
Figure 2: Four Factors comparison across Mountain West teams. The radar chart shows each team’s offensive efficiency (eFG%), ball security (TOV%), rebounding (OREB%), and free throw generation (FT Rate).

Figure 3: MACD trends heatmap showing which metrics are improving (green) or declining (red) for each team. Stronger colors indicate more pronounced trends.
Looking Ahead
As Mountain West teams continue their season, the MACD trending indicators will help identify which teams are genuinely improving versus those riding unsustainable momentum. Check back next week for updated analysis.
Metrics Glossary
Four Factors (Dean Oliver’s framework for basketball success):
- eFG% (Effective Field Goal %): Field goal percentage adjusted for 3-pointers being worth more (FGM + 0.5×3PM) / FGA. Higher is better offensively, lower is better defensively.
- TOV% (Turnover Rate): Turnovers per 100 possessions. Lower is better offensively (taking care of the ball), higher is better defensively (forcing turnovers).
- OREB% / DREB% (Offensive/Defensive Rebound Rate): Percentage of available rebounds grabbed. Offensive rebounds create second-chance points; defensive rebounds end opponent possessions.
- FTR (Free Throw Rate): Free throws made per field goal attempt (FTM/FGA). Measures ability to get to the line AND convert. Higher is better offensively, lower is better defensively.
Other Metrics:
- Elo Rating: Chess-style rating system that updates based on game results and opponent strength. Higher Elo indicates stronger team.
- Efficiency Margin: Point differential per 100 possessions (Offensive Efficiency – Defensive Efficiency). Accounts for pace of play.
- MACD (Moving Average Convergence Divergence): Trend indicator comparing 12-game and 26-game exponential moving averages. Positive MACD = improving trend, Negative MACD = declining trend.
Analysis powered by HoopSci’s advanced metrics and MACD trending indicators.