Ohio Valley Update: Week 1
November 16, 2025The Ohio Valley enters Week 1 with teams showing diverse trending patterns. This analysis examines each team’s performance trends using MACD (Moving Average Convergence Divergence) indicators to identify not just where teams stand, but where they’re headed.
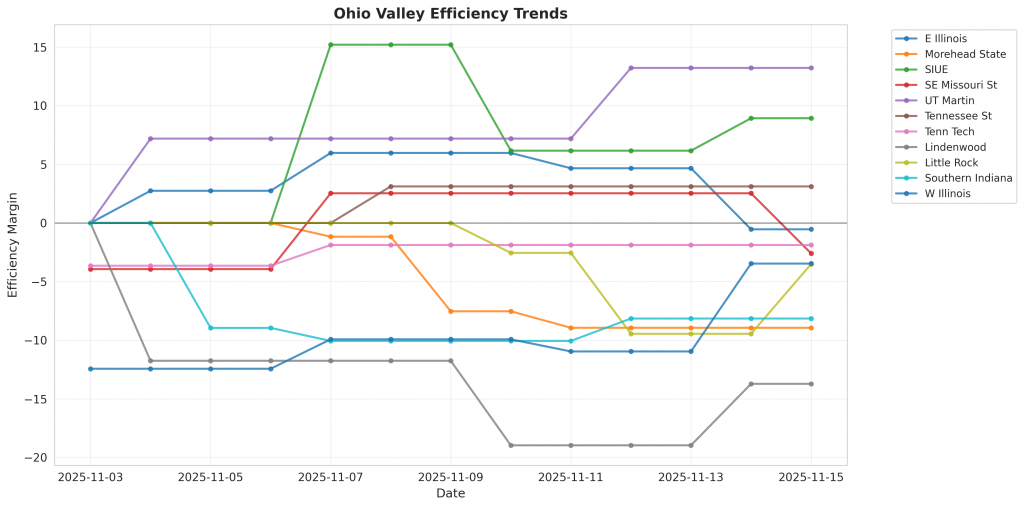
Figure 1: Efficiency margin trends for Ohio Valley teams throughout the season. Teams trending upward show improving performance, while downward trends indicate struggles.
Conference Snapshot
- Week Dates: November 03 – November 09, 2025
- Trending Up (Efficiency): SE Missouri St, Tennessee St
- Trending Down (Efficiency): E Illinois, Morehead State, SIUE, UT Martin, Tenn Tech
Team-by-Team Analysis
E Illinois
Record: 1-3 | Elo: 1400.4 (ranked 315 of 365) | Efficiency Margin: -0.54 (ranked 246 of 365)
Offensive Trends:
- FTR (Free Throw Rate (FTM/FGA – getting to the line and converting)): Currently ranked 72 of 365 in D1. Trending up strongly.
Defensive Trends:
- EFG (eFG% Allowed (lower is better – opponents shooting less efficiently)): Currently ranked 149 of 365 in D1. Trending down moderately.
Lindenwood
Record: 2-2 | Elo: 1421.2 (ranked 295 of 365) | Efficiency Margin: -13.72 (ranked 339 of 365)
Offensive Trends:
- FTR (Free Throw Rate (FTM/FGA – getting to the line and converting)): Currently ranked 68 of 365 in D1. Trending up strongly.
Defensive Trends:
- DR_PCT (Defensive Rebound Rate (% of available defensive rebounds secured)): Currently ranked 319 of 365 in D1. Trending down strongly.
Little Rock
Record: 2-2 | Elo: 1487.7 (ranked 204 of 365) | Efficiency Margin: -3.51 (ranked 281 of 365)
Offensive Trends:
- FTR (Free Throw Rate (FTM/FGA – getting to the line and converting)): Currently ranked 338 of 365 in D1. Trending down strongly.
Defensive Trends:
- EFG (eFG% Allowed (lower is better – opponents shooting less efficiently)): Currently ranked 334 of 365 in D1. Trending up strongly.
- FTR (FTR Allowed (opponent free throws – lower is better)): Currently ranked 188 of 365 in D1. Trending down moderately.
Morehead State
Record: 1-3 | Elo: 1460.7 (ranked 245 of 365) | Efficiency Margin: -8.94 (ranked 320 of 365)
Offensive Trends:
- FTR (Free Throw Rate (FTM/FGA – getting to the line and converting)): Currently ranked 322 of 365 in D1. Trending down strongly.
Defensive Trends:
- DR_PCT (Defensive Rebound Rate (% of available defensive rebounds secured)): Currently ranked 342 of 365 in D1. Trending down strongly.
- EFG (eFG% Allowed (lower is better – opponents shooting less efficiently)): Currently ranked 289 of 365 in D1. Trending up strongly.
SE Missouri St
Record: 0-3 | Elo: 1463.9 (ranked 238 of 365) | Efficiency Margin: -2.59 (ranked 271 of 365)
Offensive Trends:
- FTR (Free Throw Rate (FTM/FGA – getting to the line and converting)): Currently ranked 284 of 365 in D1. Trending up moderately.
Defensive Trends:
- EFG (eFG% Allowed (lower is better – opponents shooting less efficiently)): Currently ranked 359 of 365 in D1. Trending up strongly.
SIUE
Record: 2-1 | Elo: 1522.7 (ranked 150 of 365) | Efficiency Margin: +8.93 (ranked 156 of 365)
Offensive Trends:
- FTR (Free Throw Rate (FTM/FGA – getting to the line and converting)): Currently ranked 309 of 365 in D1. Trending up moderately.
Defensive Trends:
- DR_PCT (Defensive Rebound Rate (% of available defensive rebounds secured)): Currently ranked 161 of 365 in D1. Trending down moderately.
- EFG (eFG% Allowed (lower is better – opponents shooting less efficiently)): Currently ranked 18 of 365 in D1. Trending down strongly.
Southern Indiana
Record: 0-3 | Elo: 1344.9 (ranked 350 of 365) | Efficiency Margin: -8.15 (ranked 313 of 365)
Offensive Trends:
- EFG (Effective Field Goal % (adjusts for 3-pointers being worth more)): Currently ranked 359 of 365 in D1. Trending down strongly.
- FTR (Free Throw Rate (FTM/FGA – getting to the line and converting)): Currently ranked 231 of 365 in D1. Trending down moderately.
Defensive Trends:
- FTR (FTR Allowed (opponent free throws – lower is better)): Currently ranked 335 of 365 in D1. Trending down moderately.
Tenn Tech
Record: 0-2 | Elo: 1406.3 (ranked 310 of 365) | Efficiency Margin: -1.88 (ranked 261 of 365)
Defensive Trends:
- FTR (FTR Allowed (opponent free throws – lower is better)): Currently ranked 251 of 365 in D1. Trending up strongly.
Tennessee St
Record: 0-1 | Elo: 1465.9 (ranked 236 of 365) | Efficiency Margin: +3.12 (ranked 212 of 365)
Defensive Trends:
- DR_PCT (Defensive Rebound Rate (% of available defensive rebounds secured)): Currently ranked 78 of 365 in D1. Trending down moderately.
UT Martin
Record: 2-0 | Elo: 1474.2 (ranked 223 of 365) | Efficiency Margin: +13.22 (ranked 129 of 365)
Offensive Trends:
- FTR (Free Throw Rate (FTM/FGA – getting to the line and converting)): Currently ranked 12 of 365 in D1. Trending up strongly.
- EFG (Effective Field Goal % (adjusts for 3-pointers being worth more)): Currently ranked 19 of 365 in D1. Trending up strongly.
Defensive Trends:
- FTR (FTR Allowed (opponent free throws – lower is better)): Currently ranked 364 of 365 in D1. Trending up strongly.
- TOV_PCT (Forced Turnover Rate (causing opponent turnovers – higher is better)): Currently ranked 25 of 365 in D1. Trending up strongly.
W Illinois
Record: 0-4 | Elo: 1402.3 (ranked 313 of 365) | Efficiency Margin: -3.46 (ranked 279 of 365)
Offensive Trends:
- FTR (Free Throw Rate (FTM/FGA – getting to the line and converting)): Currently ranked 205 of 365 in D1. Trending up strongly.
Defensive Trends:
- FTR (FTR Allowed (opponent free throws – lower is better)): Currently ranked 232 of 365 in D1. Trending up strongly.
- DR_PCT (Defensive Rebound Rate (% of available defensive rebounds secured)): Currently ranked 297 of 365 in D1. Trending down strongly.
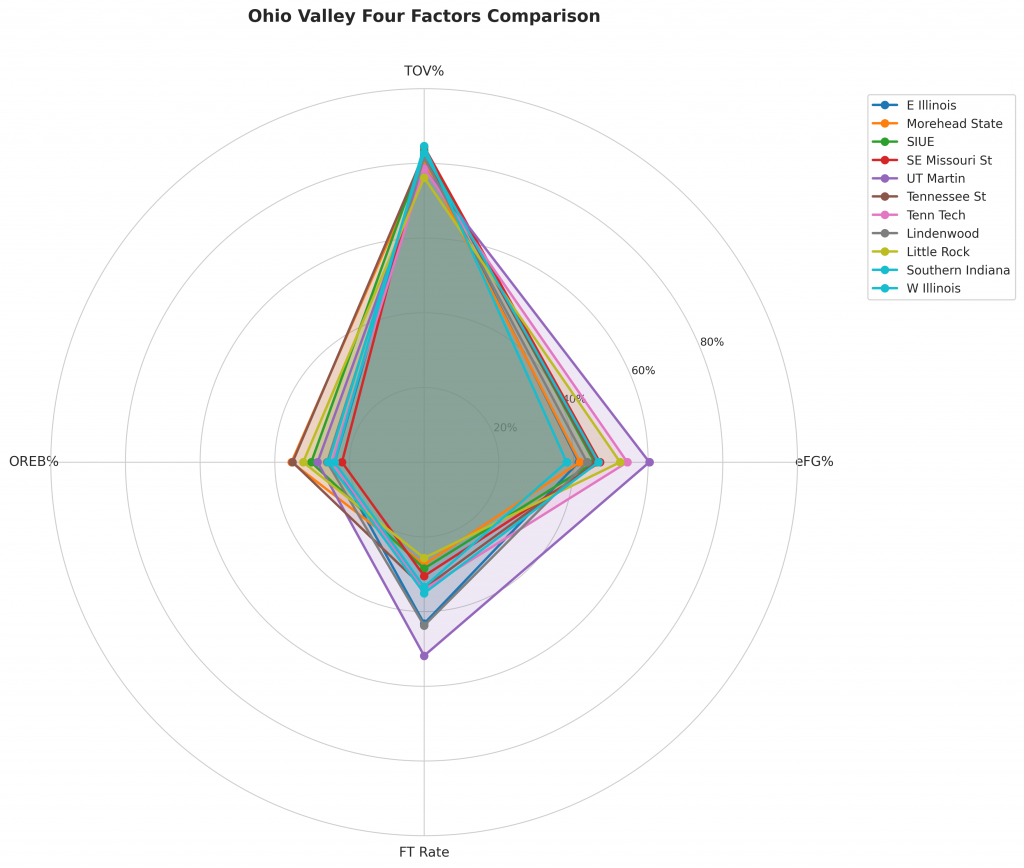
Figure 2: Four Factors comparison across Ohio Valley teams. The radar chart shows each team’s offensive efficiency (eFG%), ball security (TOV%), rebounding (OREB%), and free throw generation (FT Rate).
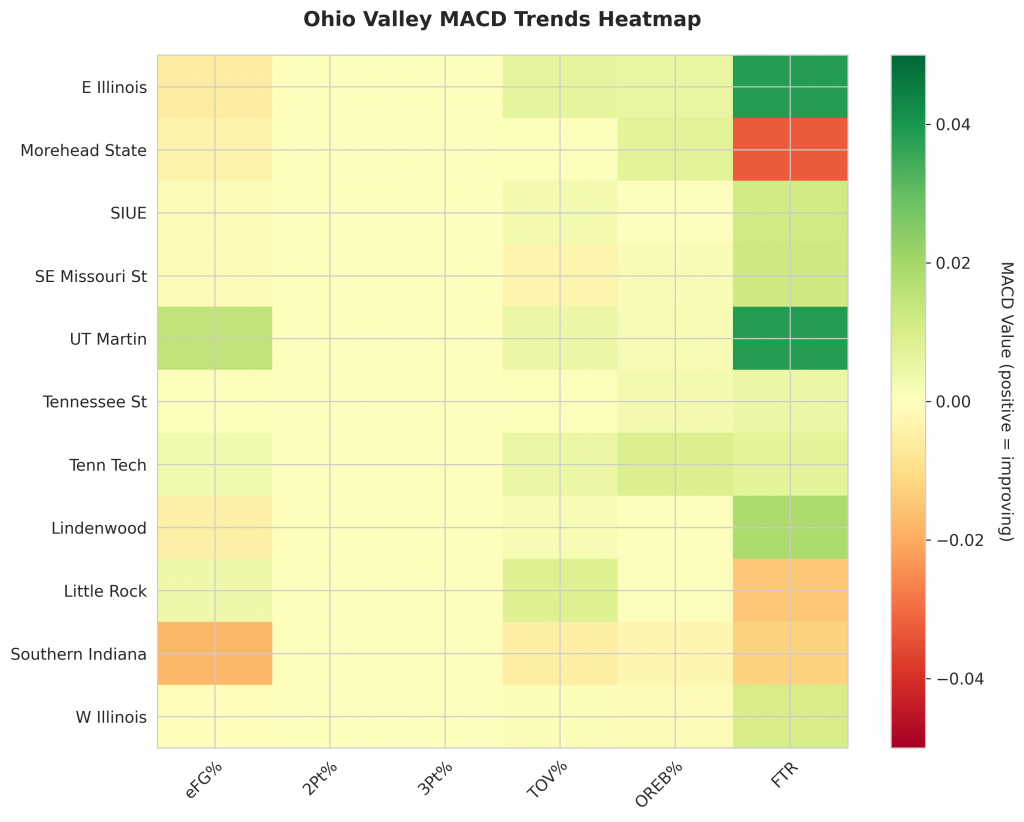
Figure 3: MACD trends heatmap showing which metrics are improving (green) or declining (red) for each team. Stronger colors indicate more pronounced trends.
Looking Ahead
As Ohio Valley teams continue their season, the MACD trending indicators will help identify which teams are genuinely improving versus those riding unsustainable momentum. Check back next week for updated analysis.
Metrics Glossary
Four Factors (Dean Oliver’s framework for basketball success):
- eFG% (Effective Field Goal %): Field goal percentage adjusted for 3-pointers being worth more (FGM + 0.5×3PM) / FGA. Higher is better offensively, lower is better defensively.
- TOV% (Turnover Rate): Turnovers per 100 possessions. Lower is better offensively (taking care of the ball), higher is better defensively (forcing turnovers).
- OREB% / DREB% (Offensive/Defensive Rebound Rate): Percentage of available rebounds grabbed. Offensive rebounds create second-chance points; defensive rebounds end opponent possessions.
- FTR (Free Throw Rate): Free throws made per field goal attempt (FTM/FGA). Measures ability to get to the line AND convert. Higher is better offensively, lower is better defensively.
Other Metrics:
- Elo Rating: Chess-style rating system that updates based on game results and opponent strength. Higher Elo indicates stronger team.
- Efficiency Margin: Point differential per 100 possessions (Offensive Efficiency – Defensive Efficiency). Accounts for pace of play.
- MACD (Moving Average Convergence Divergence): Trend indicator comparing 12-game and 26-game exponential moving averages. Positive MACD = improving trend, Negative MACD = declining trend.
Analysis powered by HoopSci’s advanced metrics and MACD trending indicators.