Patriot League Update: Week 1
November 16, 2025The Patriot League enters Week 1 with teams showing diverse trending patterns. This analysis examines each team’s performance trends using MACD (Moving Average Convergence Divergence) indicators to identify not just where teams stand, but where they’re headed.
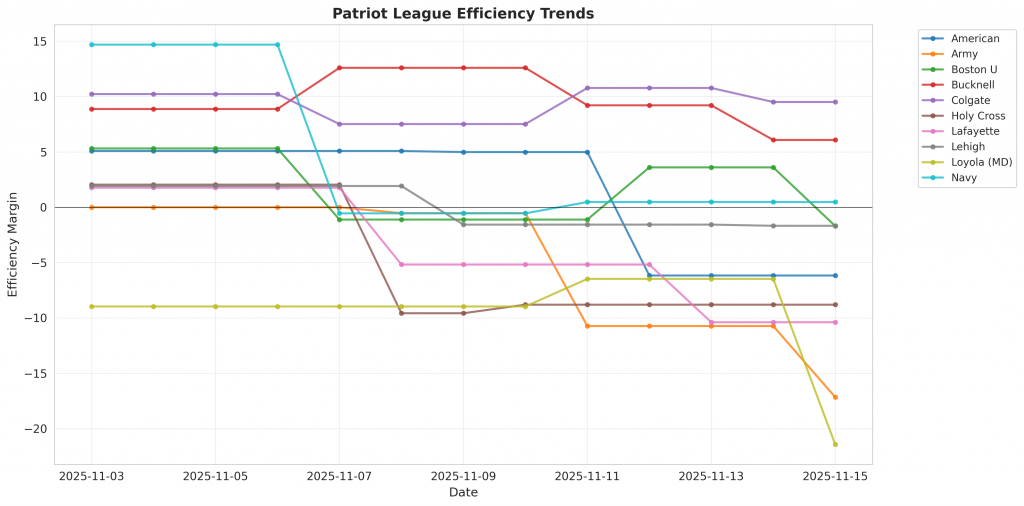
Figure 1: Efficiency margin trends for Patriot League teams throughout the season. Teams trending upward show improving performance, while downward trends indicate struggles.
Conference Snapshot
- Week Dates: November 03 – November 09, 2025
- Trending Up (Efficiency): Boston U, Bucknell, Colgate, Lafayette, Loyola (MD)
- Trending Down (Efficiency): American, Army, Holy Cross, Lehigh, Navy
Team-by-Team Analysis
American
Record: 1-2 | Elo: 1503.4 (ranked 178 of 365) | Efficiency Margin: -6.17 (ranked 297 of 365)
Defensive Trends:
- FTR (FTR Allowed (opponent free throws – lower is better)): Currently ranked 330 of 365 in D1. Trending up strongly.
Army
Record: 0-3 | Elo: 1418.7 (ranked 300 of 365) | Efficiency Margin: -17.16 (ranked 351 of 365)
Offensive Trends:
- FTR (Free Throw Rate (FTM/FGA – getting to the line and converting)): Currently ranked 361 of 365 in D1. Trending down strongly.
Defensive Trends:
- DR_PCT (Defensive Rebound Rate (% of available defensive rebounds secured)): Currently ranked 231 of 365 in D1. Trending down moderately.
- FTR (FTR Allowed (opponent free throws – lower is better)): Currently ranked 242 of 365 in D1. Trending up strongly.
Boston U
Record: 2-2 | Elo: 1468.4 (ranked 230 of 365) | Efficiency Margin: -1.70 (ranked 258 of 365)
Insufficient games played for meaningful trend analysis (MACD requires 12+ games).
Bucknell
Record: 2-2 | Elo: 1491.6 (ranked 197 of 365) | Efficiency Margin: +6.08 (ranked 185 of 365)
Defensive Trends:
- FTR (FTR Allowed (opponent free throws – lower is better)): Currently ranked 306 of 365 in D1. Trending up strongly.
Colgate
Record: 1-3 | Elo: 1487.3 (ranked 207 of 365) | Efficiency Margin: +9.51 (ranked 153 of 365)
Defensive Trends:
- FTR (FTR Allowed (opponent free throws – lower is better)): Currently ranked 209 of 365 in D1. Trending up strongly.
- DR_PCT (Defensive Rebound Rate (% of available defensive rebounds secured)): Currently ranked 334 of 365 in D1. Trending down strongly.
Holy Cross
Record: 0-3 | Elo: 1380.3 (ranked 332 of 365) | Efficiency Margin: -8.80 (ranked 319 of 365)
Defensive Trends:
- DR_PCT (Defensive Rebound Rate (% of available defensive rebounds secured)): Currently ranked 22 of 365 in D1. Trending up strongly.
Lafayette
Record: 1-3 | Elo: 1392.2 (ranked 324 of 365) | Efficiency Margin: -10.39 (ranked 330 of 365)
Defensive Trends:
- DR_PCT (Defensive Rebound Rate (% of available defensive rebounds secured)): Currently ranked 340 of 365 in D1. Trending down strongly.
Lehigh
Record: 1-3 | Elo: 1409.7 (ranked 308 of 365) | Efficiency Margin: -1.68 (ranked 257 of 365)
Defensive Trends:
- FTR (FTR Allowed (opponent free throws – lower is better)): Currently ranked 255 of 365 in D1. Trending up strongly.
Loyola (MD)
Record: 2-2 | Elo: 1380.9 (ranked 331 of 365) | Efficiency Margin: -21.43 (ranked 360 of 365)
Offensive Trends:
- FTR (Free Throw Rate (FTM/FGA – getting to the line and converting)): Currently ranked 151 of 365 in D1. Trending up strongly.
- EFG (Effective Field Goal % (adjusts for 3-pointers being worth more)): Currently ranked 292 of 365 in D1. Trending down strongly.
Navy
Record: 1-2 | Elo: 1460.9 (ranked 243 of 365) | Efficiency Margin: +0.47 (ranked 235 of 365)
Offensive Trends:
- FTR (Free Throw Rate (FTM/FGA – getting to the line and converting)): Currently ranked 113 of 365 in D1. Trending up strongly.
- EFG (Effective Field Goal % (adjusts for 3-pointers being worth more)): Currently ranked 160 of 365 in D1. Trending up strongly.
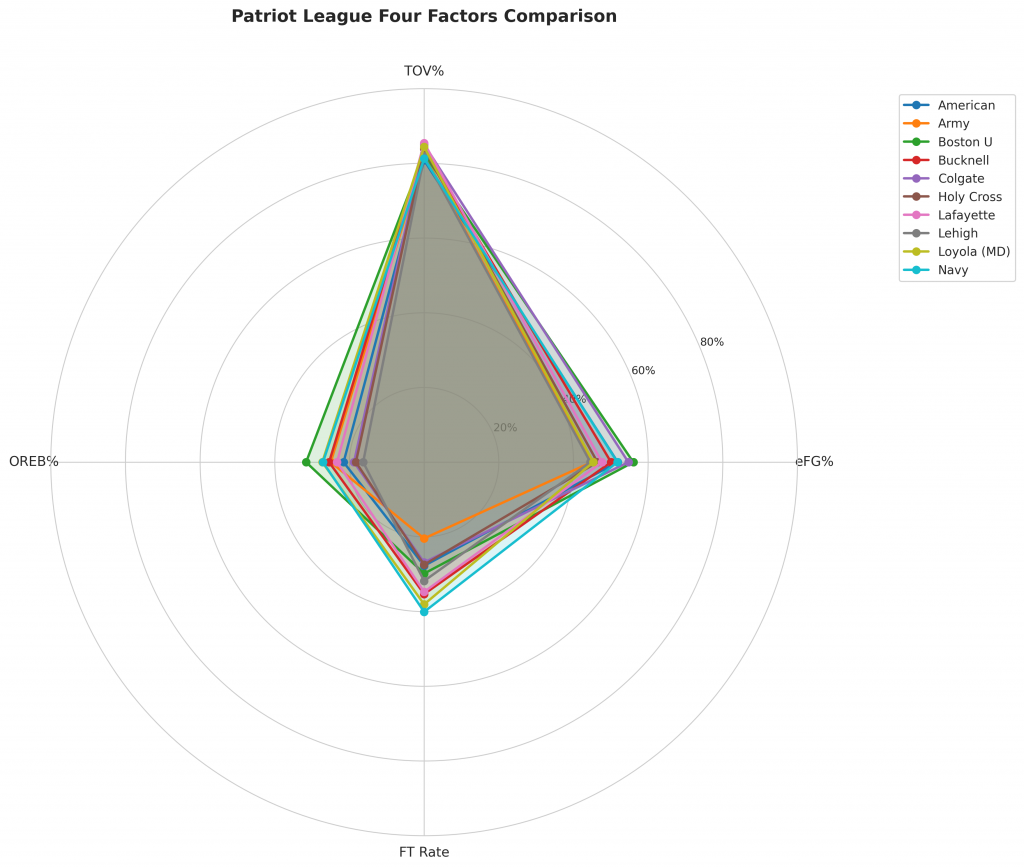
Figure 2: Four Factors comparison across Patriot League teams. The radar chart shows each team’s offensive efficiency (eFG%), ball security (TOV%), rebounding (OREB%), and free throw generation (FT Rate).
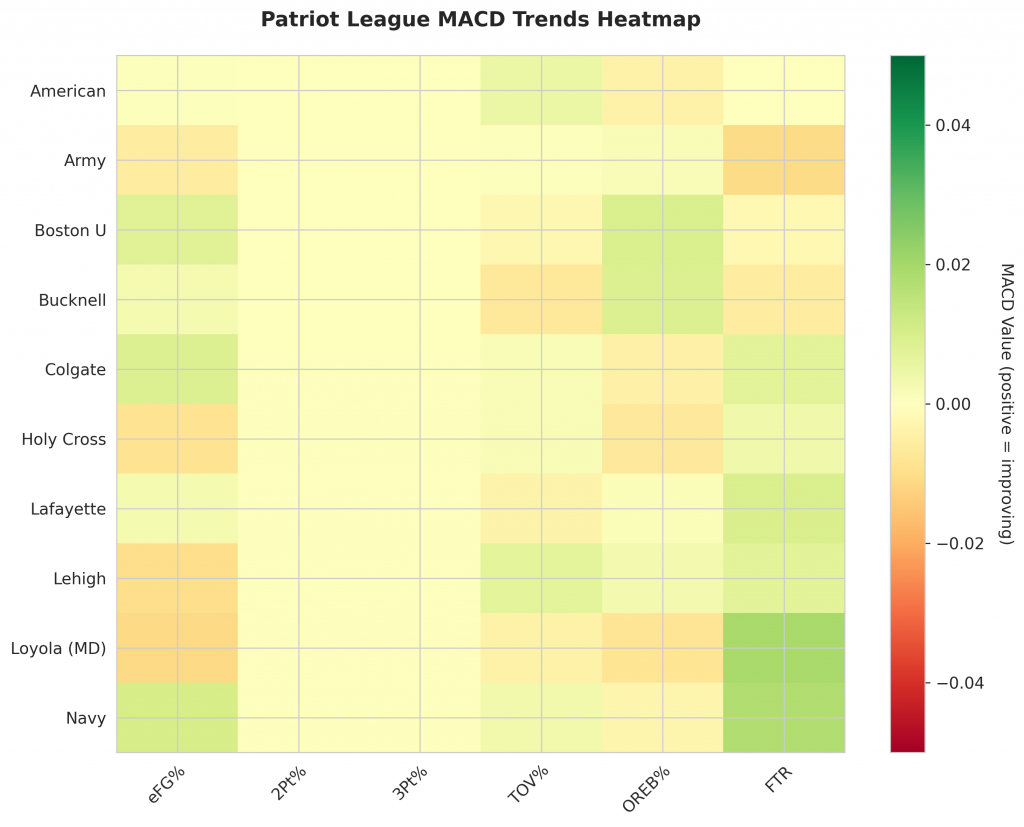
Figure 3: MACD trends heatmap showing which metrics are improving (green) or declining (red) for each team. Stronger colors indicate more pronounced trends.
Looking Ahead
As Patriot League teams continue their season, the MACD trending indicators will help identify which teams are genuinely improving versus those riding unsustainable momentum. Check back next week for updated analysis.
Metrics Glossary
Four Factors (Dean Oliver’s framework for basketball success):
- eFG% (Effective Field Goal %): Field goal percentage adjusted for 3-pointers being worth more (FGM + 0.5×3PM) / FGA. Higher is better offensively, lower is better defensively.
- TOV% (Turnover Rate): Turnovers per 100 possessions. Lower is better offensively (taking care of the ball), higher is better defensively (forcing turnovers).
- OREB% / DREB% (Offensive/Defensive Rebound Rate): Percentage of available rebounds grabbed. Offensive rebounds create second-chance points; defensive rebounds end opponent possessions.
- FTR (Free Throw Rate): Free throws made per field goal attempt (FTM/FGA). Measures ability to get to the line AND convert. Higher is better offensively, lower is better defensively.
Other Metrics:
- Elo Rating: Chess-style rating system that updates based on game results and opponent strength. Higher Elo indicates stronger team.
- Efficiency Margin: Point differential per 100 possessions (Offensive Efficiency – Defensive Efficiency). Accounts for pace of play.
- MACD (Moving Average Convergence Divergence): Trend indicator comparing 12-game and 26-game exponential moving averages. Positive MACD = improving trend, Negative MACD = declining trend.
Analysis powered by HoopSci’s advanced metrics and MACD trending indicators.