Southland Update: Week 1
November 16, 2025The Southland enters Week 1 with teams showing diverse trending patterns. This analysis examines each team’s performance trends using MACD (Moving Average Convergence Divergence) indicators to identify not just where teams stand, but where they’re headed.
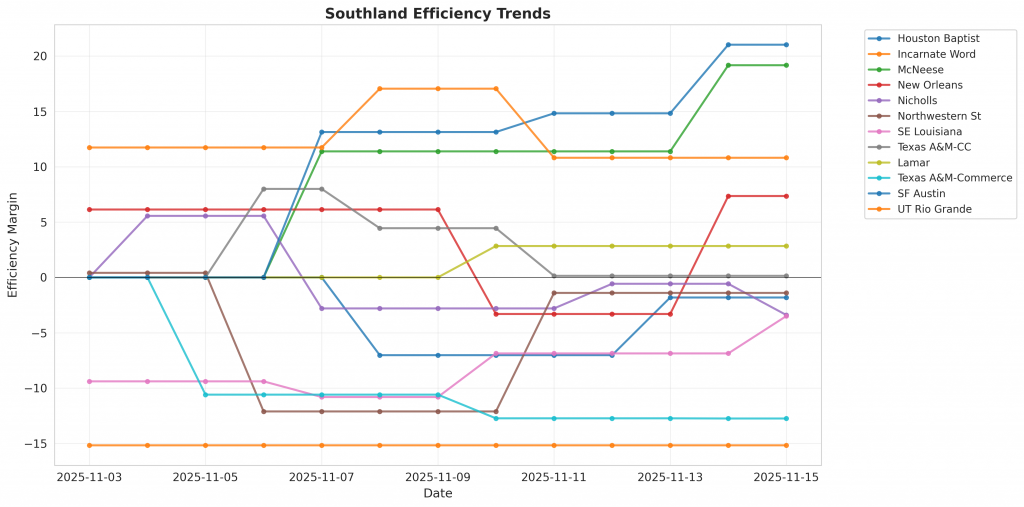
Figure 1: Efficiency margin trends for Southland teams throughout the season. Teams trending upward show improving performance, while downward trends indicate struggles.
Conference Snapshot
- Week Dates: November 03 – November 09, 2025
- Trending Up (Efficiency): New Orleans, SF Austin
- Trending Down (Efficiency): Houston Baptist, Incarnate Word, McNeese, Nicholls, Northwestern St
Team-by-Team Analysis
Houston Baptist
Record: 1-1 | Elo: 1373.6 (ranked 338 of 365) | Efficiency Margin: -1.82 (ranked 260 of 365)
Offensive Trends:
- FTR (Free Throw Rate (FTM/FGA – getting to the line and converting)): Currently ranked 349 of 365 in D1. Trending down strongly.
Defensive Trends:
- DR_PCT (Defensive Rebound Rate (% of available defensive rebounds secured)): Currently ranked 13 of 365 in D1. Trending down moderately.
Incarnate Word
Record: 0-1 | Elo: 1420.4 (ranked 297 of 365) | Efficiency Margin: -15.17 (ranked 343 of 365)
Defensive Trends:
- FTR (FTR Allowed (opponent free throws – lower is better)): Currently ranked 332 of 365 in D1. Trending up strongly.
- EFG (eFG% Allowed (lower is better – opponents shooting less efficiently)): Currently ranked 342 of 365 in D1. Trending up strongly.
Lamar
Record: 1-1 | Elo: 1493.7 (ranked 193 of 365) | Efficiency Margin: +2.84 (ranked 217 of 365)
Insufficient games played for meaningful trend analysis (MACD requires 12+ games).
McNeese
Record: 1-1 | Elo: 1613.2 (ranked 50 of 365) | Efficiency Margin: +19.18 (ranked 90 of 365)
Offensive Trends:
- FTR (Free Throw Rate (FTM/FGA – getting to the line and converting)): Currently ranked 3 of 365 in D1. Trending up strongly.
Defensive Trends:
- DR_PCT (Defensive Rebound Rate (% of available defensive rebounds secured)): Currently ranked 352 of 365 in D1. Trending down moderately.
New Orleans
Record: 2-1 | Elo: 1344.0 (ranked 351 of 365) | Efficiency Margin: +7.36 (ranked 172 of 365)
Offensive Trends:
- OR_PCT (Offensive Rebound Rate (% of available offensive rebounds grabbed)): Currently ranked 155 of 365 in D1. Trending up strongly.
Defensive Trends:
- EFG (eFG% Allowed (lower is better – opponents shooting less efficiently)): Currently ranked 44 of 365 in D1. Trending down strongly.
Nicholls
Record: 0-4 | Elo: 1488.2 (ranked 203 of 365) | Efficiency Margin: -3.40 (ranked 278 of 365)
Offensive Trends:
- EFG (Effective Field Goal % (adjusts for 3-pointers being worth more)): Currently ranked 332 of 365 in D1. Trending down strongly.
- FTR (Free Throw Rate (FTM/FGA – getting to the line and converting)): Currently ranked 250 of 365 in D1. Trending up moderately.
Northwestern St
Record: 0-3 | Elo: 1440.9 (ranked 271 of 365) | Efficiency Margin: -1.40 (ranked 255 of 365)
Offensive Trends:
- FTR (Free Throw Rate (FTM/FGA – getting to the line and converting)): Currently ranked 44 of 365 in D1. Trending up strongly.
Defensive Trends:
- DR_PCT (Defensive Rebound Rate (% of available defensive rebounds secured)): Currently ranked 356 of 365 in D1. Trending down strongly.
- EFG (eFG% Allowed (lower is better – opponents shooting less efficiently)): Currently ranked 324 of 365 in D1. Trending up strongly.
SE Louisiana
Record: 0-4 | Elo: 1451.9 (ranked 259 of 365) | Efficiency Margin: -3.49 (ranked 280 of 365)
Offensive Trends:
- FTR (Free Throw Rate (FTM/FGA – getting to the line and converting)): Currently ranked 106 of 365 in D1. Trending up moderately.
- EFG (Effective Field Goal % (adjusts for 3-pointers being worth more)): Currently ranked 356 of 365 in D1. Trending down strongly.
Defensive Trends:
- FTR (FTR Allowed (opponent free throws – lower is better)): Currently ranked 281 of 365 in D1. Trending up strongly.
- EFG (eFG% Allowed (lower is better – opponents shooting less efficiently)): Currently ranked 271 of 365 in D1. Trending up strongly.
SF Austin
Record: 3-0 | Elo: 1489.4 (ranked 201 of 365) | Efficiency Margin: +21.03 (ranked 80 of 365)
Offensive Trends:
- EFG (Effective Field Goal % (adjusts for 3-pointers being worth more)): Currently ranked 52 of 365 in D1. Trending up strongly.
- TOV_PCT (Turnover Rate (turnovers per 100 possessions – lower is better)): Currently ranked 129 of 365 in D1. Trending down strongly.
Defensive Trends:
- DR_PCT (Defensive Rebound Rate (% of available defensive rebounds secured)): Currently ranked 152 of 365 in D1. Trending down moderately.
- TOV_PCT (Forced Turnover Rate (causing opponent turnovers – higher is better)): Currently ranked 235 of 365 in D1. Trending down strongly.
Texas A&M-CC
Record: 0-3 | Elo: 1481.6 (ranked 216 of 365) | Efficiency Margin: +0.14 (ranked 238 of 365)
Offensive Trends:
- EFG (Effective Field Goal % (adjusts for 3-pointers being worth more)): Currently ranked 353 of 365 in D1. Trending down strongly.
Defensive Trends:
- DR_PCT (Defensive Rebound Rate (% of available defensive rebounds secured)): Currently ranked 147 of 365 in D1. Trending down moderately.
Texas A&M-Commerce
Record: 0-3 | Elo: 1338.2 (ranked 354 of 365) | Efficiency Margin: -12.75 (ranked 336 of 365)
Defensive Trends:
- DR_PCT (Defensive Rebound Rate (% of available defensive rebounds secured)): Currently ranked 309 of 365 in D1. Trending down moderately.
- FTR (FTR Allowed (opponent free throws – lower is better)): Currently ranked 354 of 365 in D1. Trending up strongly.
UT Rio Grande
Record: 1-2 | Elo: 1416.2 (ranked 304 of 365) | Efficiency Margin: +10.81 (ranked 144 of 365)
Offensive Trends:
- FTR (Free Throw Rate (FTM/FGA – getting to the line and converting)): Currently ranked 354 of 365 in D1. Trending down moderately.
- EFG (Effective Field Goal % (adjusts for 3-pointers being worth more)): Currently ranked 63 of 365 in D1. Trending up strongly.
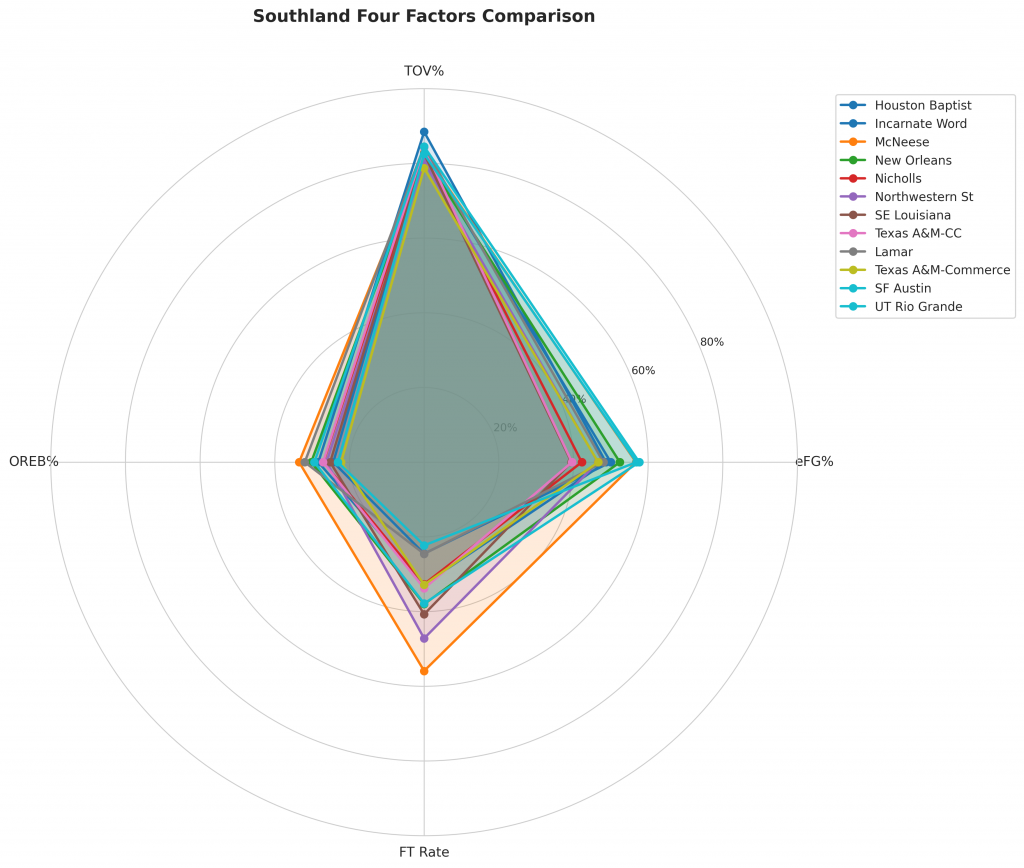
Figure 2: Four Factors comparison across Southland teams. The radar chart shows each team’s offensive efficiency (eFG%), ball security (TOV%), rebounding (OREB%), and free throw generation (FT Rate).
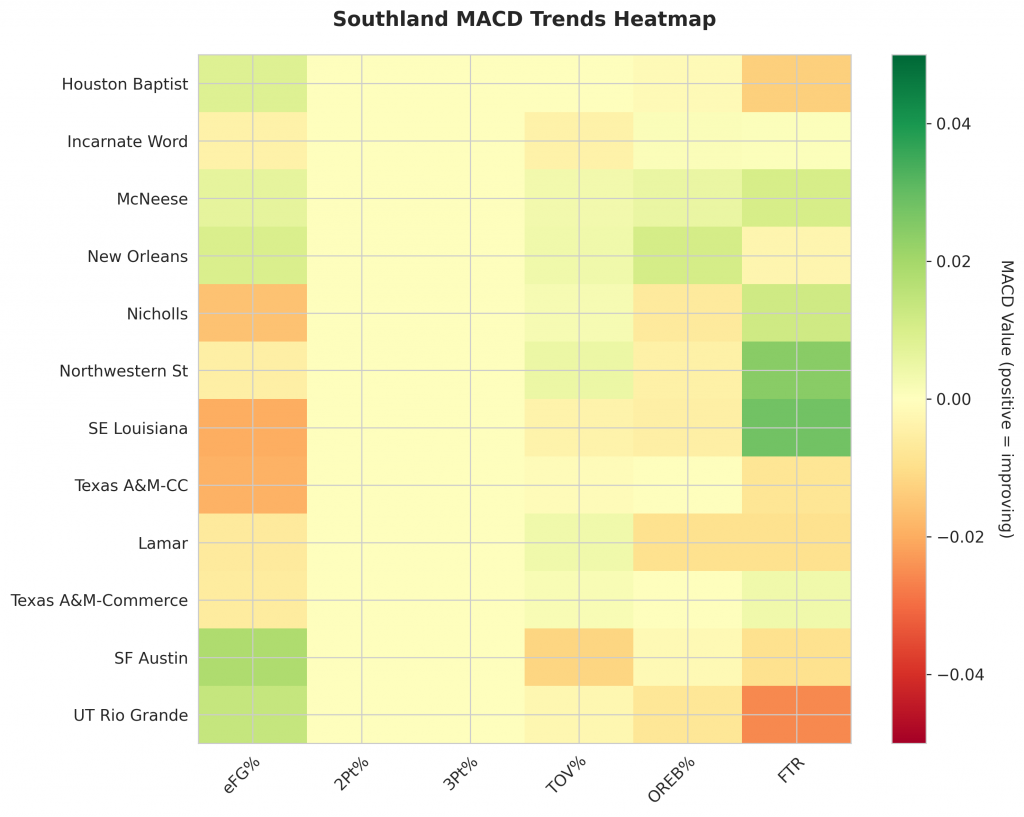
Figure 3: MACD trends heatmap showing which metrics are improving (green) or declining (red) for each team. Stronger colors indicate more pronounced trends.
Looking Ahead
As Southland teams continue their season, the MACD trending indicators will help identify which teams are genuinely improving versus those riding unsustainable momentum. Check back next week for updated analysis.
Metrics Glossary
Four Factors (Dean Oliver’s framework for basketball success):
- eFG% (Effective Field Goal %): Field goal percentage adjusted for 3-pointers being worth more (FGM + 0.5×3PM) / FGA. Higher is better offensively, lower is better defensively.
- TOV% (Turnover Rate): Turnovers per 100 possessions. Lower is better offensively (taking care of the ball), higher is better defensively (forcing turnovers).
- OREB% / DREB% (Offensive/Defensive Rebound Rate): Percentage of available rebounds grabbed. Offensive rebounds create second-chance points; defensive rebounds end opponent possessions.
- FTR (Free Throw Rate): Free throws made per field goal attempt (FTM/FGA). Measures ability to get to the line AND convert. Higher is better offensively, lower is better defensively.
Other Metrics:
- Elo Rating: Chess-style rating system that updates based on game results and opponent strength. Higher Elo indicates stronger team.
- Efficiency Margin: Point differential per 100 possessions (Offensive Efficiency – Defensive Efficiency). Accounts for pace of play.
- MACD (Moving Average Convergence Divergence): Trend indicator comparing 12-game and 26-game exponential moving averages. Positive MACD = improving trend, Negative MACD = declining trend.
Analysis powered by HoopSci’s advanced metrics and MACD trending indicators.