Summit League Update: Week 1
November 16, 2025The Summit League enters Week 1 with teams showing diverse trending patterns. This analysis examines each team’s performance trends using MACD (Moving Average Convergence Divergence) indicators to identify not just where teams stand, but where they’re headed.
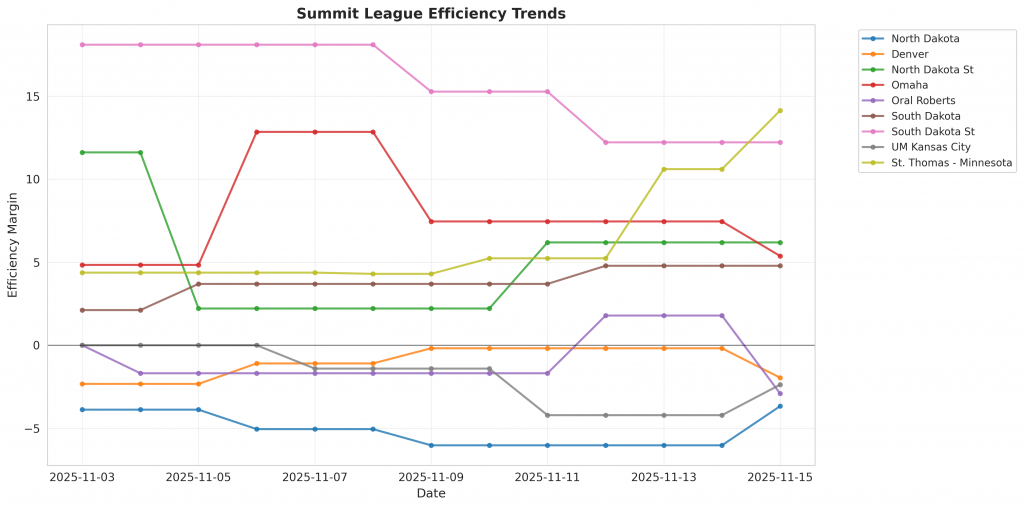
Figure 1: Efficiency margin trends for Summit League teams throughout the season. Teams trending upward show improving performance, while downward trends indicate struggles.
Conference Snapshot
- Week Dates: November 03 – November 09, 2025
- Trending Up (Efficiency): Omaha
- Trending Down (Efficiency): North Dakota, Denver, North Dakota St, Oral Roberts, South Dakota
Team-by-Team Analysis
Denver
Record: 1-3 | Elo: 1399.7 (ranked 318 of 365) | Efficiency Margin: -1.95 (ranked 262 of 365)
Insufficient games played for meaningful trend analysis (MACD requires 12+ games).
North Dakota
Record: 1-3 | Elo: 1420.7 (ranked 296 of 365) | Efficiency Margin: -3.67 (ranked 282 of 365)
Offensive Trends:
- OR_PCT (Offensive Rebound Rate (% of available offensive rebounds grabbed)): Currently ranked 307 of 365 in D1. Trending down strongly.
Defensive Trends:
- FTR (FTR Allowed (opponent free throws – lower is better)): Currently ranked 318 of 365 in D1. Trending up strongly.
- TOV_PCT (Forced Turnover Rate (causing opponent turnovers – higher is better)): Currently ranked 19 of 365 in D1. Trending up strongly.
North Dakota St
Record: 1-2 | Elo: 1515.3 (ranked 162 of 365) | Efficiency Margin: +6.19 (ranked 184 of 365)
Offensive Trends:
- EFG (Effective Field Goal % (adjusts for 3-pointers being worth more)): Currently ranked 325 of 365 in D1. Trending down strongly.
- OR_PCT (Offensive Rebound Rate (% of available offensive rebounds grabbed)): Currently ranked 63 of 365 in D1. Trending up strongly.
Defensive Trends:
- FTR (FTR Allowed (opponent free throws – lower is better)): Currently ranked 165 of 365 in D1. Trending up strongly.
- TOV_PCT (Forced Turnover Rate (causing opponent turnovers – higher is better)): Currently ranked 74 of 365 in D1. Trending up strongly.
Omaha
Record: 1-3 | Elo: 1503.6 (ranked 177 of 365) | Efficiency Margin: +5.37 (ranked 192 of 365)
Offensive Trends:
- OR_PCT (Offensive Rebound Rate (% of available offensive rebounds grabbed)): Currently ranked 341 of 365 in D1. Trending down strongly.
- FTR (Free Throw Rate (FTM/FGA – getting to the line and converting)): Currently ranked 101 of 365 in D1. Trending up strongly.
Defensive Trends:
- FTR (FTR Allowed (opponent free throws – lower is better)): Currently ranked 292 of 365 in D1. Trending up strongly.
- DR_PCT (Defensive Rebound Rate (% of available defensive rebounds secured)): Currently ranked 277 of 365 in D1. Trending down strongly.
Oral Roberts
Record: 0-3 | Elo: 1374.6 (ranked 337 of 365) | Efficiency Margin: -2.91 (ranked 275 of 365)
Offensive Trends:
- FTR (Free Throw Rate (FTM/FGA – getting to the line and converting)): Currently ranked 190 of 365 in D1. Trending up strongly.
Defensive Trends:
- FTR (FTR Allowed (opponent free throws – lower is better)): Currently ranked 285 of 365 in D1. Trending up strongly.
South Dakota
Record: 1-2 | Elo: 1461.8 (ranked 240 of 365) | Efficiency Margin: +4.78 (ranked 196 of 365)
Offensive Trends:
- EFG (Effective Field Goal % (adjusts for 3-pointers being worth more)): Currently ranked 319 of 365 in D1. Trending down strongly.
- FTR (Free Throw Rate (FTM/FGA – getting to the line and converting)): Currently ranked 23 of 365 in D1. Trending up strongly.
Defensive Trends:
- FTR (FTR Allowed (opponent free throws – lower is better)): Currently ranked 77 of 365 in D1. Trending down moderately.
South Dakota St
Record: 1-2 | Elo: 1547.0 (ranked 114 of 365) | Efficiency Margin: +12.22 (ranked 137 of 365)
Offensive Trends:
- OR_PCT (Offensive Rebound Rate (% of available offensive rebounds grabbed)): Currently ranked 111 of 365 in D1. Trending up moderately.
Defensive Trends:
- FTR (FTR Allowed (opponent free throws – lower is better)): Currently ranked 173 of 365 in D1. Trending up strongly.
- DR_PCT (Defensive Rebound Rate (% of available defensive rebounds secured)): Currently ranked 3 of 365 in D1. Trending up moderately.
St. Thomas – Minnesota
Record: 3-2 | Elo: 1552.3 (ranked 108 of 365) | Efficiency Margin: +14.13 (ranked 124 of 365)
Offensive Trends:
- OR_PCT (Offensive Rebound Rate (% of available offensive rebounds grabbed)): Currently ranked 365 of 365 in D1. Trending down strongly.
Defensive Trends:
- FTR (FTR Allowed (opponent free throws – lower is better)): Currently ranked 44 of 365 in D1. Trending down strongly.
UM Kansas City
Record: 1-3 | Elo: 1404.6 (ranked 311 of 365) | Efficiency Margin: -2.37 (ranked 270 of 365)
Defensive Trends:
- EFG (eFG% Allowed (lower is better – opponents shooting less efficiently)): Currently ranked 338 of 365 in D1. Trending up strongly.
- DR_PCT (Defensive Rebound Rate (% of available defensive rebounds secured)): Currently ranked 300 of 365 in D1. Trending down strongly.
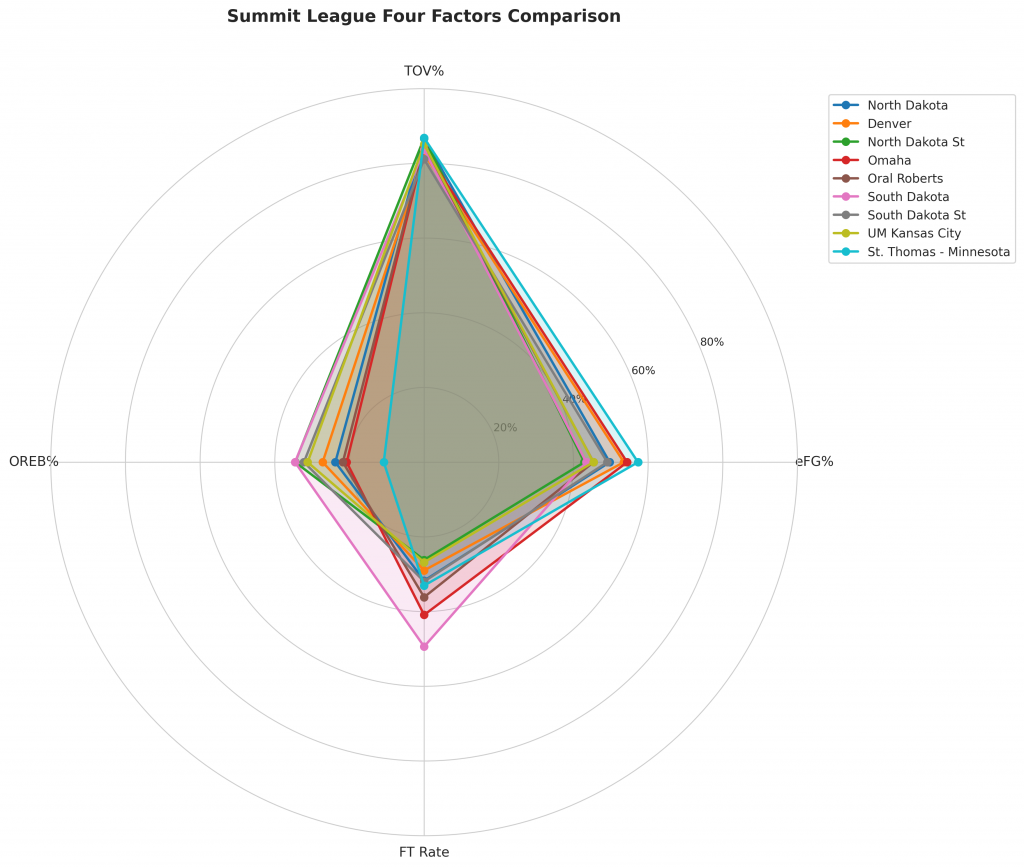
Figure 2: Four Factors comparison across Summit League teams. The radar chart shows each team’s offensive efficiency (eFG%), ball security (TOV%), rebounding (OREB%), and free throw generation (FT Rate).
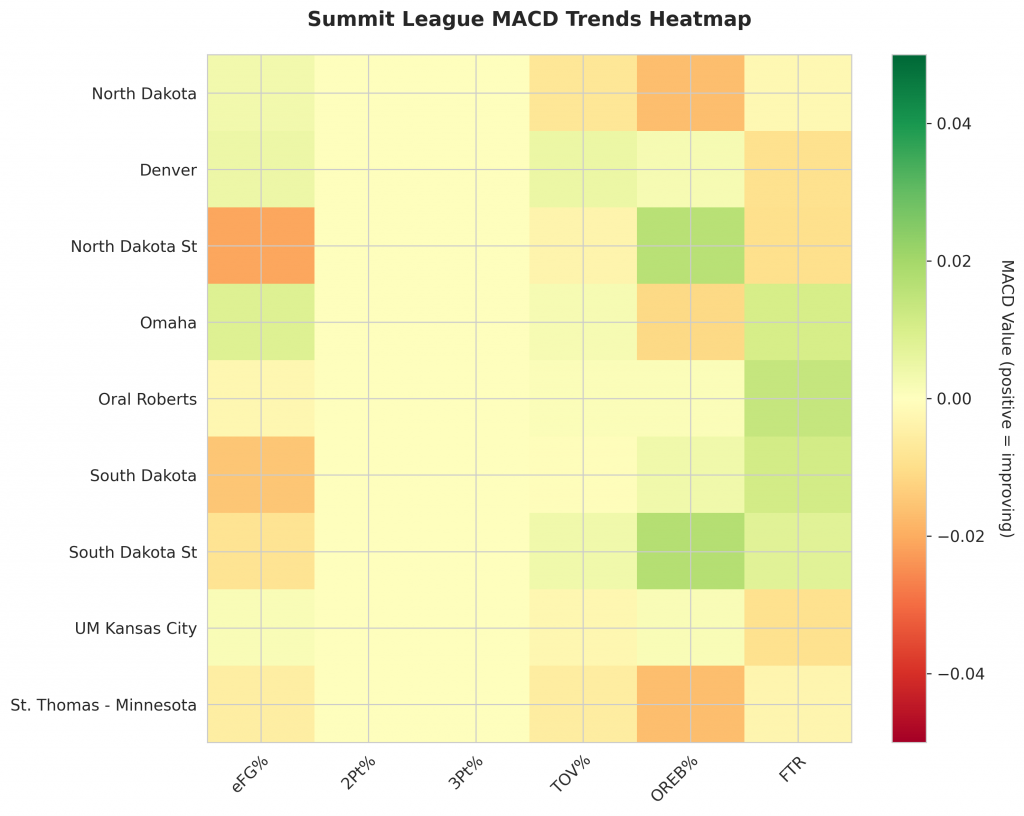
Figure 3: MACD trends heatmap showing which metrics are improving (green) or declining (red) for each team. Stronger colors indicate more pronounced trends.
Looking Ahead
As Summit League teams continue their season, the MACD trending indicators will help identify which teams are genuinely improving versus those riding unsustainable momentum. Check back next week for updated analysis.
Metrics Glossary
Four Factors (Dean Oliver’s framework for basketball success):
- eFG% (Effective Field Goal %): Field goal percentage adjusted for 3-pointers being worth more (FGM + 0.5×3PM) / FGA. Higher is better offensively, lower is better defensively.
- TOV% (Turnover Rate): Turnovers per 100 possessions. Lower is better offensively (taking care of the ball), higher is better defensively (forcing turnovers).
- OREB% / DREB% (Offensive/Defensive Rebound Rate): Percentage of available rebounds grabbed. Offensive rebounds create second-chance points; defensive rebounds end opponent possessions.
- FTR (Free Throw Rate): Free throws made per field goal attempt (FTM/FGA). Measures ability to get to the line AND convert. Higher is better offensively, lower is better defensively.
Other Metrics:
- Elo Rating: Chess-style rating system that updates based on game results and opponent strength. Higher Elo indicates stronger team.
- Efficiency Margin: Point differential per 100 possessions (Offensive Efficiency – Defensive Efficiency). Accounts for pace of play.
- MACD (Moving Average Convergence Divergence): Trend indicator comparing 12-game and 26-game exponential moving averages. Positive MACD = improving trend, Negative MACD = declining trend.
Analysis powered by HoopSci’s advanced metrics and MACD trending indicators.