Summit League Update: Week 2
November 19, 2025The Summit League enters Week 2 with teams showing diverse trending patterns. This analysis examines each team’s performance trends using MACD (Moving Average Convergence Divergence) indicators to identify not just where teams stand, but where they’re headed.
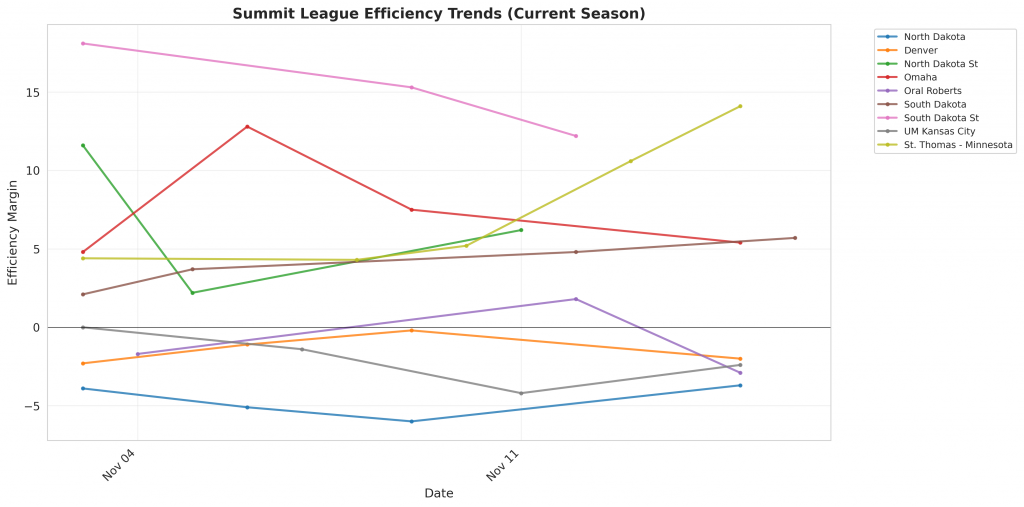
Figure 1: Efficiency margin trends for Summit League teams throughout the season. Teams trending upward show improving performance, while downward trends indicate struggles.
Conference Snapshot
- Week Dates: November 10 – November 16, 2025
- Trending Up (Efficiency): North Dakota, Denver, St. Thomas – Minnesota
- Trending Down (Efficiency): North Dakota St, Omaha, Oral Roberts, South Dakota, South Dakota St
Team-by-Team Analysis
Denver
Record: 1-3 | Elo: 1399.7 (ranked 318 of 365) | Efficiency Margin: -1.95 (ranked 263 of 365)
Offensive Trends:
- 3Pt Pct (3 Point FGM/FGA (%)): Currently ranked 36 of 365 in D1. Trending up strongly.
- Balls Stolen Per Poss (Balls Stolen Per Possession): Currently ranked 253 of 365 in D1. Trending up strongly.
Defensive Trends:
- Opp FT Rate (Opp FTA/FGA (%)): Currently ranked 100 of 365 in D1. Trending down strongly.
- Opp FGM Per Poss (Opp FG Makes Per Possession (%)): Currently ranked 316 of 365 in D1. Trending up strongly.
North Dakota
Record: 1-3 | Elo: 1420.7 (ranked 294 of 365) | Efficiency Margin: -3.67 (ranked 283 of 365)
Offensive Trends:
- Off Reb Pct (Offensive Rebounding): Currently ranked 326 of 365 in D1. Trending down strongly.
- FGA Per Poss (Field Goal Attempts Per Possession (%)): Currently ranked 101 of 365 in D1. Trending down strongly.
Defensive Trends:
- Opp Shooting (Opp Shooting): Currently ranked 352 of 365 in D1. Trending up strongly.
- Opp Turnovers (Opp Turnovers): Currently ranked 28 of 365 in D1. Trending up strongly.
North Dakota St
Record: 1-2 | Elo: 1515.3 (ranked 163 of 365) | Efficiency Margin: +6.19 (ranked 182 of 365)
Offensive Trends:
- Shooting (Shooting): Currently ranked 326 of 365 in D1. Trending down strongly.
- Off Reb Pct (Offensive Rebounding): Currently ranked 48 of 365 in D1. Trending up strongly.
Defensive Trends:
- Opp Shooting (Opp Shooting): Currently ranked 323 of 365 in D1. Trending up strongly.
- Opp Turnovers (Opp Turnovers): Currently ranked 81 of 365 in D1. Trending up strongly.
Omaha
Record: 1-3 | Elo: 1503.6 (ranked 176 of 365) | Efficiency Margin: +5.37 (ranked 192 of 365)
Offensive Trends:
- Off Reb Pct (Offensive Rebounding): Currently ranked 341 of 365 in D1. Trending down strongly.
- Adj Def Eff (Adjusted Defensive Efficiency): Currently ranked 294 of 365 in D1. Trending down strongly.
Defensive Trends:
- Def Reb Pct (Defensive Rebounding): Currently ranked 183 of 365 in D1. Trending down strongly.
- Opp 2Pt Rate (Opp 2 Point Attempts/FGA (%)): Currently ranked 32 of 365 in D1. Trending down strongly.
Oral Roberts
Record: 0-3 | Elo: 1374.6 (ranked 338 of 365) | Efficiency Margin: -2.91 (ranked 274 of 365)
Offensive Trends:
- Shooting (Shooting): Currently ranked 286 of 365 in D1. Trending down strongly.
- Adj Off Eff (Adjusted Offensive Efficiency): Currently ranked 268 of 365 in D1. Trending down strongly.
Defensive Trends:
- Opp Turnovers (Opp Turnovers): Currently ranked 79 of 365 in D1. Trending up strongly.
- Def Reb Pct (Defensive Rebounding): Currently ranked 312 of 365 in D1. Trending down strongly.
South Dakota
Record: 2-2 | Elo: 1468.3 (ranked 231 of 365) | Efficiency Margin: +5.74 (ranked 187 of 365)
Offensive Trends:
- Shooting (Shooting): Currently ranked 280 of 365 in D1. Trending down strongly.
- Adj Off Eff (Adjusted Offensive Efficiency): Currently ranked 219 of 365 in D1. Trending down strongly.
Defensive Trends:
- Def Reb Pct (Defensive Rebounding): Currently ranked 261 of 365 in D1. Trending down strongly.
- Opp FGM Per Poss (Opp FG Makes Per Possession (%)): Currently ranked 330 of 365 in D1. Trending up strongly.
South Dakota St
Record: 1-2 | Elo: 1547.0 (ranked 114 of 365) | Efficiency Margin: +12.22 (ranked 136 of 365)
Offensive Trends:
- Shooting (Shooting): Currently ranked 218 of 365 in D1. Trending down strongly.
- FGM Per Poss (Field Goal Makes Per Possession (%)): Currently ranked 193 of 365 in D1. Trending down strongly.
Defensive Trends:
- Opp Shooting (Opp Shooting): Currently ranked 178 of 365 in D1. Trending up strongly.
- Def Reb Pct (Defensive Rebounding): Currently ranked 201 of 365 in D1. Trending down strongly.
St. Thomas – Minnesota
Record: 3-2 | Elo: 1552.3 (ranked 108 of 365) | Efficiency Margin: +14.13 (ranked 123 of 365)
Offensive Trends:
- Off Reb Pct (Offensive Rebounding): Currently ranked 365 of 365 in D1. Trending down strongly.
- Adj Off Eff (Adjusted Offensive Efficiency): Currently ranked 125 of 365 in D1. Trending down strongly.
Defensive Trends:
- Opp FT Rate (Opp FTA/FGA (%)): Currently ranked 39 of 365 in D1. Trending down strongly.
- Opp 2PM Per Poss (Opp 2 Point Makes Per Possession (%)): Currently ranked 184 of 365 in D1. Trending up strongly.
UM Kansas City
Record: 1-3 | Elo: 1404.6 (ranked 311 of 365) | Efficiency Margin: -2.37 (ranked 270 of 365)
Offensive Trends:
- Shooting (Shooting): Currently ranked 259 of 365 in D1. Trending down strongly.
- FT Rate (FTA/FGA (%)): Currently ranked 334 of 365 in D1. Trending down strongly.
Defensive Trends:
- Opp Shooting (Opp Shooting): Currently ranked 317 of 365 in D1. Trending up strongly.
- Opp Turnovers (Opp Turnovers): Currently ranked 265 of 365 in D1. Trending down strongly.
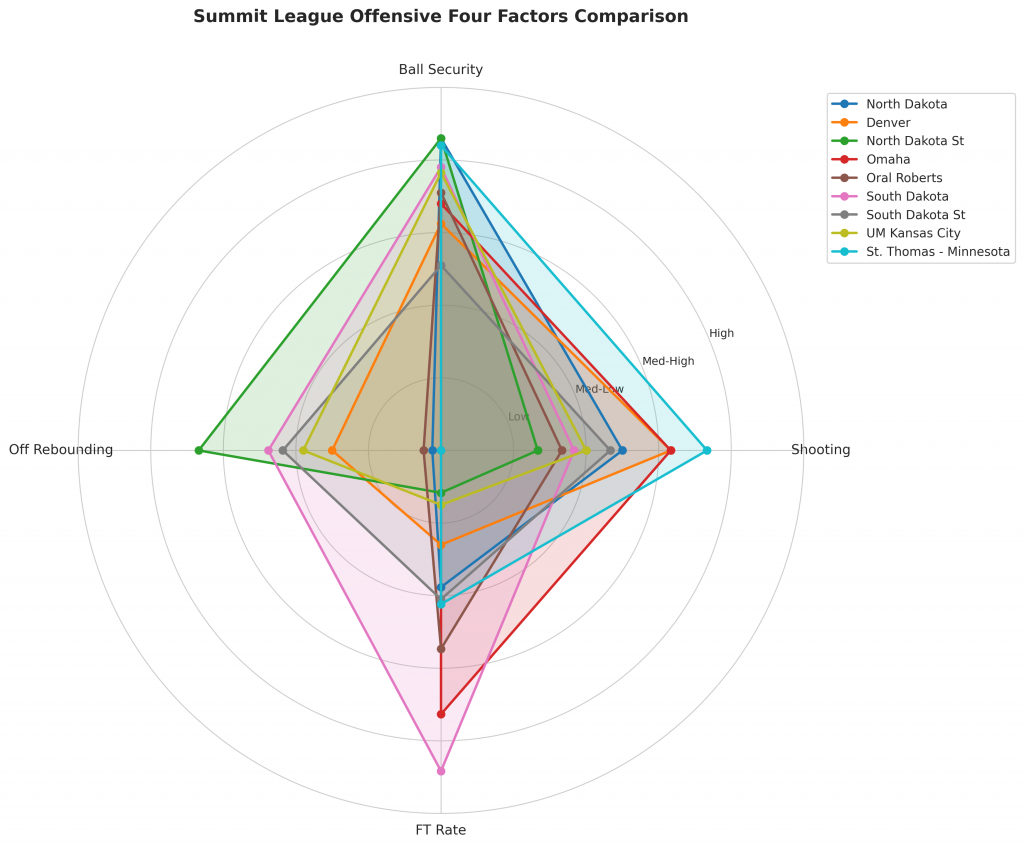
Figure 2: Offensive Four Factors comparison across Summit League teams. The radar chart shows each team’s shooting efficiency (eFG%), ball security (TOV%), offensive rebounding (OREB%), and free throw generation (FT Rate).
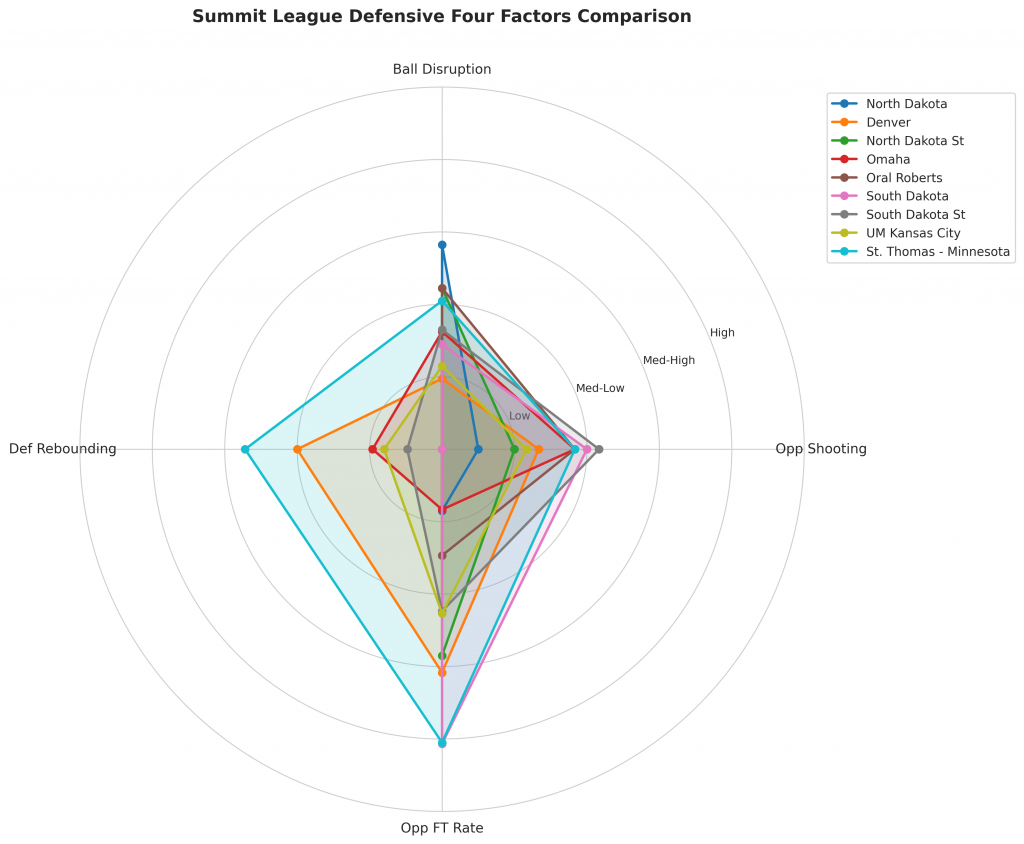
Figure 3: Defensive Four Factors comparison across Summit League teams. The radar chart shows each team’s opponent shooting defense (Opp eFG%), ball disruption (forcing TOV%), defensive rebounding (DREB%), and opponent free throw prevention (Opp FT Rate).
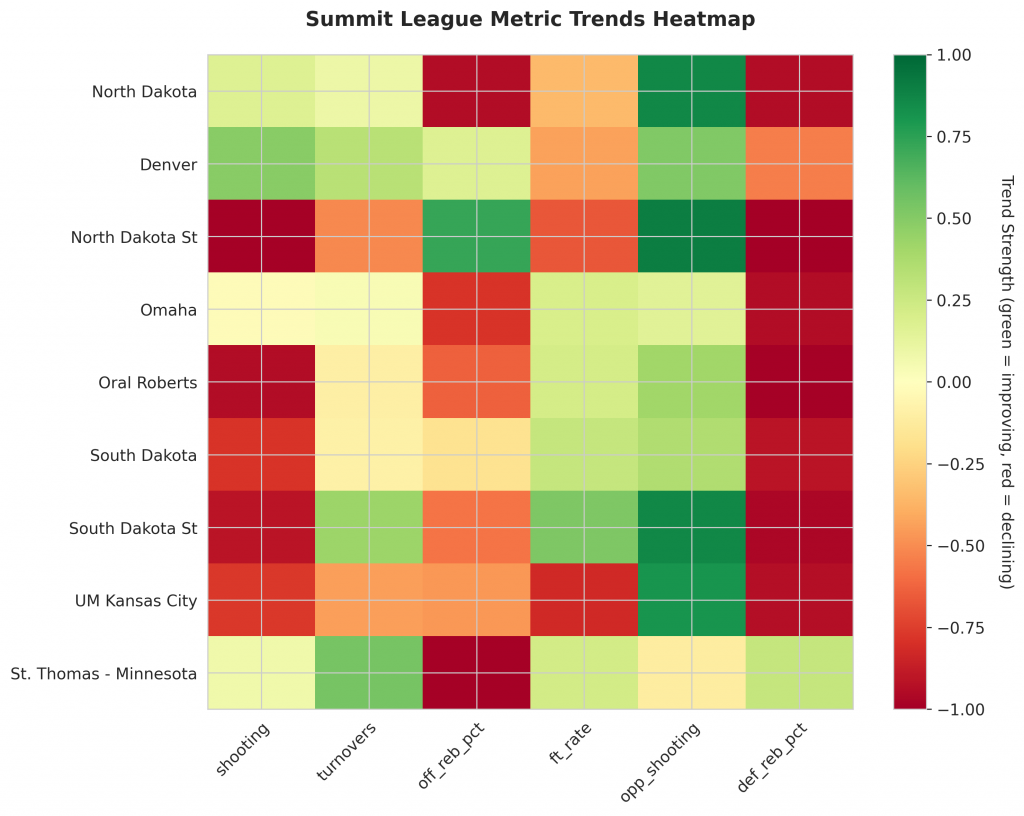
Figure 4: MACD trends heatmap showing which metrics are improving (green) or declining (red) for each team. Stronger colors indicate more pronounced trends.
Looking Ahead
As Summit League teams continue their season, the MACD trending indicators will help identify which teams are genuinely improving versus those riding unsustainable momentum. Check back next week for updated analysis.
Metrics Glossary
Four Factors (Dean Oliver’s framework for basketball success):
- eFG% (Effective Field Goal %): Field goal percentage adjusted for 3-pointers being worth more (FGM + 0.5×3PM) / FGA. Higher is better offensively, lower is better defensively.
- TOV% (Turnover Rate): Turnovers per 100 possessions. Lower is better offensively (taking care of the ball), higher is better defensively (forcing turnovers).
- OREB% / DREB% (Offensive/Defensive Rebound Rate): Percentage of available rebounds grabbed. Offensive rebounds create second-chance points; defensive rebounds end opponent possessions.
- FTR (Free Throw Rate): Free throws made per field goal attempt (FTM/FGA). Measures ability to get to the line AND convert. Higher is better offensively, lower is better defensively.
Other Metrics:
- Elo Rating: Chess-style rating system that updates based on game results and opponent strength. Higher Elo indicates stronger team.
- Efficiency Margin: Point differential per 100 possessions (Offensive Efficiency – Defensive Efficiency). Accounts for pace of play.
- MACD (Moving Average Convergence Divergence): Trend indicator comparing 12-game and 26-game exponential moving averages. Positive MACD = improving trend, Negative MACD = declining trend.
Analysis powered by HoopSci’s advanced metrics and MACD trending indicators.