West Coast Update: Week 2
November 19, 2025The West Coast enters Week 2 with teams showing diverse trending patterns. This analysis examines each team’s performance trends using MACD (Moving Average Convergence Divergence) indicators to identify not just where teams stand, but where they’re headed.
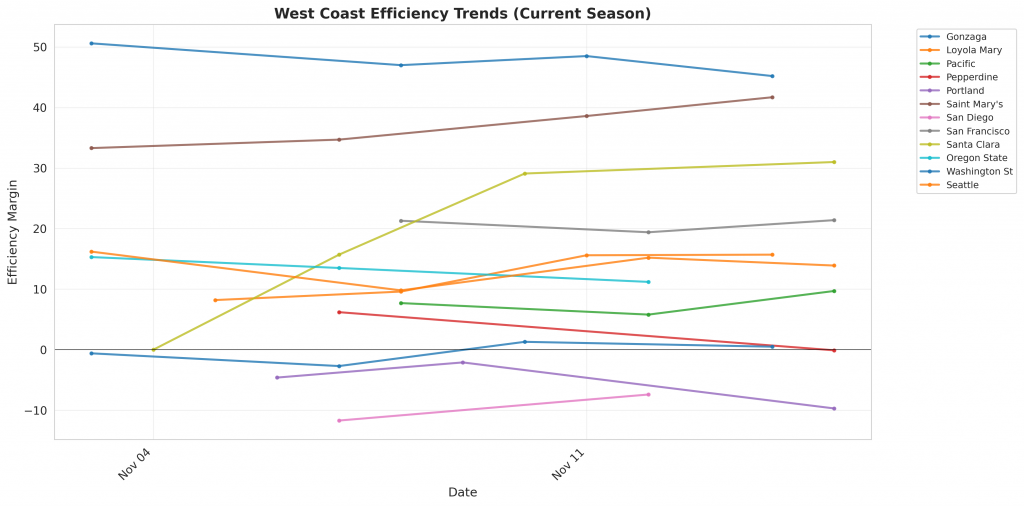
Figure 1: Efficiency margin trends for West Coast teams throughout the season. Teams trending upward show improving performance, while downward trends indicate struggles.
Conference Snapshot
- Week Dates: November 10 – November 16, 2025
- Trending Up (Efficiency): Loyola Mary, Pacific, Saint Mary’s, San Diego, Santa Clara
- Trending Down (Efficiency): Gonzaga, Pepperdine, Portland, San Francisco, Oregon State
Team-by-Team Analysis
Gonzaga
Record: 4-0 | Elo: 1701.5 (ranked 9 of 365) | Efficiency Margin: +45.23 (ranked 4 of 365)
Offensive Trends:
- Adj Off Eff (Adjusted Offensive Efficiency): Currently ranked 25 of 365 in D1. Trending down strongly.
- FT Pct (FTM/FTA (%)): Currently ranked 302 of 365 in D1. Trending down strongly.
Defensive Trends:
- Opp Shooting (Opp Shooting): Currently ranked 9 of 365 in D1. Trending down strongly.
- Opp FT Rate (Opp FTA/FGA (%)): Currently ranked 235 of 365 in D1. Trending up strongly.
Loyola Mary
Record: 4-0 | Elo: 1519.3 (ranked 158 of 365) | Efficiency Margin: +15.70 (ranked 111 of 365)
Offensive Trends:
- Shooting (Shooting): Currently ranked 24 of 365 in D1. Trending up strongly.
- FGM Per Poss (Field Goal Makes Per Possession (%)): Currently ranked 42 of 365 in D1. Trending up strongly.
Defensive Trends:
- Opp Turnovers (Opp Turnovers): Currently ranked 160 of 365 in D1. Trending up strongly.
- Opp FGA Per Poss (Opp FG Attempts Per Possession (%)): Currently ranked 168 of 365 in D1. Trending down strongly.
Oregon State
Record: 3-0 | Elo: 1528.2 (ranked 142 of 365) | Efficiency Margin: +11.24 (ranked 142 of 365)
Offensive Trends:
- FT Rate (FTA/FGA (%)): Currently ranked 12 of 365 in D1. Trending up strongly.
- FGM Per Poss (Field Goal Makes Per Possession (%)): Currently ranked 302 of 365 in D1. Trending down strongly.
Defensive Trends:
- Def Reb Pct (Defensive Rebounding): Currently ranked 161 of 365 in D1. Trending down strongly.
- Opp FGA Per Poss (Opp FG Attempts Per Possession (%)): Currently ranked 319 of 365 in D1. Trending up strongly.
Pacific
Record: 2-1 | Elo: 1372.3 (ranked 341 of 365) | Efficiency Margin: +9.72 (ranked 149 of 365)
Offensive Trends:
- Shooting (Shooting): Currently ranked 90 of 365 in D1. Trending up strongly.
- Turnovers (Turnovers): Currently ranked 257 of 365 in D1. Trending up strongly.
Defensive Trends:
- Opp Shooting (Opp Shooting): Currently ranked 90 of 365 in D1. Trending down strongly.
- Def Reb Pct (Defensive Rebounding): Currently ranked 264 of 365 in D1. Trending down strongly.
Pepperdine
Record: 0-2 | Elo: 1418.5 (ranked 298 of 365) | Efficiency Margin: -0.09 (ranked 242 of 365)
Offensive Trends:
- Turnovers (Turnovers): Currently ranked 76 of 365 in D1. Trending down strongly.
- FGA Per Poss (Field Goal Attempts Per Possession (%)): Currently ranked 33 of 365 in D1. Trending up strongly.
Defensive Trends:
- Opp Shooting (Opp Shooting): Currently ranked 321 of 365 in D1. Trending up strongly.
- Opp Turnovers (Opp Turnovers): Currently ranked 92 of 365 in D1. Trending up strongly.
Portland
Record: 2-1 | Elo: 1438.1 (ranked 274 of 365) | Efficiency Margin: -9.65 (ranked 327 of 365)
Offensive Trends:
- FT Rate (FTA/FGA (%)): Currently ranked 20 of 365 in D1. Trending up strongly.
- FGA Per Poss (Field Goal Attempts Per Possession (%)): Currently ranked 361 of 365 in D1. Trending down strongly.
Defensive Trends:
- Opp Turnovers (Opp Turnovers): Currently ranked 106 of 365 in D1. Trending up strongly.
- Def Reb Pct (Defensive Rebounding): Currently ranked 293 of 365 in D1. Trending down strongly.
Saint Mary’s
Record: 4-0 | Elo: 1702.0 (ranked 8 of 365) | Efficiency Margin: +41.66 (ranked 7 of 365)
Offensive Trends:
- Turnovers (Turnovers): Currently ranked 190 of 365 in D1. Trending up strongly.
- FT Rate (FTA/FGA (%)): Currently ranked 105 of 365 in D1. Trending up strongly.
Defensive Trends:
- Opp FGA Per Poss (Opp FG Attempts Per Possession (%)): Currently ranked 251 of 365 in D1. Trending up strongly.
- Opp FG Pct (%) (Opp FGM/FGA (%)): Currently ranked 27 of 365 in D1. Trending down strongly.
San Diego
Record: 1-1 | Elo: 1371.9 (ranked 342 of 365) | Efficiency Margin: -7.42 (ranked 311 of 365)
Offensive Trends:
- Shooting (Shooting): Currently ranked 66 of 365 in D1. Trending up strongly.
- FGM Per Poss (Field Goal Makes Per Possession (%)): Currently ranked 80 of 365 in D1. Trending up strongly.
Defensive Trends:
- Def Reb Pct (Defensive Rebounding): Currently ranked 345 of 365 in D1. Trending down strongly.
- Opp FT Rate (Opp FTA/FGA (%)): Currently ranked 58 of 365 in D1. Trending down strongly.
San Francisco
Record: 2-1 | Elo: 1612.1 (ranked 51 of 365) | Efficiency Margin: +21.36 (ranked 79 of 365)
Offensive Trends:
- Turnovers (Turnovers): Currently ranked 324 of 365 in D1. Trending up strongly.
- Adj Off Eff (Adjusted Offensive Efficiency): Currently ranked 139 of 365 in D1. Trending down strongly.
Defensive Trends:
- Def Reb Pct (Defensive Rebounding): Currently ranked 254 of 365 in D1. Trending down strongly.
- Opp FGA Per Poss (Opp FG Attempts Per Possession (%)): Currently ranked 232 of 365 in D1. Trending up strongly.
Santa Clara
Record: 4-0 | Elo: 1595.5 (ranked 63 of 365) | Efficiency Margin: +30.99 (ranked 30 of 365)
Offensive Trends:
- Off Reb Pct (Offensive Rebounding): Currently ranked 33 of 365 in D1. Trending up strongly.
- FGM Per Poss (Field Goal Makes Per Possession (%)): Currently ranked 45 of 365 in D1. Trending up strongly.
Defensive Trends:
- Opp FT Rate (Opp FTA/FGA (%)): Currently ranked 238 of 365 in D1. Trending up strongly.
- Opp 2Pt Rate (Opp 2 Point Attempts/FGA (%)): Currently ranked 308 of 365 in D1. Trending up strongly.
Seattle
Record: 3-1 | Elo: 1509.7 (ranked 170 of 365) | Efficiency Margin: +13.85 (ranked 124 of 365)
Offensive Trends:
- Shooting (Shooting): Currently ranked 8 of 365 in D1. Trending up strongly.
- Turnovers (Turnovers): Currently ranked 279 of 365 in D1. Trending up strongly.
Defensive Trends:
- Opp Turnovers (Opp Turnovers): Currently ranked 18 of 365 in D1. Trending up strongly.
- Def Reb Pct (Defensive Rebounding): Currently ranked 120 of 365 in D1. Trending down strongly.
Washington St
Record: 1-3 | Elo: 1520.5 (ranked 156 of 365) | Efficiency Margin: +0.49 (ranked 235 of 365)
Offensive Trends:
- Turnovers (Turnovers): Currently ranked 107 of 365 in D1. Trending down strongly.
- Adj Off Eff (Adjusted Offensive Efficiency): Currently ranked 180 of 365 in D1. Trending down strongly.
Defensive Trends:
- Opp Shooting (Opp Shooting): Currently ranked 338 of 365 in D1. Trending up strongly.
- Def Reb Pct (Defensive Rebounding): Currently ranked 7 of 365 in D1. Trending up strongly.
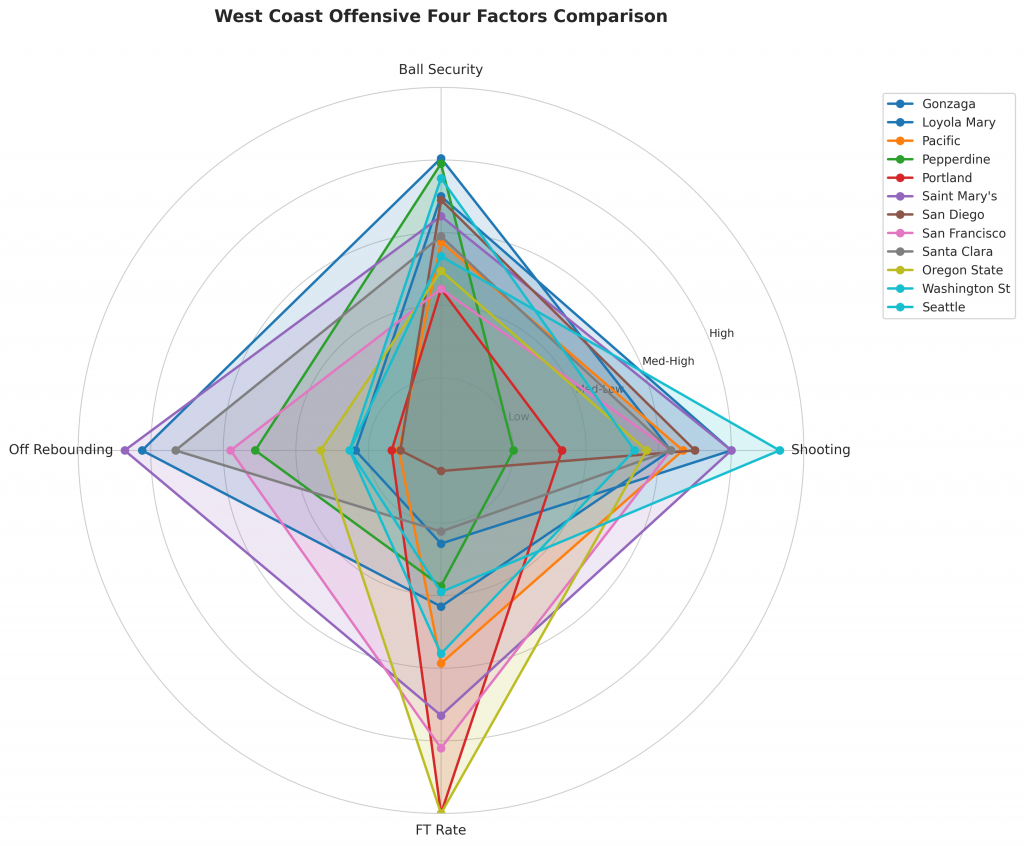
Figure 2: Offensive Four Factors comparison across West Coast teams. The radar chart shows each team’s shooting efficiency (eFG%), ball security (TOV%), offensive rebounding (OREB%), and free throw generation (FT Rate).
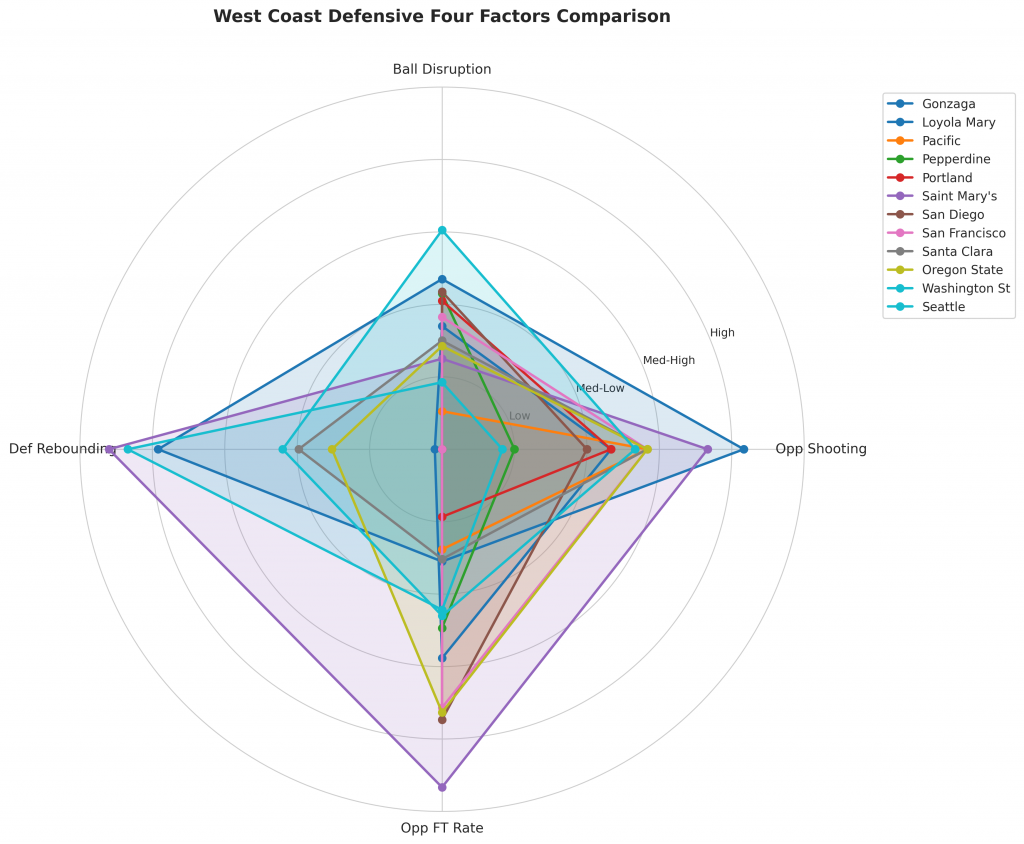
Figure 3: Defensive Four Factors comparison across West Coast teams. The radar chart shows each team’s opponent shooting defense (Opp eFG%), ball disruption (forcing TOV%), defensive rebounding (DREB%), and opponent free throw prevention (Opp FT Rate).
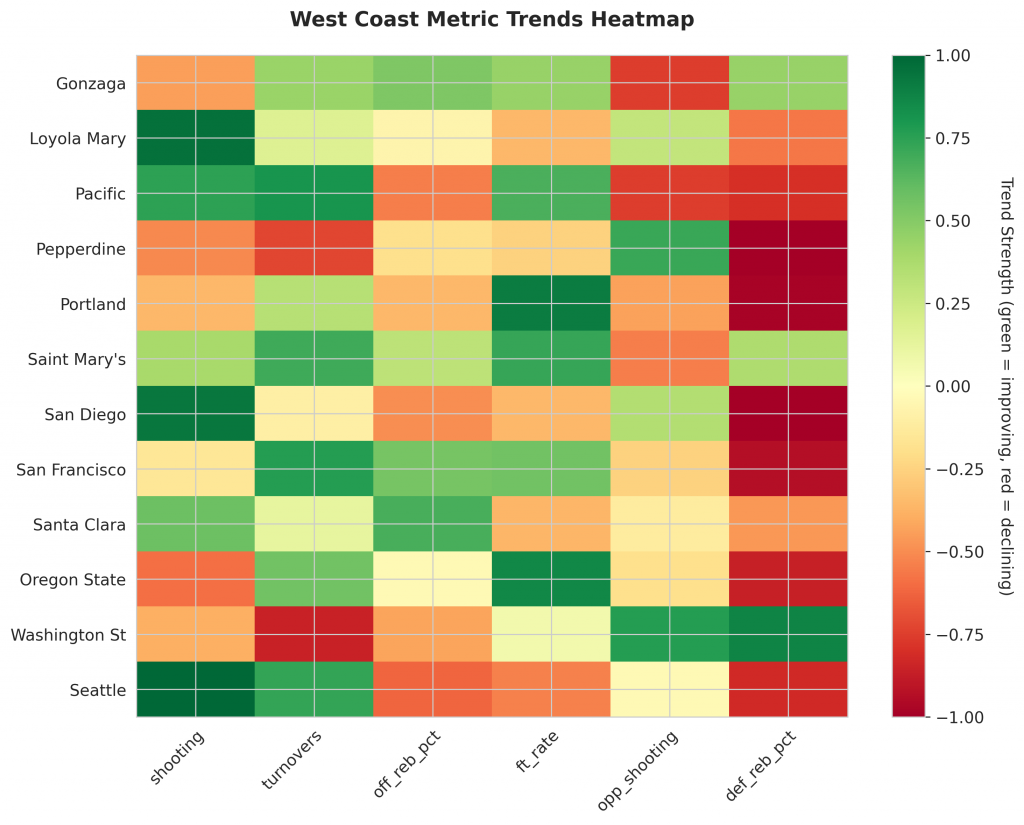
Figure 4: MACD trends heatmap showing which metrics are improving (green) or declining (red) for each team. Stronger colors indicate more pronounced trends.
Looking Ahead
As West Coast teams continue their season, the MACD trending indicators will help identify which teams are genuinely improving versus those riding unsustainable momentum. Check back next week for updated analysis.
Metrics Glossary
Four Factors (Dean Oliver’s framework for basketball success):
- eFG% (Effective Field Goal %): Field goal percentage adjusted for 3-pointers being worth more (FGM + 0.5×3PM) / FGA. Higher is better offensively, lower is better defensively.
- TOV% (Turnover Rate): Turnovers per 100 possessions. Lower is better offensively (taking care of the ball), higher is better defensively (forcing turnovers).
- OREB% / DREB% (Offensive/Defensive Rebound Rate): Percentage of available rebounds grabbed. Offensive rebounds create second-chance points; defensive rebounds end opponent possessions.
- FTR (Free Throw Rate): Free throws made per field goal attempt (FTM/FGA). Measures ability to get to the line AND convert. Higher is better offensively, lower is better defensively.
Other Metrics:
- Elo Rating: Chess-style rating system that updates based on game results and opponent strength. Higher Elo indicates stronger team.
- Efficiency Margin: Point differential per 100 possessions (Offensive Efficiency – Defensive Efficiency). Accounts for pace of play.
- MACD (Moving Average Convergence Divergence): Trend indicator comparing 12-game and 26-game exponential moving averages. Positive MACD = improving trend, Negative MACD = declining trend.
Analysis powered by HoopSci’s advanced metrics and MACD trending indicators.