Southern Update: Week 4
December 1, 2025The Southern enters Week 4 with teams showing diverse trending patterns. This analysis examines each team’s performance trends using MACD (Moving Average Convergence Divergence) indicators to identify not just where teams stand, but where they’re headed.
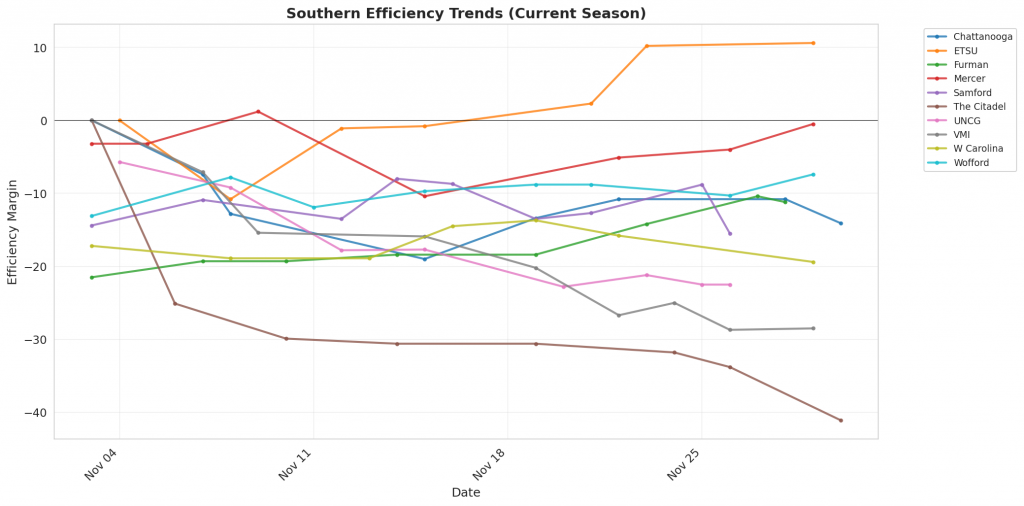
Figure 1: Efficiency margin trends for Southern teams throughout the season. Teams trending upward show improving performance, while downward trends indicate struggles.
Conference Snapshot
- Week Dates: November 24 – November 30, 2025
- Trending Up (Efficiency): ETSU, Furman, Mercer, W Carolina
- Trending Down (Efficiency): Chattanooga, Samford, The Citadel, UNCG, VMI
Team-by-Team Analysis
Chattanooga
Record: 4-4 | Elo: 1607.9 (ranked 59 of 365) | Efficiency Margin: -14.11 (ranked 273 of 365)
Offensive Trends:
- Off Reb Pct (Offensive Rebounding): Currently ranked 225 of 365 in D1. Trending up strongly 🟢.
- FG Pct (Field Goal Percentage (FGM/FGA)): Currently ranked 215 of 365 in D1. Trending down strongly 🔴.
Defensive Trends:
- Opp FTM Per Poss (Opp Free Throw Makes Per Possession (%)): Currently ranked 330 of 365 in D1. Trending up strongly 🔴.
- Opp FT Rate (Opp FTA/FGA (%)): Currently ranked 298 of 365 in D1. Trending up moderately 🔴.
ETSU
Record: 6-1 | Elo: 1548.7 (ranked 114 of 365) | Efficiency Margin: +10.64 (ranked 89 of 365)
Offensive Trends:
- Shooting (Shooting): Currently ranked 60 of 365 in D1. Trending up strongly 🟢.
- Off Reb Pct (Offensive Rebounding): Currently ranked 301 of 365 in D1. Trending down strongly 🔴.
Defensive Trends:
- Opp Shooting (Opp Shooting): Currently ranked 46 of 365 in D1. Trending down strongly 🟢.
- Def Reb Pct (Defensive Rebounding): Currently ranked 126 of 365 in D1. Trending up strongly 🟢.
Furman
Record: 4-4 | Elo: 1558.4 (ranked 105 of 365) | Efficiency Margin: -11.17 (ranked 252 of 365)
Offensive Trends:
- Off Reb Pct (Offensive Rebounding): Currently ranked 35 of 365 in D1. Trending up strongly 🟢.
- FT Rate (FTA/FGA (%)): Currently ranked 325 of 365 in D1. Trending down strongly 🔴.
Defensive Trends:
- Opp 2Pt Rate (Opp 2 Point Attempts/FGA (%)): Currently ranked 125 of 365 in D1. Trending down strongly 🟢.
- Opp 2PA Per Poss (Opp 2 Point Attempts Per Possession (%)): Currently ranked 211 of 365 in D1. Trending down strongly 🟢.
Mercer
Record: 5-2 | Elo: 1493.7 (ranked 192 of 365) | Efficiency Margin: -0.48 (ranked 168 of 365)
Offensive Trends:
- Shooting (Shooting): Currently ranked 165 of 365 in D1. Trending up strongly 🟢.
- FT Rate (FTA/FGA (%)): Currently ranked 196 of 365 in D1. Trending up strongly 🟢.
Defensive Trends:
- Def Reb Pct (Defensive Rebounding): Currently ranked 352 of 365 in D1. Trending down strongly 🔴.
- Opp FGM Per Poss (Opp FG Makes Per Possession (%)): Currently ranked 317 of 365 in D1. Trending up strongly 🔴.
Samford
Record: 4-5 | Elo: 1563.7 (ranked 99 of 365) | Efficiency Margin: -15.49 (ranked 285 of 365)
Offensive Trends:
- Shooting (Shooting): Currently ranked 303 of 365 in D1. Trending down strongly 🔴.
- Turnovers (Turnovers): Currently ranked 27 of 365 in D1. Trending down strongly 🟢.
Defensive Trends:
- Opp Turnovers (Opp Turnovers): Currently ranked 312 of 365 in D1. Trending down strongly 🟢.
- Opp FT Rate (Opp FTA/FGA (%)): Currently ranked 81 of 365 in D1. Trending down strongly 🟢.
The Citadel
Record: 2-6 | Elo: 1268.6 (ranked 365 of 365) | Efficiency Margin: -41.11 (ranked 365 of 365)
Offensive Trends:
- Off Reb Pct (Offensive Rebounding): Currently ranked 43 of 365 in D1. Trending up strongly 🟢.
- FGA Per Poss (Field Goal Attempts Per Possession (%)): Currently ranked 22 of 365 in D1. Trending up strongly 🟢.
Defensive Trends:
- Opp Shooting (Opp Shooting): Currently ranked 355 of 365 in D1. Trending up strongly 🔴.
- Opp FGM Per Poss (Opp FG Makes Per Possession (%)): Currently ranked 363 of 365 in D1. Trending up strongly 🔴.
UNCG
Record: 1-7 | Elo: 1488.7 (ranked 201 of 365) | Efficiency Margin: -22.53 (ranked 336 of 365)
Offensive Trends:
- Shooting (Shooting): Currently ranked 306 of 365 in D1. Trending down strongly 🔴.
- Turnovers (Turnovers): Currently ranked 227 of 365 in D1. Trending up strongly 🔴.
Defensive Trends:
- Opp Shooting (Opp Shooting): Currently ranked 313 of 365 in D1. Trending up strongly 🔴.
- Opp Turnovers (Opp Turnovers): Currently ranked 356 of 365 in D1. Trending down strongly 🟢.
VMI
Record: 2-7 | Elo: 1364.6 (ranked 344 of 365) | Efficiency Margin: -28.51 (ranked 352 of 365)
Offensive Trends:
- Shooting (Shooting): Currently ranked 337 of 365 in D1. Trending down strongly 🔴.
- Adj Off Eff (Adjusted Offensive Efficiency): Currently ranked 332 of 365 in D1. Trending down strongly 🔴.
Defensive Trends:
- Def Reb Pct (Defensive Rebounding): Currently ranked 355 of 365 in D1. Trending down strongly 🔴.
- Opp FGM Per Poss (Opp FG Makes Per Possession (%)): Currently ranked 353 of 365 in D1. Trending up strongly 🔴.
W Carolina
Record: 3-4 | Elo: 1433.5 (ranked 273 of 365) | Efficiency Margin: -19.40 (ranked 316 of 365)
Offensive Trends:
- Shooting (Shooting): Currently ranked 269 of 365 in D1. Trending up strongly 🟢.
- Turnovers (Turnovers): Currently ranked 334 of 365 in D1. Trending up strongly 🔴.
Defensive Trends:
- Opp Shooting (Opp Shooting): Currently ranked 333 of 365 in D1. Trending up strongly 🔴.
- Opp FGM Per Poss (Opp FG Makes Per Possession (%)): Currently ranked 279 of 365 in D1. Trending up strongly 🔴.
Wofford
Record: 5-3 | Elo: 1543.8 (ranked 116 of 365) | Efficiency Margin: -7.42 (ranked 222 of 365)
Offensive Trends:
- Off Reb Pct (Offensive Rebounding): Currently ranked 134 of 365 in D1. Trending up strongly 🟢.
- FT Rate (FTA/FGA (%)): Currently ranked 59 of 365 in D1. Trending up strongly 🟢.
Defensive Trends:
- Def Reb Pct (Defensive Rebounding): Currently ranked 167 of 365 in D1. Trending down strongly 🔴.
- Opp FGM Per Poss (Opp FG Makes Per Possession (%)): Currently ranked 312 of 365 in D1. Trending up strongly 🔴.
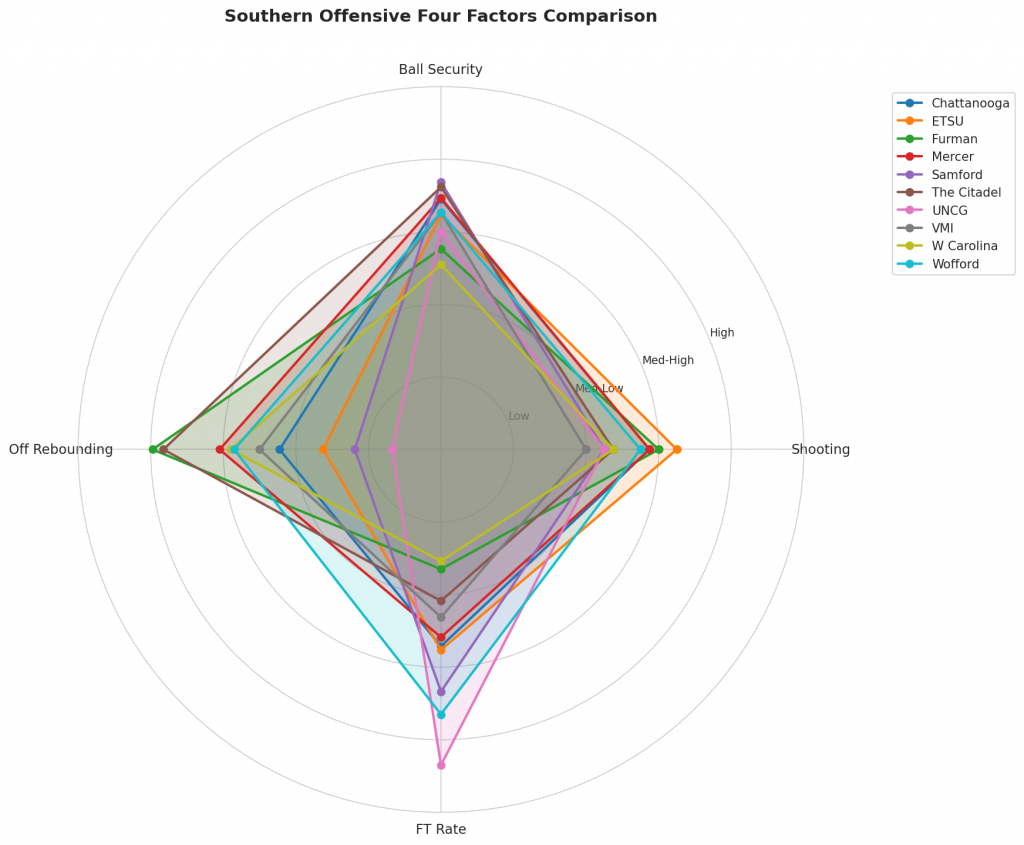
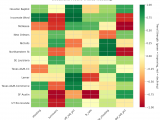
Figure 2: Offensive Four Factors comparison across Southern teams. The radar chart shows each team’s shooting efficiency (eFG%), ball security (TOV%), offensive rebounding (OREB%), and free throw generation (FT Rate).
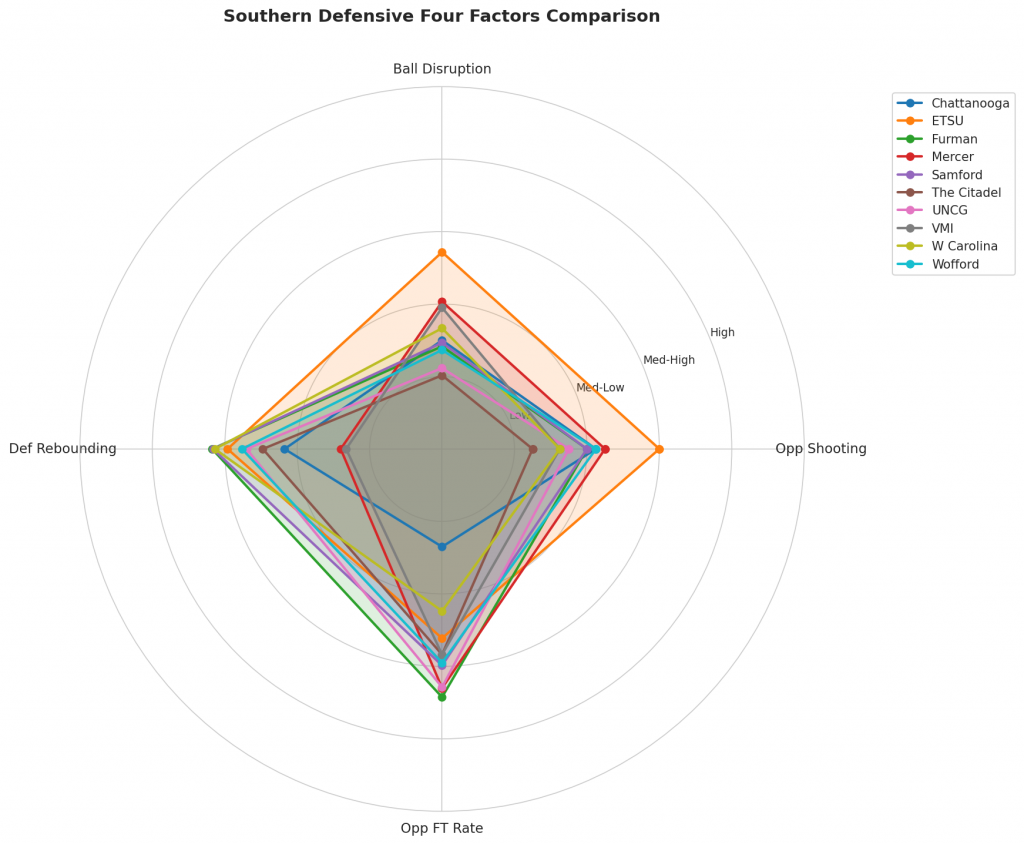
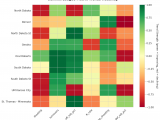
Figure 3: Defensive Four Factors comparison across Southern teams. The radar chart shows each team’s opponent shooting defense (Opp eFG%), ball disruption (forcing TOV%), defensive rebounding (DREB%), and opponent free throw prevention (Opp FT Rate).

Figure 4: MACD trends heatmap showing which metrics are improving (green) or declining (red) for each team. Stronger colors indicate more pronounced trends.
Looking Ahead
As Southern teams continue their season, the MACD trending indicators will help identify which teams are genuinely improving versus those riding unsustainable momentum. Check back next week for updated analysis.
Metrics Glossary
Four Factors (Dean Oliver’s framework for basketball success):
- eFG% (Effective Field Goal %): Field goal percentage adjusted for 3-pointers being worth more (FGM + 0.5×3PM) / FGA. Higher is better offensively, lower is better defensively.
- TOV% (Turnover Rate): Turnovers per 100 possessions. Lower is better offensively (taking care of the ball), higher is better defensively (forcing turnovers).
- OREB% / DREB% (Offensive/Defensive Rebound Rate): Percentage of available rebounds grabbed. Offensive rebounds create second-chance points; defensive rebounds end opponent possessions.
- FTR (Free Throw Rate): Free throws made per field goal attempt (FTM/FGA). Measures ability to get to the line AND convert. Higher is better offensively, lower is better defensively.
Other Metrics:
- Elo Rating: Chess-style rating system that updates based on game results and opponent strength. Higher Elo indicates stronger team.
- Efficiency Margin: Point differential per 100 possessions (Offensive Efficiency – Defensive Efficiency). Accounts for pace of play.
- MACD (Moving Average Convergence Divergence): Trend indicator comparing 12-game and 26-game exponential moving averages. Positive MACD = improving trend, Negative MACD = declining trend.
Analysis powered by HoopSci’s advanced metrics and MACD trending indicators.