Week 4: 2026’s Biggest Bullies
December 1, 2025College basketball efficiency rankings can be misleading. Some teams inflate their numbers by demolishing weaker opponents far beyond what statistical models predict, while simultaneously failing to meet expectations against quality competition.
This weekly feature identifies the biggest “bullies” in Division I basketball: teams whose efficiency metrics are artificially elevated by their performance against inferior opponents.
The rankings below count from #1 (biggest bully) to #25, highlighting teams that excel at padding stats against overmatched opponents while struggling to meet expectations against quality competition.
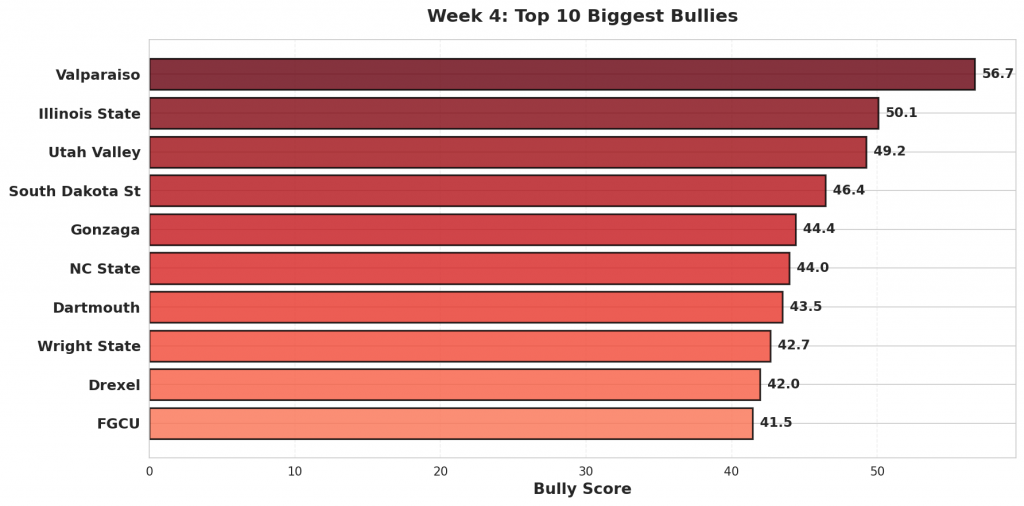
Figure 1: Top 10 teams with the highest bully scores in Week 4. Bully scores reflect the combination of overperformance against weak opponents and underperformance against quality competition.
#1: Valparaiso (5-2)
#165 Valparaiso was projected to beat #254 Western Michigan by 2. They won comfortably 84-55, 27 points better than projected. Against #7 Kentucky, Valparaiso lost 107-59. They were projected to lose by 19.
Bully Metrics: Exceeded projections by 27.3 total points against weak opponents (1 games); underperformed by 29.4 points against quality competition (1 games).
#2: Illinois State (6-2)
Against #246 Coastal Carolina, #91 Illinois State rolled to a 52-point win, 94-42. The model had them winning by 11; the actual margin was 52, outpacing the projection by 41. Facing #45 USC, Illinois State came up short, losing 87-67 after being projected to lose by 2.
Bully Metrics: Exceeded projections by 40.9 total points against weak opponents (1 games); underperformed by 18.4 points against quality competition (2 games).
#3: Utah Valley (5-2)
#67 Utah Valley faced #279 Samford as 4-point favorites and won handily 89-45, 40 points above the spread. Utah Valley fell to #115 Boise State 101-77, missing the 4-point projection by 20.
Bully Metrics: Exceeded projections by 40.2 total points against weak opponents (1 games); underperformed by 36.3 points against quality competition (4 games).
#4: South Dakota St (4-4)
Expected to win by 10 over #336 Georgia State, #144 South Dakota St coasted to a 105-58 win—beating the line by 38. The model had South Dakota St losing by 4 against #67 Utah Valley. Instead, they lost 75-52.
Bully Metrics: Exceeded projections by 37.5 total points against weak opponents (1 games); underperformed by 35.7 points against quality competition (4 games).
#5: Gonzaga (7-1)
#4 Gonzaga cruised to a 122-50 victory against #350 Southern Utah. Favored by 27, the 72-point margin was +45 versus projection. Against #2 Michigan, Gonzaga lost 101-61. They were projected to lose by 1.
Bully Metrics: Exceeded projections by 73.2 total points against weak opponents (2 games); underperformed by 46.8 points against quality competition (6 games).
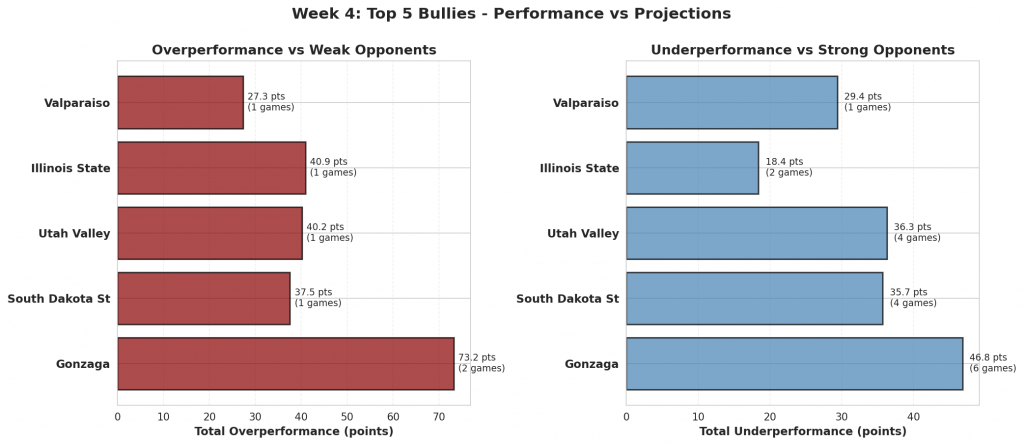
Figure 2: Performance comparison for the top 5 biggest bullies. Red bars show total overperformance against weak opponents; blue bars show total underperformance against strong opponents.
#6: NC State (5-2)
The model gave #22 NC State a 1-point edge over #333 UNC Greensboro. They rolled to a 46-point win, 110-64, finishing 45 beyond the expected margin. Facing #34 Seton Hall, NC State came up short, losing 85-74 after being projected to win by 6.
Bully Metrics: Exceeded projections by 80.9 total points against weak opponents (2 games); underperformed by 17.5 points against quality competition (5 games).
#7: Dartmouth (2-3)
#244 Dartmouth handled #326 Saint Peter’s, winning 87-61. That 26-point margin was a 24-point swing from the projection. Dartmouth fell to #80 Marist 75-56, missing the 0-point projection by 19.
Bully Metrics: Exceeded projections by 24.4 total points against weak opponents (1 games); underperformed by 19.1 points against quality competition (1 games).
#8: Wright State (4-4)
#158 Wright State defeated #271 Radford 92-59 on a neutral court on November 15. The model had Wright State losing by 5 against #33 Butler. Instead, they lost 94-69.
Bully Metrics: Exceeded projections by 33.0 total points against weak opponents (1 games); underperformed by 38.7 points against quality competition (4 games).
#9: Drexel (4-4)
#228 Drexel was projected to beat #323 NJIT by 11. They cruised to a 75-43 victory, 21 points better than projected. Against #63 Syracuse, Drexel lost 80-50. They were projected to lose by 2.
Bully Metrics: Exceeded projections by 21.4 total points against weak opponents (1 games); underperformed by 61.6 points against quality competition (3 games).
#10: FGCU (5-3)
Against #235 Rice, #192 FGCU secured a 15-point victory, 78-63. The model had them winning by 2; the actual margin was 15, outpacing the projection by 13. Facing #35 Illinois, FGCU came up short, losing 113-70 after being projected to lose by 14.
Bully Metrics: Exceeded projections by 12.9 total points against weak opponents (1 games); underperformed by 28.5 points against quality competition (1 games).
#11: North Texas (6-2)
#154 North Texas faced #342 Northwestern State as 13-point favorites and controlled the game en route to a 80-53 victory, 14 points above the spread. North Texas fell to #18 Saint Mary’s 80-49, missing the 4-point projection by 27.
Bully Metrics: Exceeded projections by 14.3 total points against weak opponents (1 games); underperformed by 26.6 points against quality competition (1 games).
#12: Penn State (7-1)
Expected to win by 6 over #324 New Haven, #86 Penn State coasted to a 87-43 win—beating the line by 38. The model had Penn State winning by 4 against #78 Providence. Instead, they lost 77-65.
Bully Metrics: Exceeded projections by 58.9 total points against weak opponents (2 games); underperformed by 22.7 points against quality competition (2 games).
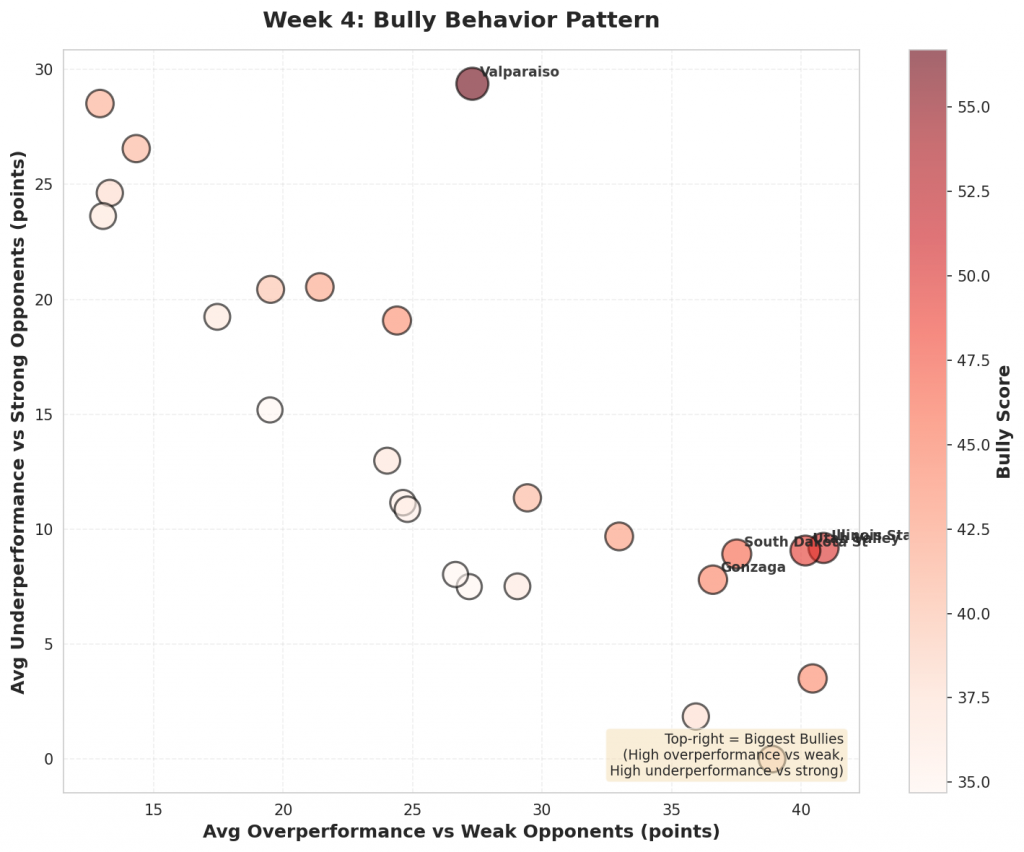
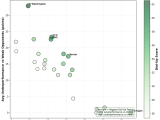
Figure 3: Scatter plot showing the relationship between overperformance against weak opponents (x-axis) and underperformance against strong opponents (y-axis). Bubble size and color indicate bully score magnitude. Top-right quadrant represents the biggest bullies.
#13: C. Carolina (5-3)
#246 C. Carolina won comfortably 84-64 against #345 Western Illinois. Favored by 0, the 20-point margin was +20 versus projection. Against #91 Illinois State, C. Carolina lost 94-42. They were projected to lose by 11.
Bully Metrics: Exceeded projections by 19.5 total points against weak opponents (1 games); underperformed by 40.9 points against quality competition (2 games).
#14: Miami (6-2)
The model gave #32 Miami a 8-point edge over #363 Delaware State. They rolled to a 56-point win, 97-41, finishing 48 beyond the expected margin. To their credit, Miami met expectations against stronger #25 Florida, suggesting they may simply be that good rather than inflating numbers against weak competition.
Bully Metrics: Exceeded projections by 116.6 total points against weak opponents (3 games); underperformed by 0.0 points against quality competition (4 games).
#15: LA Tech (4-2)
#191 LA Tech handled #310 Alcorn State, winning 83-58. That 25-point margin was a 13-point swing from the projection. LA Tech fell to #142 Nevada 77-50, missing the 2-point projection by 25.
Bully Metrics: Exceeded projections by 13.3 total points against weak opponents (1 games); underperformed by 24.6 points against quality competition (1 games).
#16: Wyoming (6-2)
Facing #284 Denver, #88 Wyoming coasted to a 101-59 win. With a projected spread of 4, the result was 38 points past expectations. The model had Wyoming losing by 2 against #125 Sam Houston. Instead, they lost 78-70.
Bully Metrics: Exceeded projections by 71.9 total points against weak opponents (2 games); underperformed by 5.6 points against quality competition (3 games).
#17: Marquette (4-4)
#92 Marquette was projected to beat #304 Little Rock by 16. They cruised to a 89-49 victory, 24 points better than projected. Against #16 Indiana, Marquette lost 100-77. They were projected to win by 6.
Bully Metrics: Exceeded projections by 24.0 total points against weak opponents (1 games); underperformed by 51.9 points against quality competition (4 games).
#18: High Point (7-1)
Against #243 Furman, #51 High Point pulled away for a 97-71 win. The model had them winning by 5; the actual margin was 26, outpacing the projection by 21. Facing #122 UAB, High Point came up short, losing 91-74 after being projected to win by 2.
Bully Metrics: Exceeded projections by 52.4 total points against weak opponents (3 games); underperformed by 19.2 points against quality competition (1 games).
#19: Texas State (6-4)
#240 Texas State faced #312 Abilene Christian as 1-point favorites and came away with a 63-49 win, 13 points above the spread. Texas State fell to #84 Bowling Green 83-48, missing the 2-point projection by 37.
Bully Metrics: Exceeded projections by 13.0 total points against weak opponents (1 games); underperformed by 47.2 points against quality competition (2 games).
#20: Old Dominion (3-6)
Expected to win by 3 over #329 Morgan State, #227 Old Dominion coasted to a 88-56 win—beating the line by 29. The model had Old Dominion losing by 10 against #61 George Washington. Instead, they lost 96-73.
Bully Metrics: Exceeded projections by 29.0 total points against weak opponents (1 games); underperformed by 37.6 points against quality competition (5 games).
#21: Nevada (5-3)
#142 Nevada won comfortably 77-50 against #191 Louisiana Tech. Favored by 2, the 27-point margin was +25 versus projection. Against #85 Washington, Nevada lost 83-66. They were projected to win by 6.
Bully Metrics: Exceeded projections by 24.6 total points against weak opponents (1 games); underperformed by 66.9 points against quality competition (6 games).
#22: American (5-4)
The model gave #230 American a 1-point edge over #303 Longwood. They pulled away for a 92-66 win, finishing 25 beyond the expected margin. Facing #61 George Washington, American came up short, losing 107-67 after being projected to lose by 3.
Bully Metrics: Exceeded projections by 24.8 total points against weak opponents (1 games); underperformed by 54.3 points against quality competition (5 games).
#23: Northwestern (5-2)
#31 Northwestern handled #274 Cleveland State, winning 110-63. That 47-point margin was a 43-point swing from the projection. Northwestern fell to #74 Oklahoma State 86-81, missing the 6-point projection by 11.
Bully Metrics: Exceeded projections by 54.4 total points against weak opponents (2 games); underperformed by 30.0 points against quality competition (4 games).
#24: Minnesota (4-4)
Facing #310 Alcorn State, #137 Minnesota coasted to a 95-50 win. With a projected spread of 10, the result was 35 points past expectations. The model had Minnesota losing by 8 against #37 Missouri. Instead, they lost 83-60.
Bully Metrics: Exceeded projections by 53.3 total points against weak opponents (2 games); underperformed by 32.1 points against quality competition (4 games).
#25: DePaul (5-3)
#123 DePaul was projected to beat #361 Gardner-Webb by 7. They cruised to a 93-62 victory, 24 points better than projected. Against #107 Buffalo, DePaul lost 66-53. They were projected to win by 12.
Bully Metrics: Exceeded projections by 39.0 total points against weak opponents (2 games); underperformed by 45.6 points against quality competition (3 games).
What This Means
These rankings highlight teams whose efficiency numbers may not tell the full story. While crushing inferior opponents is expected, doing so far beyond statistical projections while simultaneously underperforming against quality teams suggests inflated metrics.
Actionable Advice
- Safe Bets vs Weak Teams: These teams are “flat-track bullies”—they don’t let up. They are often safe bets to cover large spreads against inferior competition because they play hard for 40 minutes regardless of the score.
- Fade vs Strong Teams: Be extremely careful backing these teams against quality opponents. Their efficiency metrics are artificially inflated by their bully behavior, often leading to them being overvalued favorites against teams that can actually punch back.
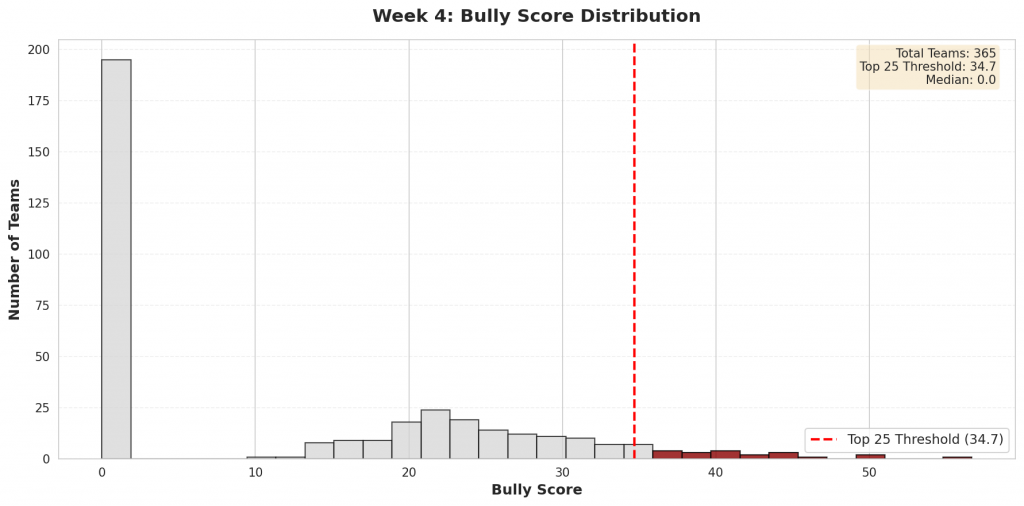
Figure 4: Distribution of bully scores across all Division I teams. The top 25 bullies (highlighted in red) represent teams whose efficiency metrics are most inflated by their performance patterns.
Check back next week for updated bully rankings.