America East Update: Week 6
December 15, 2025The America East enters Week 6 with teams showing diverse trending patterns. This analysis examines each team’s performance trends using MACD (Moving Average Convergence Divergence) indicators to identify not just where teams stand, but where they’re headed.
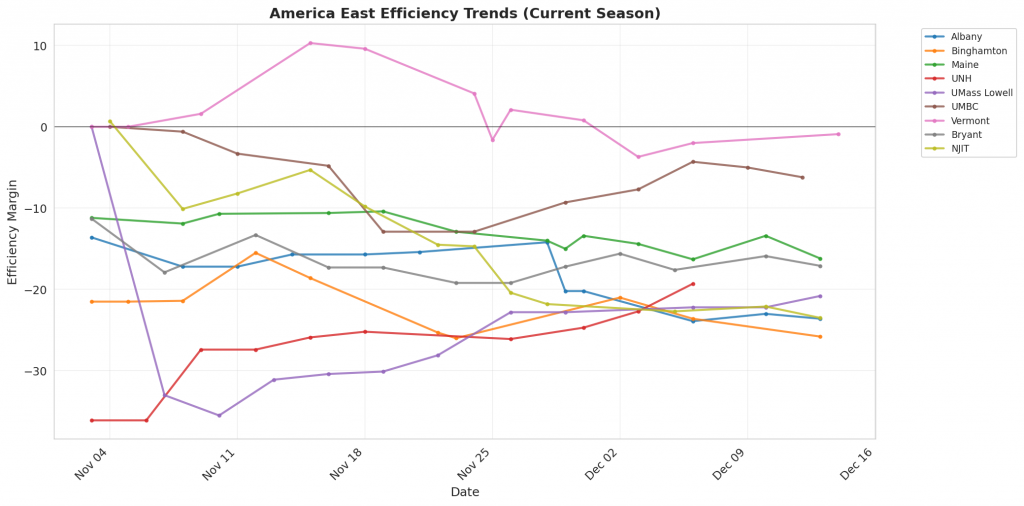
Figure 1: Efficiency margin trends for America East teams throughout the season. Teams trending upward show improving performance, while downward trends indicate struggles.
Conference Snapshot
- Week Dates: December 08 – December 14, 2025
- Trending Up (Efficiency): Albany, UMass Lowell, Bryant
- Trending Down (Efficiency): Binghamton, Maine, UNH, UMBC, Vermont
Team-by-Team Analysis
Albany
Record: 3-9 | Elo: 1406.6 (ranked 304 of 365) | Efficiency Margin: -23.65 (ranked 336 of 365)
Offensive Trends:
- Adj Off Eff (Adjusted Offensive Efficiency): Currently ranked 303 of 365 in D1. Trending down strongly 🔴.
- FT Pct (FTM/FTA (%)): Currently ranked 355 of 365 in D1. Trending down strongly 🔴.
Defensive Trends:
- Opp Shooting (Opp Shooting): Currently ranked 316 of 365 in D1. Trending up strongly 🔴.
- Opp Turnovers (Opp Turnovers): Currently ranked 221 of 365 in D1. Trending down strongly 🟢.
Binghamton
Record: 2-8 | Elo: 1391.3 (ranked 320 of 365) | Efficiency Margin: -25.76 (ranked 345 of 365)
Offensive Trends:
- FT Rate (FTA/FGA (%)): Currently ranked 13 of 365 in D1. Trending up strongly 🟢.
- FGM Per Poss (Field Goal Makes Per Possession (%)): Currently ranked 359 of 365 in D1. Trending down strongly 🔴.
Defensive Trends:
- Opp Shooting (Opp Shooting): Currently ranked 291 of 365 in D1. Trending up strongly 🔴.
- Opp FGM Per Poss (Opp FG Makes Per Possession (%)): Currently ranked 350 of 365 in D1. Trending up strongly 🔴.
Bryant
Record: 3-9 | Elo: 1500.1 (ranked 187 of 365) | Efficiency Margin: -17.08 (ranked 297 of 365)
Offensive Trends:
- Turnovers (Turnovers): Currently ranked 348 of 365 in D1. Trending up strongly 🔴.
- Off Reb Pct (Offensive Rebounding): Currently ranked 336 of 365 in D1. Trending down strongly 🔴.
Defensive Trends:
- Opp Shooting (Opp Shooting): Currently ranked 147 of 365 in D1. Trending up strongly 🔴.
- Opp FGM Per Poss (Opp FG Makes Per Possession (%)): Currently ranked 292 of 365 in D1. Trending up strongly 🔴.
Maine
Record: 1-12 | Elo: 1420.8 (ranked 289 of 365) | Efficiency Margin: -16.22 (ranked 292 of 365)
Offensive Trends:
- Turnovers (Turnovers): Currently ranked 363 of 365 in D1. Trending up strongly 🔴.
- Adj Off Eff (Adjusted Offensive Efficiency): Currently ranked 345 of 365 in D1. Trending down strongly 🔴.
Defensive Trends:
- Def Reb Pct (Defensive Rebounding): Currently ranked 333 of 365 in D1. Trending down strongly 🔴.
- Opp 2Pt Rate (Opp 2 Point Attempts/FGA (%)): Currently ranked 240 of 365 in D1. Trending down strongly 🟢.
NJIT
Record: 4-8 | Elo: 1354.5 (ranked 351 of 365) | Efficiency Margin: -23.50 (ranked 334 of 365)
Offensive Trends:
- Turnovers (Turnovers): Currently ranked 329 of 365 in D1. Trending up strongly 🔴.
- Off Reb Pct (Offensive Rebounding): Currently ranked 327 of 365 in D1. Trending down strongly 🔴.
Defensive Trends:
- Opp FT Rate (Opp FTA/FGA (%)): Currently ranked 153 of 365 in D1. Trending down strongly 🟢.
- Opp FGA Per Poss (Opp FG Attempts Per Possession (%)): Currently ranked 355 of 365 in D1. Trending up strongly 🔴.
UMBC
Record: 6-5 | Elo: 1416.8 (ranked 296 of 365) | Efficiency Margin: -6.21 (ranked 216 of 365)
Offensive Trends:
- Off Reb Pct (Offensive Rebounding): Currently ranked 307 of 365 in D1. Trending up strongly 🟢.
- FT Rate (FTA/FGA (%)): Currently ranked 304 of 365 in D1. Trending down strongly 🔴.
Defensive Trends:
- Opp Turnovers (Opp Turnovers): Currently ranked 324 of 365 in D1. Trending down strongly 🟢.
- Opp FT Pct (Opp FTM/FTA (%)): Currently ranked 297 of 365 in D1. Trending up strongly 🔴.
UMass Lowell
Record: 4-8 | Elo: 1453.6 (ranked 253 of 365) | Efficiency Margin: -20.77 (ranked 319 of 365)
Offensive Trends:
- Off Reb Pct (Offensive Rebounding): Currently ranked 246 of 365 in D1. Trending up strongly 🟢.
- FT Rate (FTA/FGA (%)): Currently ranked 49 of 365 in D1. Trending up strongly 🟢.
Defensive Trends:
- Def Reb Pct (Defensive Rebounding): Currently ranked 347 of 365 in D1. Trending down strongly 🔴.
- Opp FTA Per Poss (Opp Free Throw Attempts Per Possession (%)): Currently ranked 125 of 365 in D1. Trending up strongly 🔴.
UNH
Record: 3-7 | Elo: 1384.0 (ranked 329 of 365) | Efficiency Margin: -19.34 (ranked 313 of 365)
Offensive Trends:
- 2Pt Rate (2 Point Attempts/FGA (%)): Currently ranked 181 of 365 in D1. Trending up strongly 🟢.
- 2PM Per Poss (2 Point Makes Per Possession (%)): Currently ranked 257 of 365 in D1. Trending up strongly 🟢.
Defensive Trends:
- Opp 2PM Per Poss (Opp 2 Point Makes Per Possession (%)): Currently ranked 261 of 365 in D1. Trending down strongly 🟢.
- Opp 2Pt Pct (Opp 2 Point FGM/FGA (%)): Currently ranked 212 of 365 in D1. Trending down strongly 🟢.
Vermont
Record: 7-5 | Elo: 1575.5 (ranked 92 of 365) | Efficiency Margin: -0.88 (ranked 177 of 365)
Offensive Trends:
- Adj Off Eff (Adjusted Offensive Efficiency): Currently ranked 84 of 365 in D1. Trending up strongly 🟢.
- 2Pt Rate (2 Point Attempts/FGA (%)): Currently ranked 315 of 365 in D1. Trending down strongly 🔴.
Defensive Trends:
- Opp FT Rate (Opp FTA/FGA (%)): Currently ranked 263 of 365 in D1. Trending up strongly 🔴.
- Opp 2Pt Rate (Opp 2 Point Attempts/FGA (%)): Currently ranked 81 of 365 in D1. Trending down strongly 🟢.
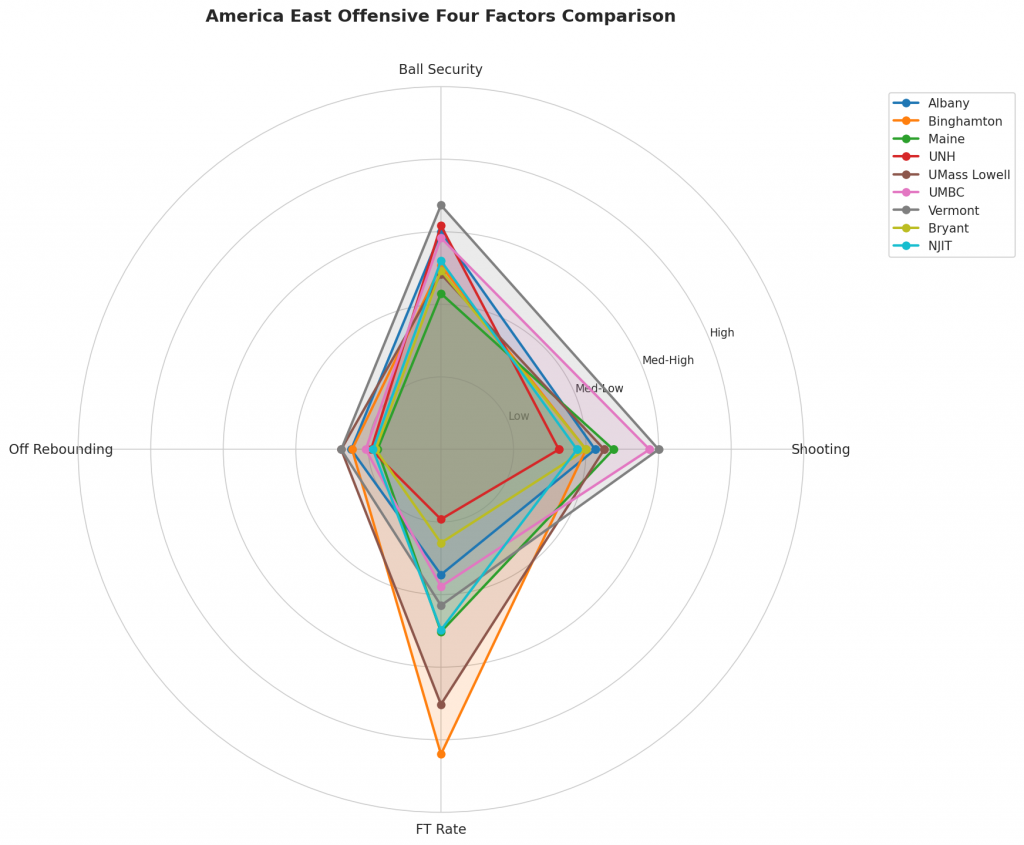
Figure 2: Offensive Four Factors comparison across America East teams. The radar chart shows each team’s shooting efficiency (eFG%), ball security (TOV%), offensive rebounding (OREB%), and free throw generation (FT Rate).
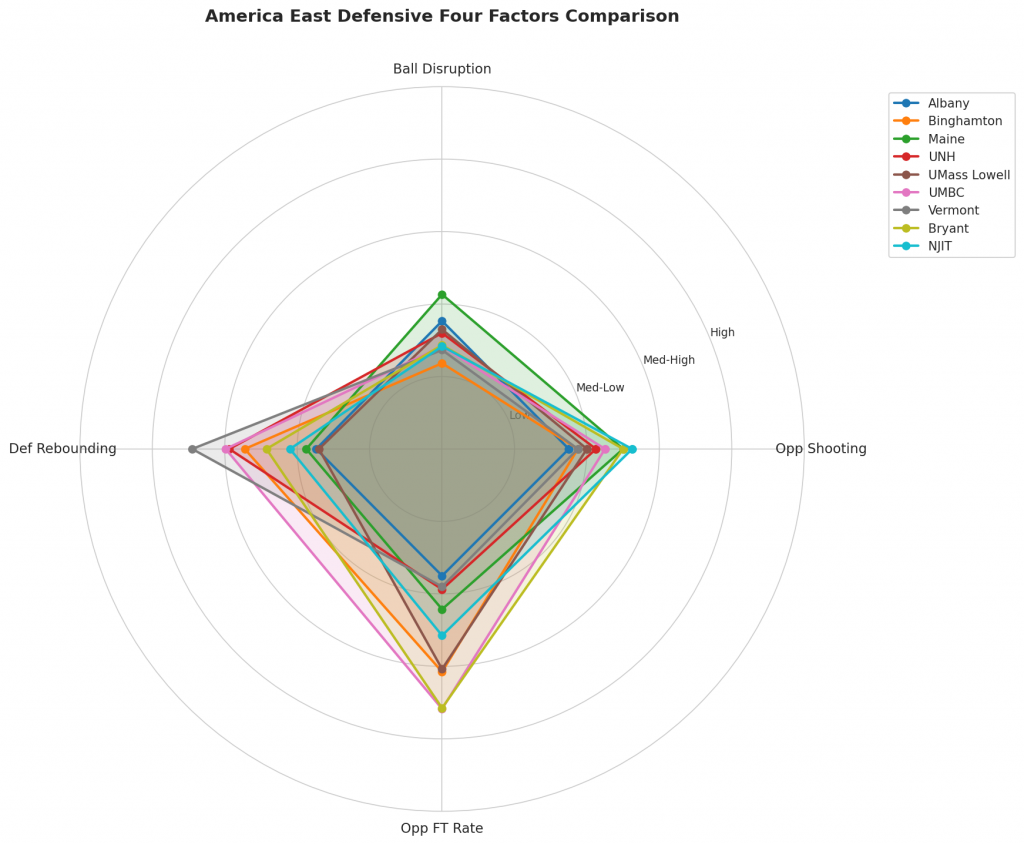
Figure 3: Defensive Four Factors comparison across America East teams. The radar chart shows each team’s opponent shooting defense (Opp eFG%), ball disruption (forcing TOV%), defensive rebounding (DREB%), and opponent free throw prevention (Opp FT Rate).
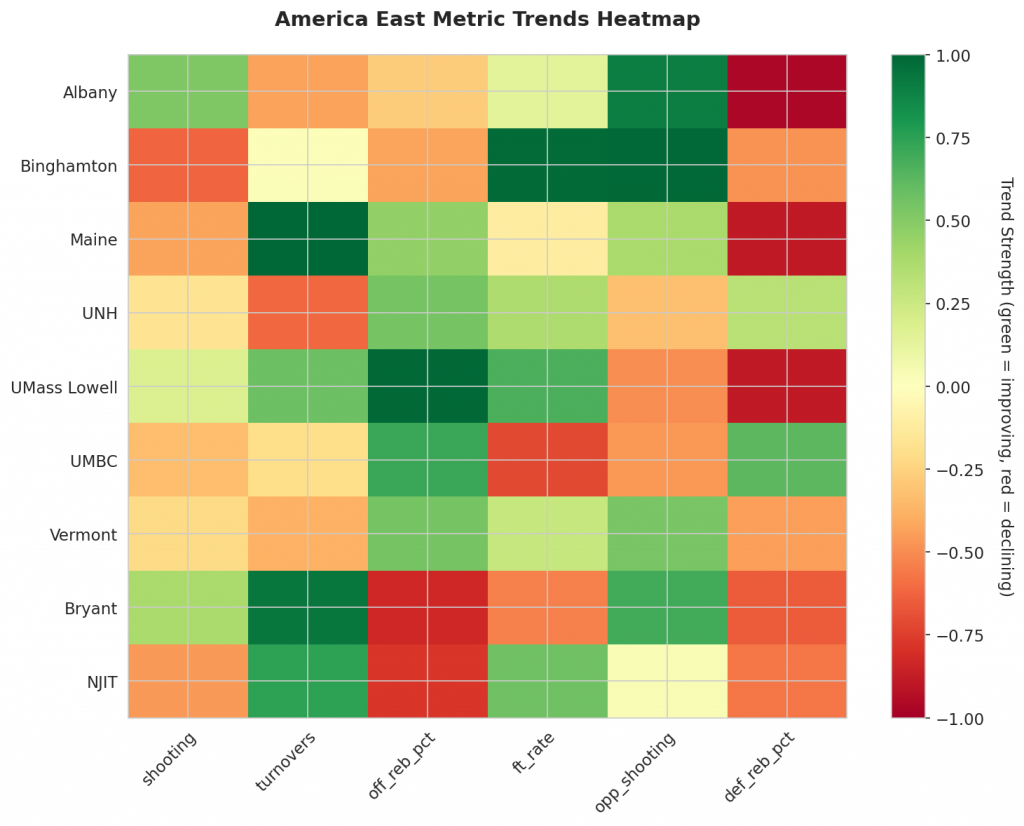
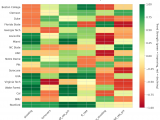
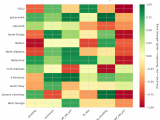
Figure 4: MACD trends heatmap showing which metrics are improving (green) or declining (red) for each team. Stronger colors indicate more pronounced trends.
Looking Ahead
As America East teams continue their season, the MACD trending indicators will help identify which teams are genuinely improving versus those riding unsustainable momentum. Check back next week for updated analysis.
Metrics Glossary
Four Factors (Dean Oliver’s framework for basketball success):
- eFG% (Effective Field Goal %): Field goal percentage adjusted for 3-pointers being worth more (FGM + 0.5×3PM) / FGA. Higher is better offensively, lower is better defensively.
- TOV% (Turnover Rate): Turnovers per 100 possessions. Lower is better offensively (taking care of the ball), higher is better defensively (forcing turnovers).
- OREB% / DREB% (Offensive/Defensive Rebound Rate): Percentage of available rebounds grabbed. Offensive rebounds create second-chance points; defensive rebounds end opponent possessions.
- FTR (Free Throw Rate): Free throws made per field goal attempt (FTM/FGA). Measures ability to get to the line AND convert. Higher is better offensively, lower is better defensively.
Other Metrics:
- Elo Rating: Chess-style rating system that updates based on game results and opponent strength. Higher Elo indicates stronger team.
- Efficiency Margin: Point differential per 100 possessions (Offensive Efficiency – Defensive Efficiency). Accounts for pace of play.
- MACD (Moving Average Convergence Divergence): Trend indicator comparing 12-game and 26-game exponential moving averages. Positive MACD = improving trend, Negative MACD = declining trend.
Analysis powered by HoopSci’s advanced metrics and MACD trending indicators.