Week 6: 2026’s Biggest Bullies
December 15, 2025College basketball efficiency rankings can be misleading. Some teams inflate their numbers by demolishing weaker opponents far beyond what statistical models predict, while simultaneously failing to meet expectations against quality competition.
This weekly feature identifies the biggest “bullies” in Division I basketball: teams whose efficiency metrics are artificially elevated by their performance against inferior opponents.
The rankings below count from #1 (biggest bully) to #25, highlighting teams that excel at padding stats against overmatched opponents while struggling to meet expectations against quality competition.
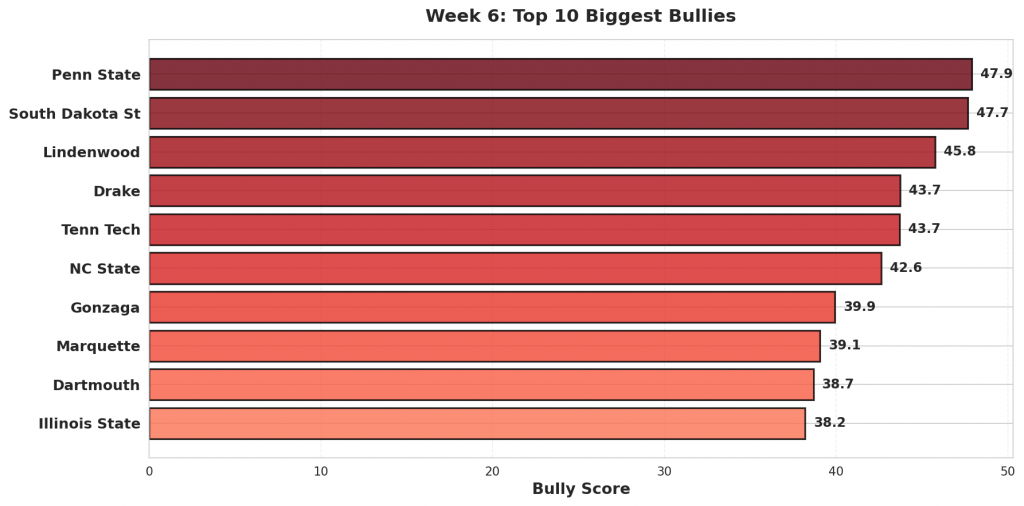
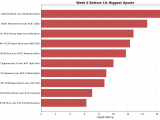
Figure 1: Top 10 teams with the highest bully scores in Week 6. Bully scores reflect the combination of overperformance against weak opponents and underperformance against quality competition.
#1: Penn State (8-3)
#109 Penn State was projected to beat #301 New Haven by 6. They cruised to a 87-43 victory, 38 points better than projected. Against #21 Indiana, Penn State lost 113-72. They were projected to lose by 1.
Bully Metrics: Exceeded projections by 58.9 total points against weak opponents (2 games); underperformed by 55.4 points against quality competition (3 games).
#2: South Dakota St (7-5)
Against #338 Georgia State, #137 South Dakota St rolled to a 47-point win, 105-58. The model had them winning by 10; the actual margin was 47, outpacing the projection by 38. Facing #84 Utah Valley, South Dakota St came up short, losing 75-52 after being projected to lose by 4.
Bully Metrics: Exceeded projections by 37.5 total points against weak opponents (1 games); underperformed by 50.7 points against quality competition (5 games).
#3: Lindenwood (6-4)
#247 Lindenwood faced #328 Northern Illinois as 3-point favorites and won handily 99-64, 32 points above the spread. Lindenwood fell to #39 Saint Louis 109-66, missing the 13-point projection by 30.
Bully Metrics: Exceeded projections by 31.9 total points against weak opponents (1 games); underperformed by 41.5 points against quality competition (3 games).
#4: Drake (6-5)
Expected to win by 22 over #357 Western Illinois, #122 Drake coasted to a 108-57 win—beating the line by 29. The model had Drake winning by 12 against #37 LSU. Instead, they lost 71-62.
Bully Metrics: Exceeded projections by 28.6 total points against weak opponents (1 games); underperformed by 60.7 points against quality competition (4 games).
#5: Tenn Tech (5-6)
#287 Tenn Tech won comfortably 87-59 against #286 West Georgia. Favored by 2, the 28-point margin was +26 versus projection. Against #15 Kentucky, Tenn Tech lost 104-54. They were projected to lose by 25.
Bully Metrics: Exceeded projections by 26.1 total points against weak opponents (1 games); underperformed by 52.7 points against quality competition (3 games).
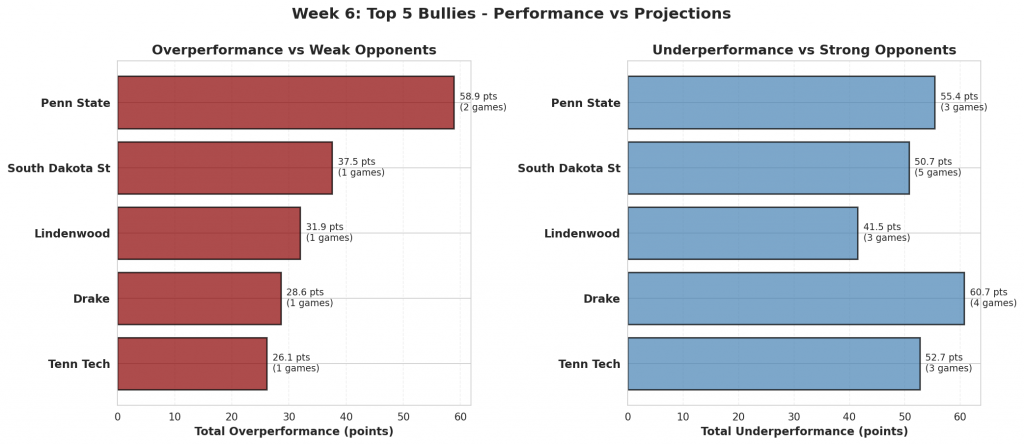
Figure 2: Performance comparison for the top 5 biggest bullies. Red bars show total overperformance against weak opponents; blue bars show total underperformance against strong opponents.
#6: NC State (7-4)
The model gave #28 NC State a 1-point edge over #317 UNC Greensboro. They rolled to a 46-point win, 110-64, finishing 45 beyond the expected margin. Facing #27 Seton Hall, NC State came up short, losing 85-74 after being projected to win by 6.
Bully Metrics: Exceeded projections by 80.9 total points against weak opponents (2 games); underperformed by 17.5 points against quality competition (8 games).
#7: Gonzaga (10-1)
#3 Gonzaga handled #352 Southern Utah, winning 122-50. That 72-point margin was a 45-point swing from the projection. Gonzaga fell to #1 Michigan 101-61, missing the 1-point projection by 39.
Bully Metrics: Exceeded projections by 102.3 total points against weak opponents (3 games); underperformed by 46.8 points against quality competition (8 games).
#8: Marquette (5-6)
Facing #344 Little Rock, #108 Marquette coasted to a 89-49 win. With a projected spread of 16, the result was 24 points past expectations. The model had Marquette winning by 6 against #21 Indiana. Instead, they lost 100-77.
Bully Metrics: Exceeded projections by 24.0 total points against weak opponents (1 games); underperformed by 105.4 points against quality competition (7 games).
#9: Dartmouth (4-5)
#242 Dartmouth was projected to beat #243 Saint Peter’s by 2. They won comfortably 87-61, 24 points better than projected. Against #93 Marist, Dartmouth lost 75-56. They were projected to win by 0.
Bully Metrics: Exceeded projections by 24.4 total points against weak opponents (1 games); underperformed by 42.8 points against quality competition (3 games).
#10: Illinois State (8-3)
Against #244 Coastal Carolina, #80 Illinois State rolled to a 52-point win, 94-42. The model had them winning by 11; the actual margin was 52, outpacing the projection by 41. Facing #46 USC, Illinois State came up short, losing 87-67 after being projected to lose by 2.
Bully Metrics: Exceeded projections by 64.1 total points against weak opponents (2 games); underperformed by 18.4 points against quality competition (3 games).
#11: Drexel (4-6)
#224 Drexel faced #336 NJIT as 11-point favorites and won handily 75-43, 21 points above the spread. Drexel fell to #77 Syracuse 80-50, missing the 2-point projection by 28.
Bully Metrics: Exceeded projections by 21.4 total points against weak opponents (1 games); underperformed by 66.7 points against quality competition (4 games).
#12: Kennesaw State (8-2)
Expected to win by 6 over #338 Georgia State, #183 Kennesaw State took care of business, winning 92-69—beating the line by 17. The model had Kennesaw State winning by 2 against #81 South Florida. Instead, they lost 108-89.
Bully Metrics: Exceeded projections by 17.2 total points against weak opponents (1 games); underperformed by 20.6 points against quality competition (1 games).
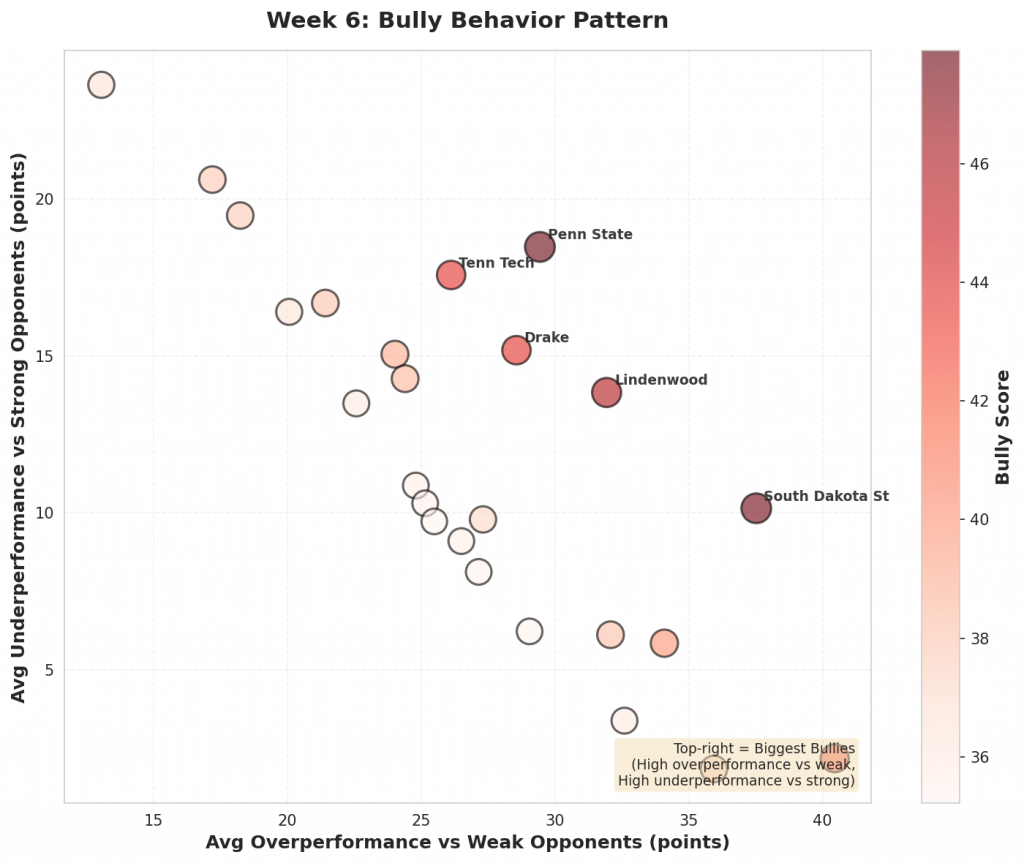
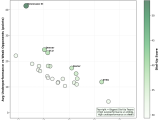
Figure 3: Scatter plot showing the relationship between overperformance against weak opponents (x-axis) and underperformance against strong opponents (y-axis). Bubble size and color indicate bully score magnitude. Top-right quadrant represents the biggest bullies.
#13: Wyoming (8-2)
#83 Wyoming cruised to a 101-59 victory against #306 Denver. Favored by 4, the 42-point margin was +38 versus projection. Against #123 Sam Houston, Wyoming lost 78-70. They were projected to lose by 2.
Bully Metrics: Exceeded projections by 71.9 total points against weak opponents (2 games); underperformed by 5.6 points against quality competition (3 games).
#14: Hampton (5-6)
The model gave #246 Hampton a 4-point edge over #332 Loyola Maryland. They pulled away for a 93-71 win, finishing 18 beyond the expected margin. Facing #17 Virginia, Hampton came up short, losing 91-53 after being projected to lose by 8.
Bully Metrics: Exceeded projections by 18.2 total points against weak opponents (1 games); underperformed by 38.9 points against quality competition (2 games).
#15: Valparaiso (6-4)
#168 Valparaiso handled #275 Western Michigan, winning 84-55. That 29-point margin was a 27-point swing from the projection. Valparaiso fell to #15 Kentucky 107-59, missing the 19-point projection by 29.
Bully Metrics: Exceeded projections by 27.3 total points against weak opponents (1 games); underperformed by 29.4 points against quality competition (3 games).
#16: Texas State (7-5)
Facing #253 Abilene Christian, #256 Texas State finished with a 63-49 victory. With a projected spread of 1, the result was 13 points past expectations. The model had Texas State winning by 2 against #85 Bowling Green. Instead, they lost 83-48.
Bully Metrics: Exceeded projections by 13.0 total points against weak opponents (1 games); underperformed by 47.2 points against quality competition (2 games).
#17: Belmont (10-1)
#50 Belmont was projected to beat #358 Saint Francis by 12. They cruised to a 94-57 victory, 25 points better than projected. Against #73 Richmond, Belmont lost 84-76. They were projected to win by 8.
Bully Metrics: Exceeded projections by 80.3 total points against weak opponents (4 games); underperformed by 16.4 points against quality competition (1 games).
#18: Queens University (5-6)
Against #360 Gardner-Webb, #179 Queens University rolled to a 33-point win, 107-74. The model had them winning by 5; the actual margin was 33, outpacing the projection by 28. Facing #32 Wake Forest, Queens University came up short, losing 111-73 after being projected to lose by 9.
Bully Metrics: Exceeded projections by 67.7 total points against weak opponents (3 games); underperformed by 67.4 points against quality competition (5 games).
#19: Illinois (8-3)
#26 Illinois faced #363 Jackson State as 21-point favorites and won handily 113-55, 37 points above the spread. Illinois fell to #11 UConn 74-61, missing the 3-point projection by 10.
Bully Metrics: Exceeded projections by 65.2 total points against weak opponents (2 games); underperformed by 30.5 points against quality competition (9 games).
#20: American (7-4)
Expected to win by 1 over #308 Longwood, #221 American took care of business, winning 92-66—beating the line by 25. The model had American losing by 3 against #97 George Washington. Instead, they lost 107-67.
Bully Metrics: Exceeded projections by 24.8 total points against weak opponents (1 games); underperformed by 54.3 points against quality competition (5 games).
#21: Kansas State (7-4)
#82 Kansas State cruised to a 108-49 victory against #364 Mississippi Valley State. Favored by 32, the 59-point margin was +27 versus projection. Against #85 Bowling Green, Kansas State lost 82-66. They were projected to win by 9.
Bully Metrics: Exceeded projections by 53.0 total points against weak opponents (2 games); underperformed by 72.8 points against quality competition (8 games).
#22: Pitt (5-6)
The model gave #135 Pitt a 9-point edge over #283 Bucknell. They rolled to a 34-point win, 84-50, finishing 25 beyond the expected margin. Facing #38 West Virginia, Pitt came up short, losing 71-49 after being projected to win by 2.
Bully Metrics: Exceeded projections by 25.1 total points against weak opponents (1 games); underperformed by 92.8 points against quality competition (9 games).
#23: Old Dominion (3-8)
#217 Old Dominion handled #346 Morgan State, winning 88-56. That 32-point margin was a 29-point swing from the projection. Old Dominion fell to #97 George Washington 96-73, missing the 10-point projection by 13.
Bully Metrics: Exceeded projections by 29.0 total points against weak opponents (1 games); underperformed by 43.6 points against quality competition (7 games).
#24: Minnesota (6-5)
Facing #331 Alcorn State, #121 Minnesota coasted to a 95-50 win. With a projected spread of 10, the result was 35 points past expectations. The model had Minnesota losing by 11 against #8 Purdue. Instead, they lost 85-57.
Bully Metrics: Exceeded projections by 81.5 total points against weak opponents (3 games); underperformed by 48.7 points against quality competition (6 games).
#25: St Peter’s (4-5)
#243 St Peter’s was projected to beat #343 Niagara by 2. They won comfortably 71-43, 26 points better than projected. Against #27 Seton Hall, St Peter’s lost 77-50. They were projected to lose by 0.
Bully Metrics: Exceeded projections by 25.5 total points against weak opponents (1 games); underperformed by 29.2 points against quality competition (3 games).
What This Means
These rankings highlight teams whose efficiency numbers may not tell the full story. While crushing inferior opponents is expected, doing so far beyond statistical projections while simultaneously underperforming against quality teams suggests inflated metrics.
Actionable Advice
- Safe Bets vs Weak Teams: These teams are “flat-track bullies”—they don’t let up. They are often safe bets to cover large spreads against inferior competition because they play hard for 40 minutes regardless of the score.
- Fade vs Strong Teams: Be extremely careful backing these teams against quality opponents. Their efficiency metrics are artificially inflated by their bully behavior, often leading to them being overvalued favorites against teams that can actually punch back.
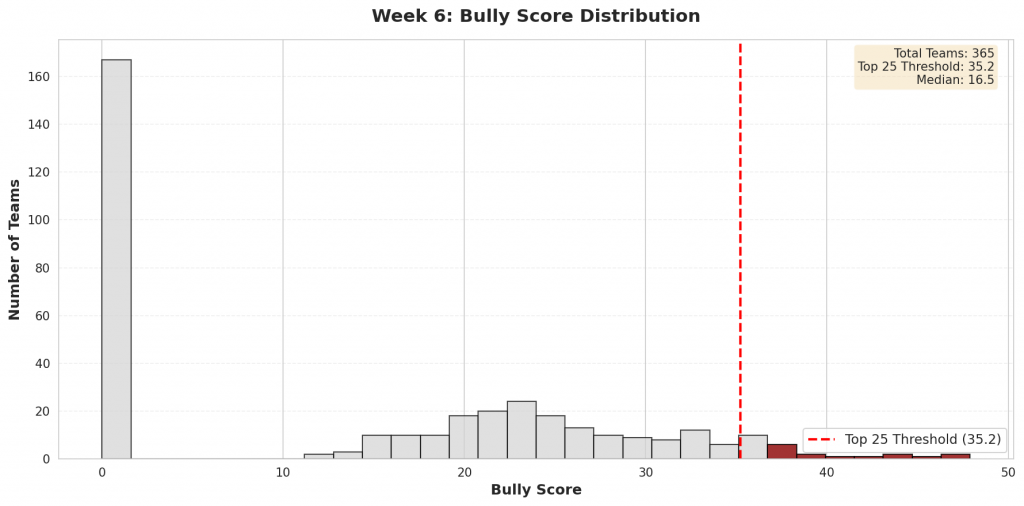
Figure 4: Distribution of bully scores across all Division I teams. The top 25 bullies (highlighted in red) represent teams whose efficiency metrics are most inflated by their performance patterns.
Check back next week for updated bully rankings.