West Coast Update: Week 6
December 15, 2025The West Coast enters Week 6 with teams showing diverse trending patterns. This analysis examines each team’s performance trends using MACD (Moving Average Convergence Divergence) indicators to identify not just where teams stand, but where they’re headed.
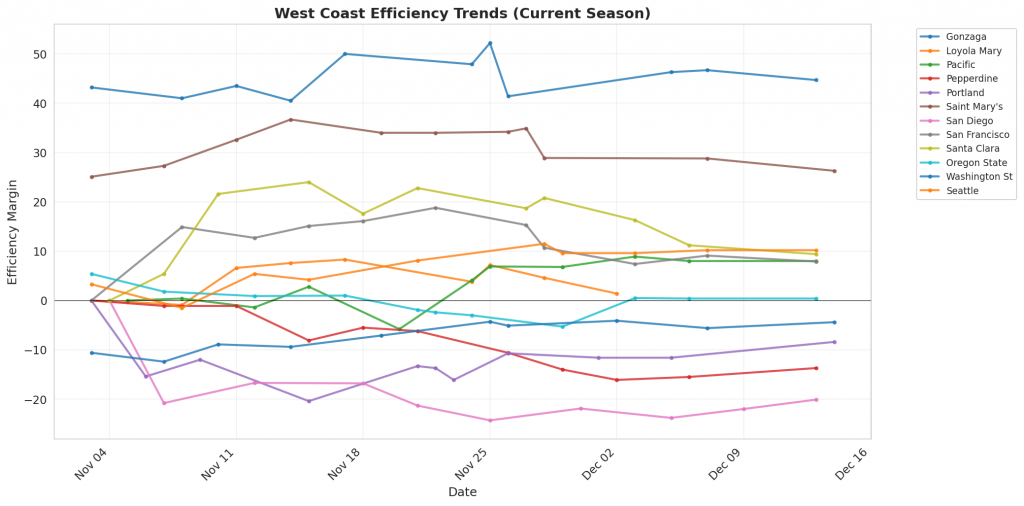
Figure 1: Efficiency margin trends for West Coast teams throughout the season. Teams trending upward show improving performance, while downward trends indicate struggles.
Conference Snapshot
- Week Dates: December 08 – December 14, 2025
- Trending Up (Efficiency): Gonzaga, Pacific, Portland, San Diego, Oregon State
- Trending Down (Efficiency): Loyola Mary, Pepperdine, Saint Mary’s, San Francisco, Santa Clara
Team-by-Team Analysis
Gonzaga
Record: 10-1 | Elo: 1727.2 (ranked 5 of 365) | Efficiency Margin: +44.72 (ranked 3 of 365)
Offensive Trends:
- 3Pt Pct (3 Point FGM/FGA (%)): Currently ranked 74 of 365 in D1. Trending up strongly 🟢.
- FT Pct (FTM/FTA (%)): Currently ranked 245 of 365 in D1. Trending down strongly 🔴.
Defensive Trends:
- Def Reb Pct (Defensive Rebounding): Currently ranked 7 of 365 in D1. Trending up strongly 🟢.
- Opp FGA Per Poss (Opp FG Attempts Per Possession (%)): Currently ranked 32 of 365 in D1. Trending down strongly 🟢.
Loyola Mary
Record: 7-3 | Elo: 1506.0 (ranked 176 of 365) | Efficiency Margin: +1.40 (ranked 150 of 365)
Offensive Trends:
- Turnovers (Turnovers): Currently ranked 192 of 365 in D1. Trending up strongly 🔴.
- Balls Stolen Per Poss (Balls Stolen Per Possession): Currently ranked 235 of 365 in D1. Trending up strongly 🟢.
Defensive Trends:
- Opp Turnovers (Opp Turnovers): Currently ranked 101 of 365 in D1. Trending up strongly 🔴.
- Opp FGA Per Poss (Opp FG Attempts Per Possession (%)): Currently ranked 211 of 365 in D1. Trending down strongly 🟢.
Oregon State
Record: 6-5 | Elo: 1499.9 (ranked 189 of 365) | Efficiency Margin: +0.38 (ranked 162 of 365)
Offensive Trends:
- Off Reb Pct (Offensive Rebounding): Currently ranked 277 of 365 in D1. Trending down strongly 🔴.
- FGM Per Poss (Field Goal Makes Per Possession (%)): Currently ranked 322 of 365 in D1. Trending down strongly 🔴.
Defensive Trends:
- Opp Shooting (Opp Shooting): Currently ranked 65 of 365 in D1. Trending down strongly 🟢.
- Opp FG Pct (%) (Opp FGM/FGA (%)): Currently ranked 71 of 365 in D1. Trending down strongly 🟢.
Pacific
Record: 8-3 | Elo: 1406.4 (ranked 306 of 365) | Efficiency Margin: +7.96 (ranked 104 of 365)
Offensive Trends:
- Shooting (Shooting): Currently ranked 118 of 365 in D1. Trending up strongly 🟢.
- Off Reb Pct (Offensive Rebounding): Currently ranked 172 of 365 in D1. Trending up strongly 🟢.
Defensive Trends:
- Opp Shooting (Opp Shooting): Currently ranked 47 of 365 in D1. Trending down strongly 🟢.
- Def Reb Pct (Defensive Rebounding): Currently ranked 18 of 365 in D1. Trending up strongly 🟢.
Pepperdine
Record: 4-7 | Elo: 1389.9 (ranked 321 of 365) | Efficiency Margin: -13.69 (ranked 279 of 365)
Offensive Trends:
- Turnovers (Turnovers): Currently ranked 181 of 365 in D1. Trending up strongly 🔴.
- Off Reb Pct (Offensive Rebounding): Currently ranked 282 of 365 in D1. Trending down strongly 🔴.
Defensive Trends:
- Opp Shooting (Opp Shooting): Currently ranked 146 of 365 in D1. Trending down strongly 🟢.
- Opp FGM Per Poss (Opp FG Makes Per Possession (%)): Currently ranked 213 of 365 in D1. Trending down strongly 🟢.
Portland
Record: 7-4 | Elo: 1438.1 (ranked 270 of 365) | Efficiency Margin: -8.42 (ranked 229 of 365)
Offensive Trends:
- Shooting (Shooting): Currently ranked 59 of 365 in D1. Trending up strongly 🟢.
- Off Reb Pct (Offensive Rebounding): Currently ranked 288 of 365 in D1. Trending up strongly 🟢.
Defensive Trends:
- Opp Turnovers (Opp Turnovers): Currently ranked 115 of 365 in D1. Trending up strongly 🔴.
- Opp FT Rate (Opp FTA/FGA (%)): Currently ranked 89 of 365 in D1. Trending up strongly 🔴.
Saint Mary’s
Record: 9-2 | Elo: 1700.0 (ranked 13 of 365) | Efficiency Margin: +26.30 (ranked 22 of 365)
Offensive Trends:
- Turnovers (Turnovers): Currently ranked 221 of 365 in D1. Trending up strongly 🔴.
- FT Rate (FTA/FGA (%)): Currently ranked 73 of 365 in D1. Trending up strongly 🟢.
Defensive Trends:
- Opp 2Pt Rate (Opp 2 Point Attempts/FGA (%)): Currently ranked 264 of 365 in D1. Trending down strongly 🟢.
- Opp 2PA Per Poss (Opp 2 Point Attempts Per Possession (%)): Currently ranked 304 of 365 in D1. Trending down strongly 🟢.
San Diego
Record: 4-6 | Elo: 1357.8 (ranked 350 of 365) | Efficiency Margin: -20.13 (ranked 317 of 365)
Offensive Trends:
- Shooting (Shooting): Currently ranked 195 of 365 in D1. Trending up strongly 🟢.
- 2Pt Rate (2 Point Attempts/FGA (%)): Currently ranked 273 of 365 in D1. Trending down strongly 🔴.
Defensive Trends:
- Opp Shooting (Opp Shooting): Currently ranked 299 of 365 in D1. Trending up strongly 🔴.
- Opp Turnovers (Opp Turnovers): Currently ranked 22 of 365 in D1. Trending up strongly 🔴.
San Francisco
Record: 6-5 | Elo: 1587.1 (ranked 77 of 365) | Efficiency Margin: +7.86 (ranked 106 of 365)
Offensive Trends:
- FG Pct (Field Goal Percentage (FGM/FGA)): Currently ranked 201 of 365 in D1. Trending down strongly 🔴.
- 2Pt Rate (2 Point Attempts/FGA (%)): Currently ranked 330 of 365 in D1. Trending down strongly 🔴.
Defensive Trends:
- Opp Turnovers (Opp Turnovers): Currently ranked 349 of 365 in D1. Trending down strongly 🟢.
- Def Reb Pct (Defensive Rebounding): Currently ranked 168 of 365 in D1. Trending down strongly 🔴.
Santa Clara
Record: 8-3 | Elo: 1584.7 (ranked 83 of 365) | Efficiency Margin: +9.38 (ranked 96 of 365)
Offensive Trends:
- Shooting (Shooting): Currently ranked 133 of 365 in D1. Trending down strongly 🔴.
- FGM Per Poss (Field Goal Makes Per Possession (%)): Currently ranked 75 of 365 in D1. Trending down strongly 🔴.
Defensive Trends:
- Opp Shooting (Opp Shooting): Currently ranked 133 of 365 in D1. Trending up strongly 🔴.
- Opp Turnovers (Opp Turnovers): Currently ranked 37 of 365 in D1. Trending up strongly 🔴.
Seattle
Record: 8-2 | Elo: 1528.3 (ranked 144 of 365) | Efficiency Margin: +10.24 (ranked 92 of 365)
Offensive Trends:
- Shooting (Shooting): Currently ranked 8 of 365 in D1. Trending up strongly 🟢.
- Off Reb Pct (Offensive Rebounding): Currently ranked 304 of 365 in D1. Trending up strongly 🟢.
Defensive Trends:
- Def Reb Pct (Defensive Rebounding): Currently ranked 242 of 365 in D1. Trending down strongly 🔴.
- Opp Assists per FGM (Opp Assists/FGM (%)): Currently ranked 51 of 365 in D1. Trending down strongly 🟢.
Washington St
Record: 2-8 | Elo: 1484.0 (ranked 213 of 365) | Efficiency Margin: -4.40 (ranked 200 of 365)
Offensive Trends:
- Shooting (Shooting): Currently ranked 130 of 365 in D1. Trending down strongly 🔴.
- Off Reb Pct (Offensive Rebounding): Currently ranked 259 of 365 in D1. Trending down strongly 🔴.
Defensive Trends:
- Opp FT Rate (Opp FTA/FGA (%)): Currently ranked 232 of 365 in D1. Trending up strongly 🔴.
- Opp FGA Per Poss (Opp FG Attempts Per Possession (%)): Currently ranked 85 of 365 in D1. Trending down strongly 🟢.
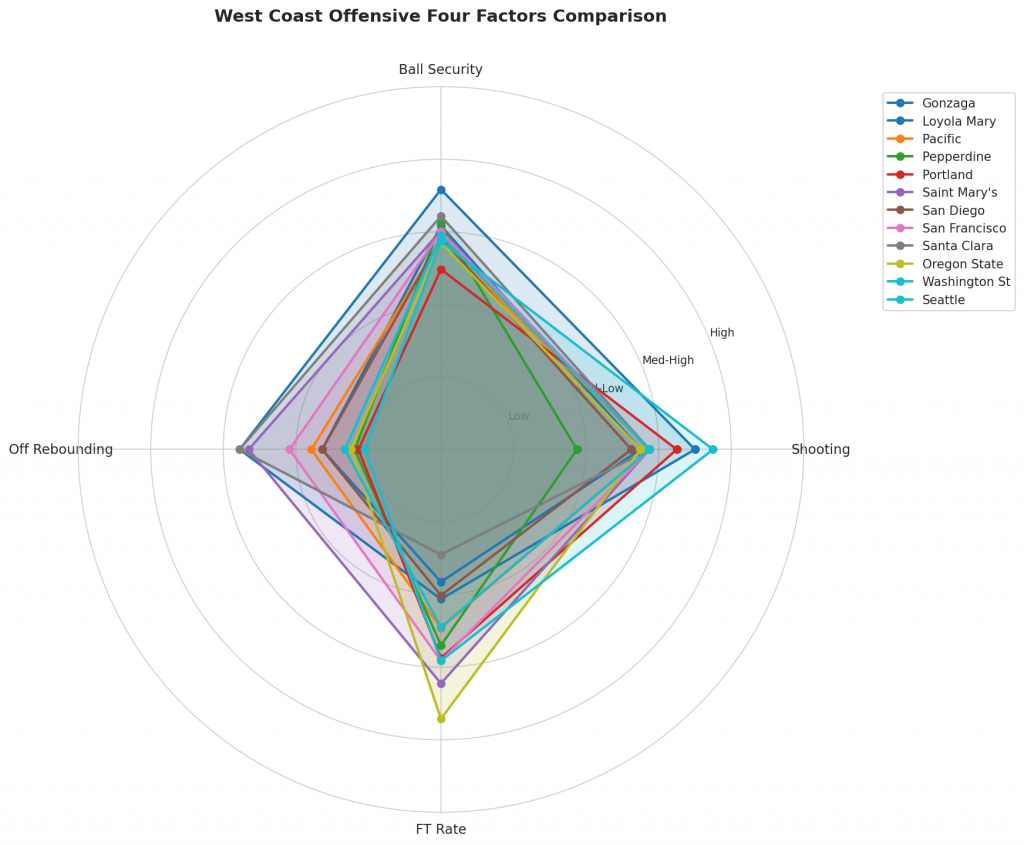
Figure 2: Offensive Four Factors comparison across West Coast teams. The radar chart shows each team’s shooting efficiency (eFG%), ball security (TOV%), offensive rebounding (OREB%), and free throw generation (FT Rate).
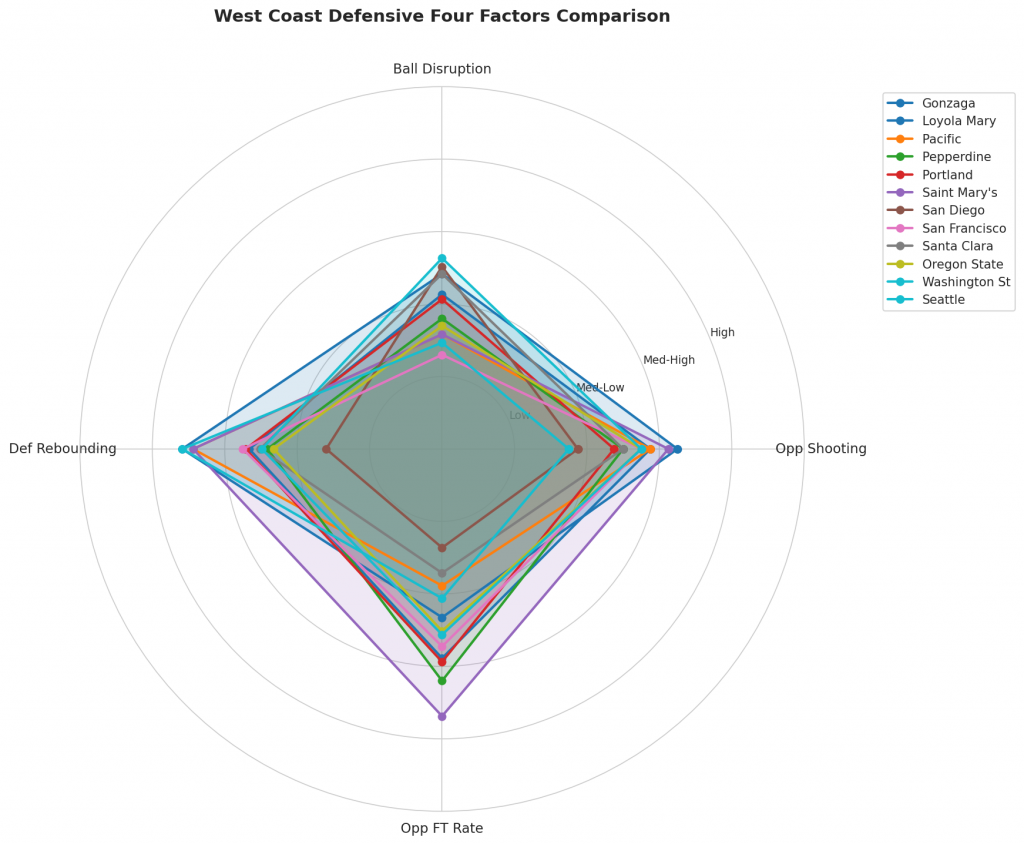
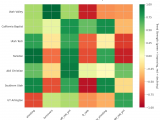
Figure 3: Defensive Four Factors comparison across West Coast teams. The radar chart shows each team’s opponent shooting defense (Opp eFG%), ball disruption (forcing TOV%), defensive rebounding (DREB%), and opponent free throw prevention (Opp FT Rate).
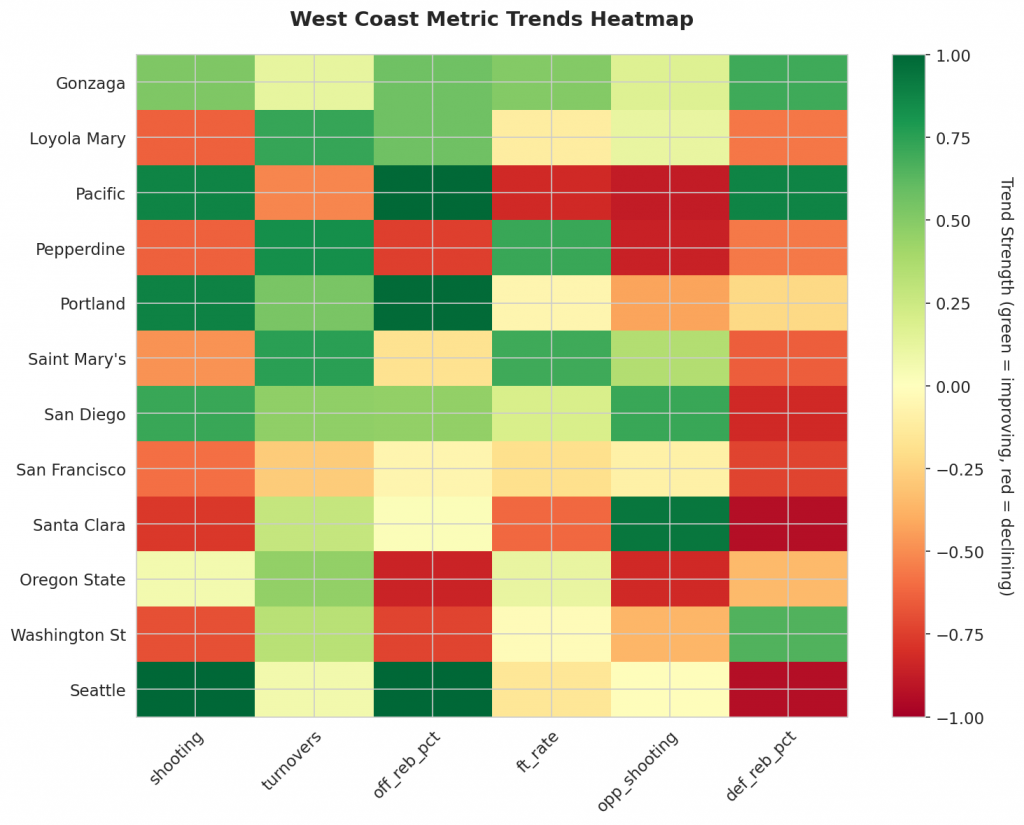
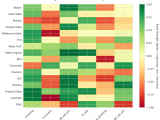
Figure 4: MACD trends heatmap showing which metrics are improving (green) or declining (red) for each team. Stronger colors indicate more pronounced trends.
Looking Ahead
As West Coast teams continue their season, the MACD trending indicators will help identify which teams are genuinely improving versus those riding unsustainable momentum. Check back next week for updated analysis.
Metrics Glossary
Four Factors (Dean Oliver’s framework for basketball success):
- eFG% (Effective Field Goal %): Field goal percentage adjusted for 3-pointers being worth more (FGM + 0.5×3PM) / FGA. Higher is better offensively, lower is better defensively.
- TOV% (Turnover Rate): Turnovers per 100 possessions. Lower is better offensively (taking care of the ball), higher is better defensively (forcing turnovers).
- OREB% / DREB% (Offensive/Defensive Rebound Rate): Percentage of available rebounds grabbed. Offensive rebounds create second-chance points; defensive rebounds end opponent possessions.
- FTR (Free Throw Rate): Free throws made per field goal attempt (FTM/FGA). Measures ability to get to the line AND convert. Higher is better offensively, lower is better defensively.
Other Metrics:
- Elo Rating: Chess-style rating system that updates based on game results and opponent strength. Higher Elo indicates stronger team.
- Efficiency Margin: Point differential per 100 possessions (Offensive Efficiency – Defensive Efficiency). Accounts for pace of play.
- MACD (Moving Average Convergence Divergence): Trend indicator comparing 12-game and 26-game exponential moving averages. Positive MACD = improving trend, Negative MACD = declining trend.
Analysis powered by HoopSci’s advanced metrics and MACD trending indicators.