Big Sky Update: Week 9
January 5, 2026The Big Sky enters Week 9 with teams showing diverse trending patterns. This analysis examines each team’s performance trends using MACD (Moving Average Convergence Divergence) indicators to identify not just where teams stand, but where they’re headed.
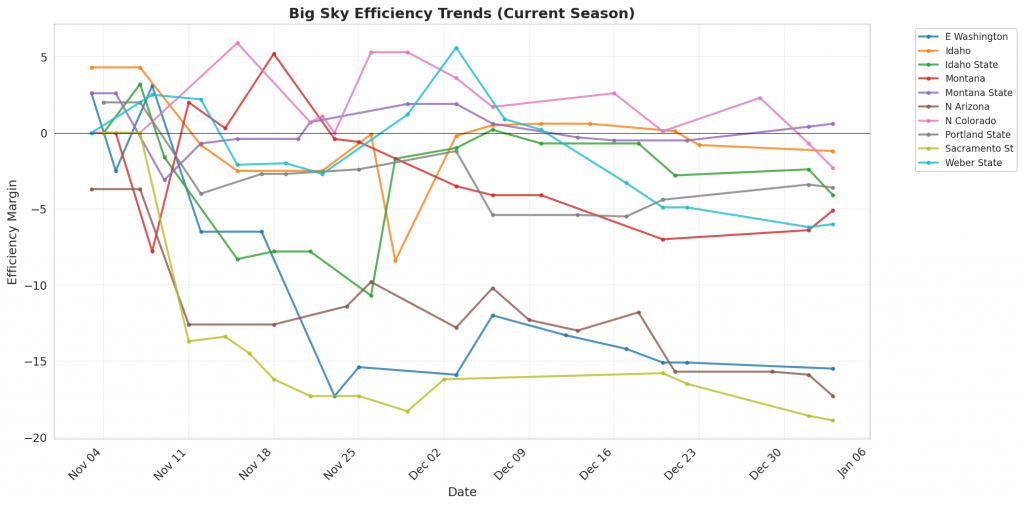
Figure 1: Efficiency margin trends for Big Sky teams throughout the season. Teams trending upward show improving performance, while downward trends indicate struggles.
Conference Snapshot
- Week Dates: December 29 – January 04, 2026
- Trending Up (Efficiency): Idaho, Idaho State, N Arizona, Portland State, Weber State
- Trending Down (Efficiency): E Washington, Montana, Montana State, N Colorado, Sacramento St
Team-by-Team Analysis
E Washington
Record: 2-12 | Elo: 1384.9 (ranked 317 of 365) | Efficiency Margin: -15.45 (ranked 287 of 365)
Offensive Trends:
- Off Reb Pct (Offensive Rebounding): Currently ranked 199 of 365 in D1. Trending up strongly 🟢.
- FGA Per Poss (Field Goal Attempts Per Possession (%)): Currently ranked 196 of 365 in D1. Trending up strongly 🟢.
Defensive Trends:
- Opp Shooting (Opp Shooting): Currently ranked 363 of 365 in D1. Trending up strongly 🔴.
- Def Reb Pct (Defensive Rebounding): Currently ranked 268 of 365 in D1. Trending down strongly 🔴.
Idaho
Record: 9-5 | Elo: 1456.4 (ranked 241 of 365) | Efficiency Margin: -1.18 (ranked 172 of 365)
Offensive Trends:
- Adj Off Eff (Adjusted Offensive Efficiency): Currently ranked 144 of 365 in D1. Trending up strongly 🟢.
- 3PM Per Poss (3 Point Makes Per Possession (%)): Currently ranked 7 of 365 in D1. Trending up strongly 🟢.
Defensive Trends:
- Opp Shooting (Opp Shooting): Currently ranked 214 of 365 in D1. Trending down strongly 🟢.
- Opp FG Pct (%) (Opp FGM/FGA (%)): Currently ranked 210 of 365 in D1. Trending down strongly 🟢.
Idaho State
Record: 8-7 | Elo: 1448.4 (ranked 256 of 365) | Efficiency Margin: -4.11 (ranked 192 of 365)
Offensive Trends:
- Shooting (Shooting): Currently ranked 74 of 365 in D1. Trending up strongly 🟢.
- FT Rate (FTA/FGA (%)): Currently ranked 87 of 365 in D1. Trending up strongly 🟢.
Defensive Trends:
- Opp Turnovers (Opp Turnovers): Currently ranked 209 of 365 in D1. Trending down strongly 🟢.
- Opp FT Rate (Opp FTA/FGA (%)): Currently ranked 169 of 365 in D1. Trending up strongly 🔴.
Montana
Record: 8-6 | Elo: 1558.3 (ranked 109 of 365) | Efficiency Margin: -5.06 (ranked 201 of 365)
Offensive Trends:
- Turnovers (Turnovers): Currently ranked 345 of 365 in D1. Trending up strongly 🔴.
- FGM Per Poss (Field Goal Makes Per Possession (%)): Currently ranked 188 of 365 in D1. Trending down strongly 🔴.
Defensive Trends:
- Opp 2Pt Rate (Opp 2 Point Attempts/FGA (%)): Currently ranked 293 of 365 in D1. Trending down strongly 🟢.
- Opp 2PM Per Poss (Opp 2 Point Makes Per Possession (%)): Currently ranked 337 of 365 in D1. Trending down strongly 🟢.
Montana State
Record: 8-7 | Elo: 1488.2 (ranked 207 of 365) | Efficiency Margin: +0.62 (ranked 157 of 365)
Offensive Trends:
- Off Reb Pct (Offensive Rebounding): Currently ranked 269 of 365 in D1. Trending up strongly 🟢.
- FGA Per Poss (Field Goal Attempts Per Possession (%)): Currently ranked 42 of 365 in D1. Trending up strongly 🟢.
Defensive Trends:
- Opp 2Pt Rate (Opp 2 Point Attempts/FGA (%)): Currently ranked 315 of 365 in D1. Trending down moderately 🟢.
- Opp 2PM Per Poss (Opp 2 Point Makes Per Possession (%)): Currently ranked 290 of 365 in D1. Trending down moderately 🟢.
N Arizona
Record: 6-9 | Elo: 1419.0 (ranked 288 of 365) | Efficiency Margin: -17.30 (ranked 301 of 365)
Offensive Trends:
- FGA Per Poss (Field Goal Attempts Per Possession (%)): Currently ranked 199 of 365 in D1. Trending down strongly 🔴.
- 3PA Per Poss (3 Point Attempts Per Possession (%)): Currently ranked 303 of 365 in D1. Trending down strongly 🔴.
Defensive Trends:
- Def Reb Pct (Defensive Rebounding): Currently ranked 250 of 365 in D1. Trending down strongly 🔴.
- Opp 2Pt Rate (Opp 2 Point Attempts/FGA (%)): Currently ranked 105 of 365 in D1. Trending down strongly 🟢.
N Colorado
Record: 10-5 | Elo: 1566.9 (ranked 96 of 365) | Efficiency Margin: -2.32 (ranked 180 of 365)
Offensive Trends:
- Shooting (Shooting): Currently ranked 57 of 365 in D1. Trending down strongly 🔴.
- FT Rate (FTA/FGA (%)): Currently ranked 300 of 365 in D1. Trending down strongly 🔴.
Defensive Trends:
- Opp Turnovers (Opp Turnovers): Currently ranked 362 of 365 in D1. Trending down strongly 🟢.
- Opp FT Rate (Opp FTA/FGA (%)): Currently ranked 195 of 365 in D1. Trending up strongly 🔴.
Portland State
Record: 8-5 | Elo: 1506.7 (ranked 179 of 365) | Efficiency Margin: -3.64 (ranked 190 of 365)
Offensive Trends:
- Turnovers (Turnovers): Currently ranked 283 of 365 in D1. Trending down strongly 🟢.
- FTM Per Poss (Free Throw Makes Per Possession (%)): Currently ranked 249 of 365 in D1. Trending up strongly 🟢.
Defensive Trends:
- Opp FT Rate (Opp FTA/FGA (%)): Currently ranked 344 of 365 in D1. Trending up strongly 🔴.
- Opp FTM Per Poss (Opp Free Throw Makes Per Possession (%)): Currently ranked 351 of 365 in D1. Trending up strongly 🔴.
Sacramento St
Record: 4-10 | Elo: 1310.9 (ranked 363 of 365) | Efficiency Margin: -18.87 (ranked 315 of 365)
Offensive Trends:
- Turnovers (Turnovers): Currently ranked 202 of 365 in D1. Trending down strongly 🟢.
- FTM Per Poss (Free Throw Makes Per Possession (%)): Currently ranked 89 of 365 in D1. Trending up strongly 🟢.
Defensive Trends:
- Def Reb Pct (Defensive Rebounding): Currently ranked 271 of 365 in D1. Trending down strongly 🔴.
- Opp 2Pt Rate (Opp 2 Point Attempts/FGA (%)): Currently ranked 148 of 365 in D1. Trending up strongly 🔴.
Weber State
Record: 7-8 | Elo: 1418.2 (ranked 289 of 365) | Efficiency Margin: -5.96 (ranked 209 of 365)
Offensive Trends:
- Off Reb Pct (Offensive Rebounding): Currently ranked 140 of 365 in D1. Trending up strongly 🟢.
- FT Rate (FTA/FGA (%)): Currently ranked 81 of 365 in D1. Trending up strongly 🟢.
Defensive Trends:
- Opp FT Pct (Opp FTM/FTA (%)): Currently ranked 126 of 365 in D1. Trending down strongly 🟢.
- Opp Assists per FGM (Opp Assists/FGM (%)): Currently ranked 73 of 365 in D1. Trending down strongly 🟢.
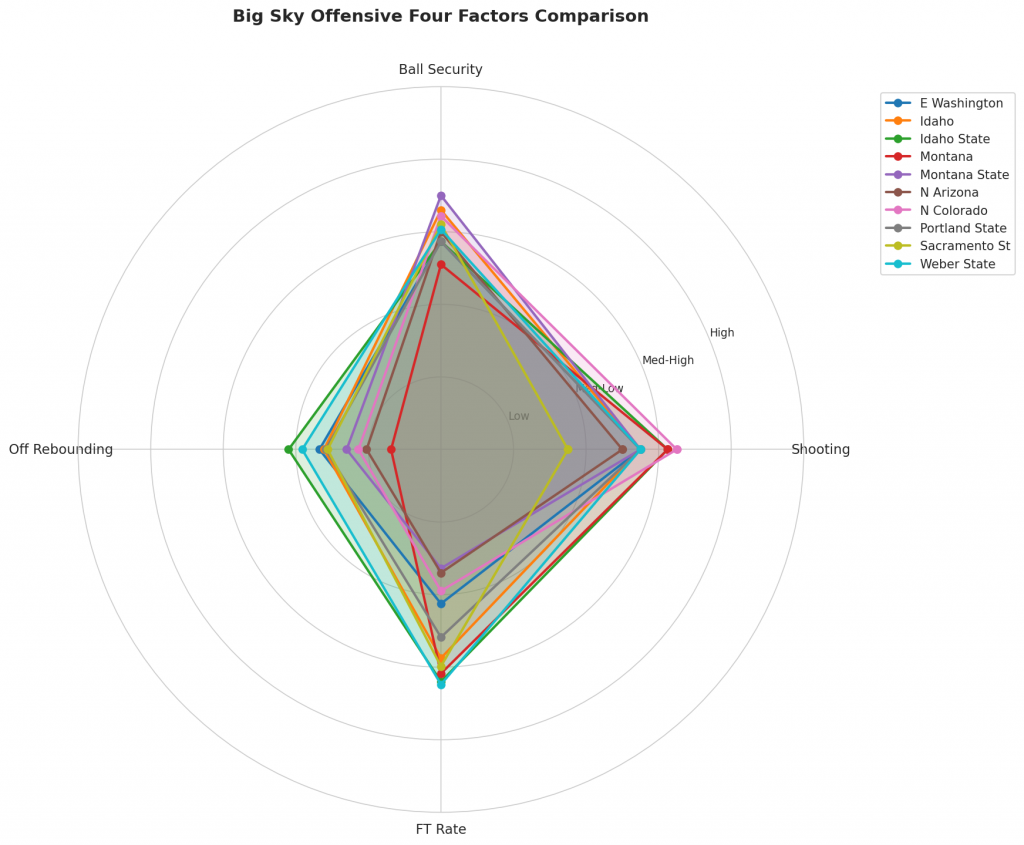
Figure 2: Offensive Four Factors comparison across Big Sky teams. The radar chart shows each team’s shooting efficiency (eFG%), ball security (TOV%), offensive rebounding (OREB%), and free throw generation (FT Rate).
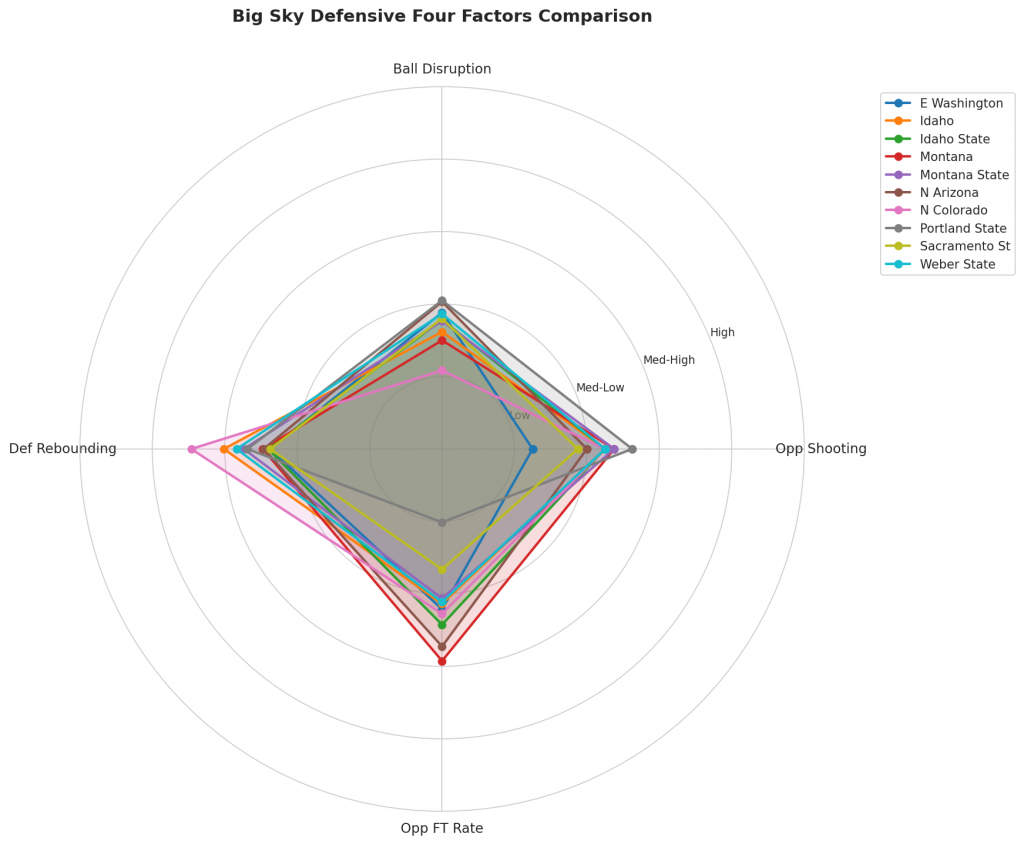
Figure 3: Defensive Four Factors comparison across Big Sky teams. The radar chart shows each team’s opponent shooting defense (Opp eFG%), ball disruption (forcing TOV%), defensive rebounding (DREB%), and opponent free throw prevention (Opp FT Rate).
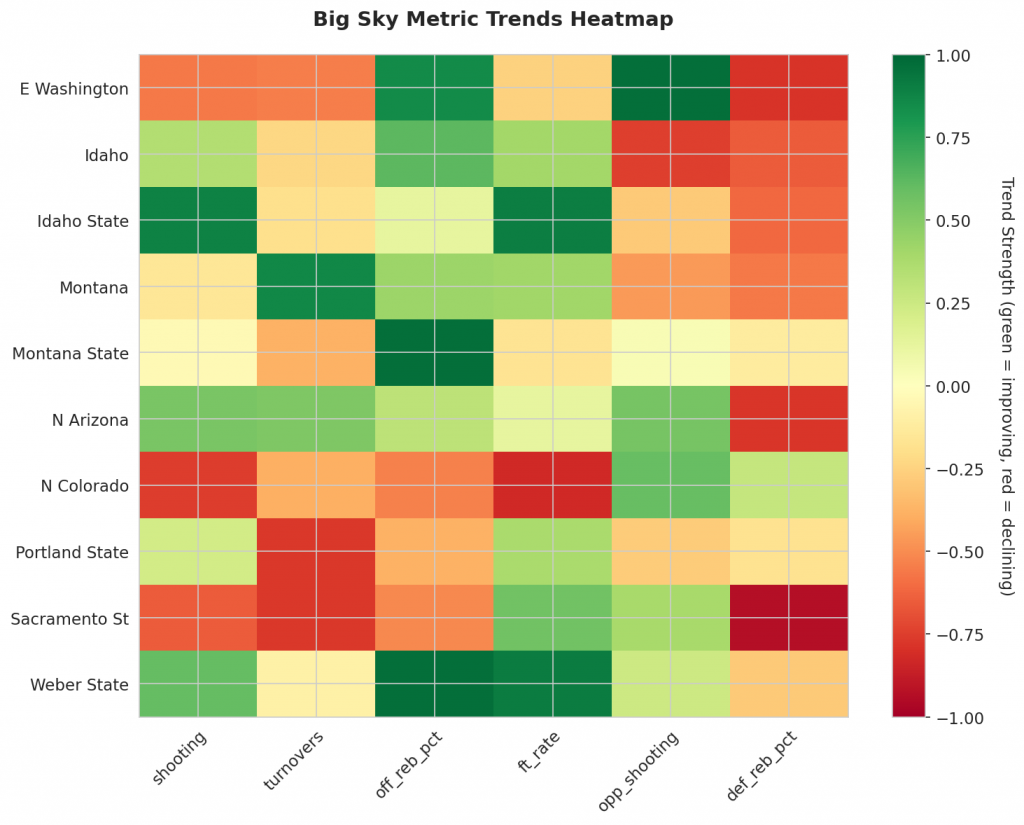
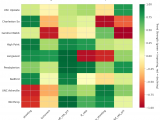
Figure 4: MACD trends heatmap showing which metrics are improving (green) or declining (red) for each team. Stronger colors indicate more pronounced trends.
Looking Ahead
As Big Sky teams continue their season, the MACD trending indicators will help identify which teams are genuinely improving versus those riding unsustainable momentum. Check back next week for updated analysis.
Metrics Glossary
Four Factors (Dean Oliver’s framework for basketball success):
- eFG% (Effective Field Goal %): Field goal percentage adjusted for 3-pointers being worth more (FGM + 0.5×3PM) / FGA. Higher is better offensively, lower is better defensively.
- TOV% (Turnover Rate): Turnovers per 100 possessions. Lower is better offensively (taking care of the ball), higher is better defensively (forcing turnovers).
- OREB% / DREB% (Offensive/Defensive Rebound Rate): Percentage of available rebounds grabbed. Offensive rebounds create second-chance points; defensive rebounds end opponent possessions.
- FTR (Free Throw Rate): Free throws made per field goal attempt (FTM/FGA). Measures ability to get to the line AND convert. Higher is better offensively, lower is better defensively.
Other Metrics:
- Elo Rating: Chess-style rating system that updates based on game results and opponent strength. Higher Elo indicates stronger team.
- Efficiency Margin: Point differential per 100 possessions (Offensive Efficiency – Defensive Efficiency). Accounts for pace of play.
- MACD (Moving Average Convergence Divergence): Trend indicator comparing 12-game and 26-game exponential moving averages. Positive MACD = improving trend, Negative MACD = declining trend.
Analysis powered by HoopSci’s advanced metrics and MACD trending indicators.