Summit League Update: Week 9
January 5, 2026The Summit League enters Week 9 with teams showing diverse trending patterns. This analysis examines each team’s performance trends using MACD (Moving Average Convergence Divergence) indicators to identify not just where teams stand, but where they’re headed.
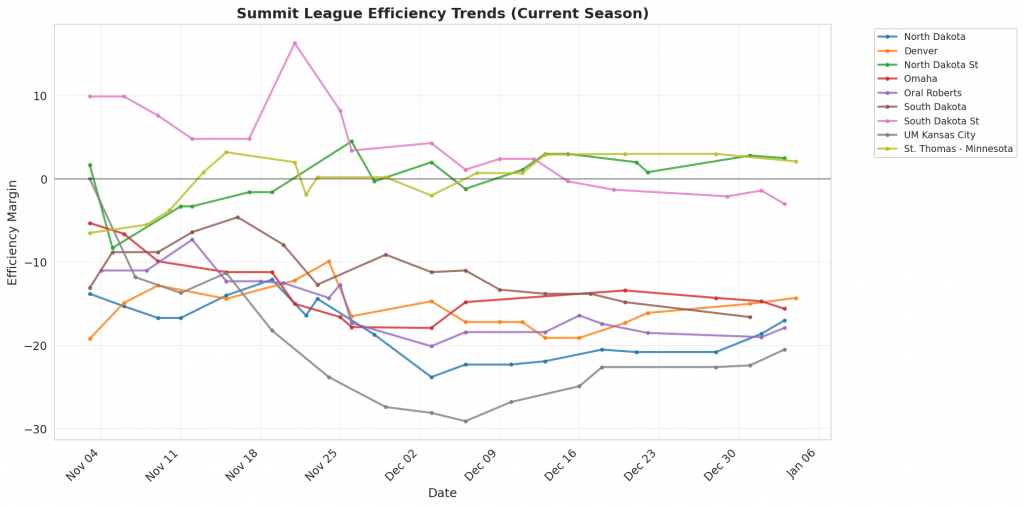
Figure 1: Efficiency margin trends for Summit League teams throughout the season. Teams trending upward show improving performance, while downward trends indicate struggles.
Conference Snapshot
- Week Dates: December 29 – January 04, 2026
- Trending Up (Efficiency): Denver, South Dakota St, St. Thomas – Minnesota
- Trending Down (Efficiency): North Dakota, North Dakota St, Omaha, Oral Roberts, South Dakota
Team-by-Team Analysis
Denver
Record: 8-9 | Elo: 1411.1 (ranked 298 of 365) | Efficiency Margin: -14.33 (ranked 278 of 365)
Offensive Trends:
- Shooting (Shooting): Currently ranked 119 of 365 in D1. Trending up strongly 🟢.
- Turnovers (Turnovers): Currently ranked 72 of 365 in D1. Trending down strongly 🟢.
Defensive Trends:
- Opp Turnovers (Opp Turnovers): Currently ranked 321 of 365 in D1. Trending down strongly 🟢.
- Def Reb Pct (Defensive Rebounding): Currently ranked 342 of 365 in D1. Trending down strongly 🔴.
North Dakota
Record: 8-10 | Elo: 1410.8 (ranked 299 of 365) | Efficiency Margin: -17.03 (ranked 299 of 365)
Offensive Trends:
- Off Reb Pct (Offensive Rebounding): Currently ranked 263 of 365 in D1. Trending up strongly 🟢.
- 2Pt Rate (2 Point Attempts/FGA (%)): Currently ranked 189 of 365 in D1. Trending down strongly 🔴.
Defensive Trends:
- Def Reb Pct (Defensive Rebounding): Currently ranked 261 of 365 in D1. Trending down strongly 🔴.
- Opp FT Rate (Opp FTA/FGA (%)): Currently ranked 333 of 365 in D1. Trending up strongly 🔴.
North Dakota St
Record: 12-5 | Elo: 1558.2 (ranked 110 of 365) | Efficiency Margin: +2.54 (ranked 142 of 365)
Offensive Trends:
- Turnovers (Turnovers): Currently ranked 173 of 365 in D1. Trending up strongly 🔴.
- Off Reb Pct (Offensive Rebounding): Currently ranked 54 of 365 in D1. Trending up strongly 🟢.
Defensive Trends:
- Opp Turnovers (Opp Turnovers): Currently ranked 40 of 365 in D1. Trending up strongly 🔴.
- Opp FGM Per Poss (Opp FG Makes Per Possession (%)): Currently ranked 135 of 365 in D1. Trending down strongly 🟢.
Omaha
Record: 4-10 | Elo: 1467.5 (ranked 236 of 365) | Efficiency Margin: -15.63 (ranked 288 of 365)
Offensive Trends:
- Shooting (Shooting): Currently ranked 192 of 365 in D1. Trending down strongly 🔴.
- Off Reb Pct (Offensive Rebounding): Currently ranked 341 of 365 in D1. Trending down strongly 🔴.
Defensive Trends:
- Def Reb Pct (Defensive Rebounding): Currently ranked 209 of 365 in D1. Trending down strongly 🔴.
- Opp FGM Per Poss (Opp FG Makes Per Possession (%)): Currently ranked 297 of 365 in D1. Trending up strongly 🔴.
Oral Roberts
Record: 5-12 | Elo: 1348.8 (ranked 353 of 365) | Efficiency Margin: -17.90 (ranked 307 of 365)
Offensive Trends:
- Shooting (Shooting): Currently ranked 282 of 365 in D1. Trending down strongly 🔴.
- FG Pct (Field Goal Percentage (FGM/FGA)): Currently ranked 316 of 365 in D1. Trending down strongly 🔴.
Defensive Trends:
- Opp Shooting (Opp Shooting): Currently ranked 276 of 365 in D1. Trending down strongly 🟢.
- Opp Turnovers (Opp Turnovers): Currently ranked 150 of 365 in D1. Trending up strongly 🔴.
South Dakota
Record: 7-8 | Elo: 1448.4 (ranked 255 of 365) | Efficiency Margin: -16.65 (ranked 293 of 365)
Offensive Trends:
- Turnovers (Turnovers): Currently ranked 282 of 365 in D1. Trending up strongly 🔴.
- Off Reb Pct (Offensive Rebounding): Currently ranked 103 of 365 in D1. Trending up strongly 🟢.
Defensive Trends:
- Opp Shooting (Opp Shooting): Currently ranked 330 of 365 in D1. Trending up strongly 🔴.
- Opp FGM Per Poss (Opp FG Makes Per Possession (%)): Currently ranked 353 of 365 in D1. Trending up strongly 🔴.
South Dakota St
Record: 8-9 | Elo: 1513.3 (ranked 163 of 365) | Efficiency Margin: -3.04 (ranked 185 of 365)
Offensive Trends:
- Turnovers (Turnovers): Currently ranked 225 of 365 in D1. Trending down moderately 🟢.
- Off Reb Pct (Offensive Rebounding): Currently ranked 162 of 365 in D1. Trending down moderately 🔴.
Defensive Trends:
- Def Reb Pct (Defensive Rebounding): Currently ranked 110 of 365 in D1. Trending down strongly 🔴.
- Opp FGM Per Poss (Opp FG Makes Per Possession (%)): Currently ranked 146 of 365 in D1. Trending up strongly 🔴.
St. Thomas – Minnesota
Record: 12-4 | Elo: 1573.6 (ranked 92 of 365) | Efficiency Margin: +2.15 (ranked 143 of 365)
Offensive Trends:
- Off Reb Pct (Offensive Rebounding): Currently ranked 365 of 365 in D1. Trending up strongly 🟢.
- FGM Per Poss (Field Goal Makes Per Possession (%)): Currently ranked 64 of 365 in D1. Trending up strongly 🟢.
Defensive Trends:
- Opp FGA Per Poss (Opp FG Attempts Per Possession (%)): Currently ranked 68 of 365 in D1. Trending down strongly 🟢.
- Opp 2Pt Rate (Opp 2 Point Attempts/FGA (%)): Currently ranked 147 of 365 in D1. Trending up strongly 🔴.
UM Kansas City
Record: 3-12 | Elo: 1363.5 (ranked 343 of 365) | Efficiency Margin: -20.47 (ranked 323 of 365)
Offensive Trends:
- Off Reb Pct (Offensive Rebounding): Currently ranked 260 of 365 in D1. Trending up strongly 🟢.
- FT Rate (FTA/FGA (%)): Currently ranked 243 of 365 in D1. Trending up strongly 🟢.
Defensive Trends:
- Opp Shooting (Opp Shooting): Currently ranked 301 of 365 in D1. Trending up strongly 🔴.
- Opp FGM Per Poss (Opp FG Makes Per Possession (%)): Currently ranked 337 of 365 in D1. Trending up strongly 🔴.
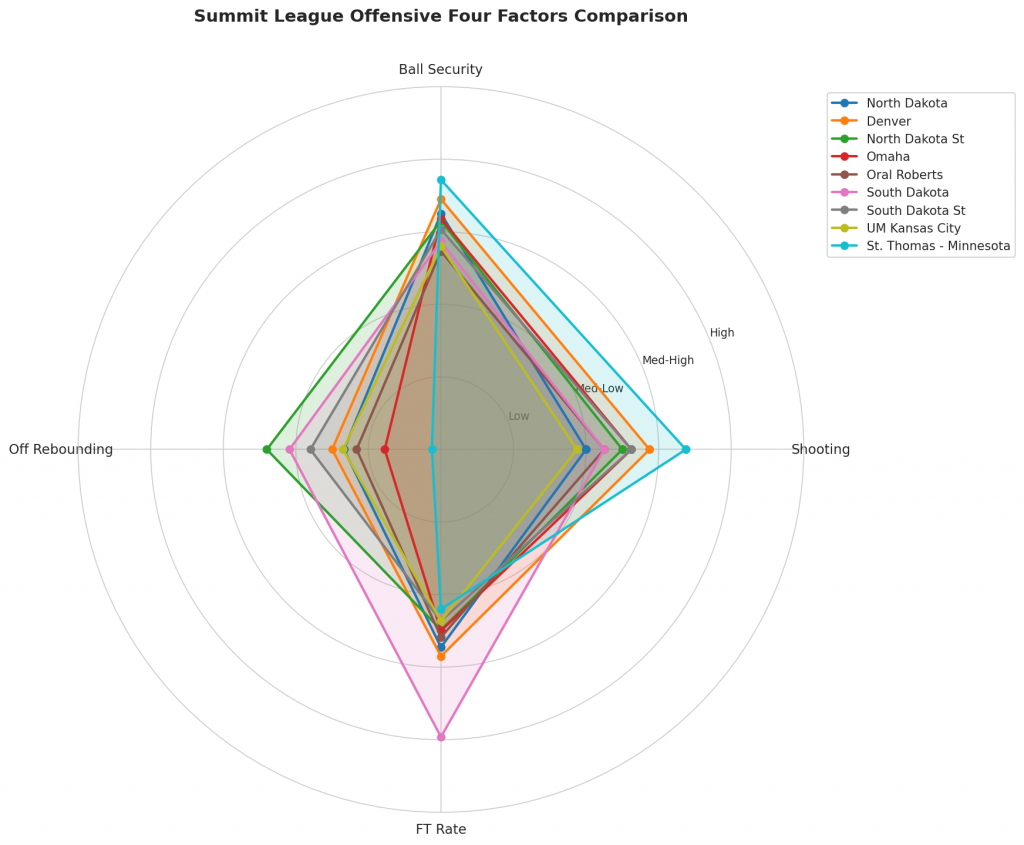
Figure 2: Offensive Four Factors comparison across Summit League teams. The radar chart shows each team’s shooting efficiency (eFG%), ball security (TOV%), offensive rebounding (OREB%), and free throw generation (FT Rate).
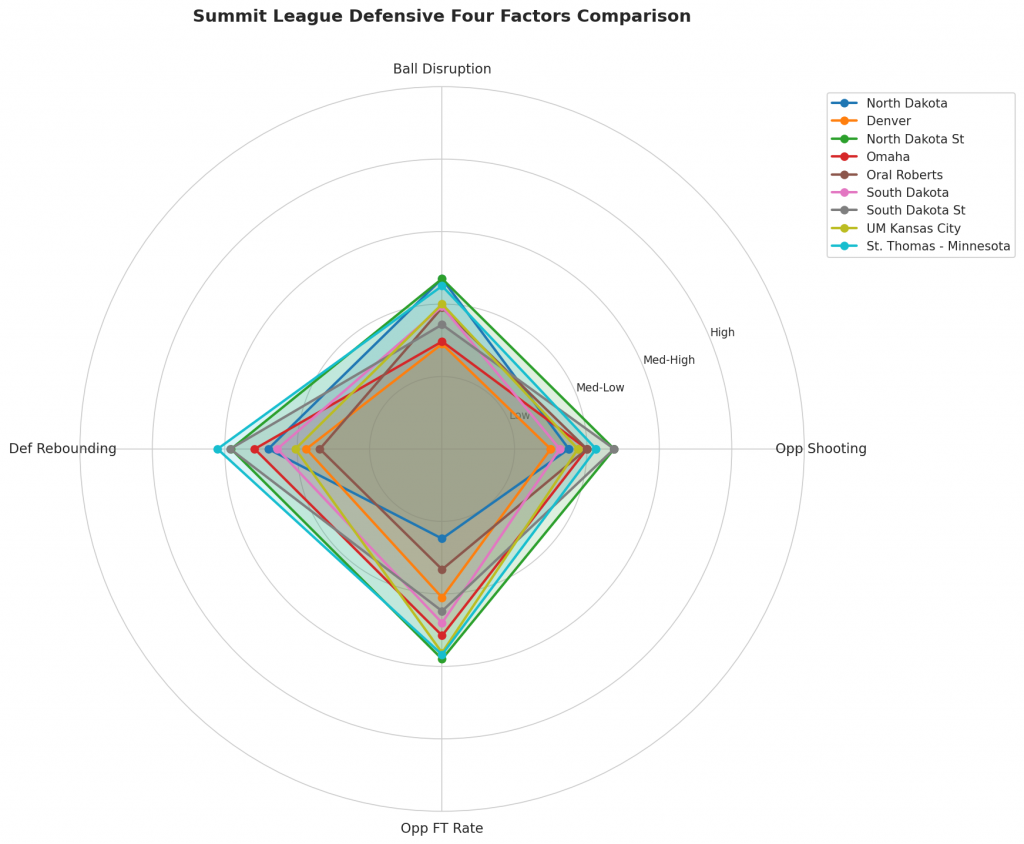
Figure 3: Defensive Four Factors comparison across Summit League teams. The radar chart shows each team’s opponent shooting defense (Opp eFG%), ball disruption (forcing TOV%), defensive rebounding (DREB%), and opponent free throw prevention (Opp FT Rate).
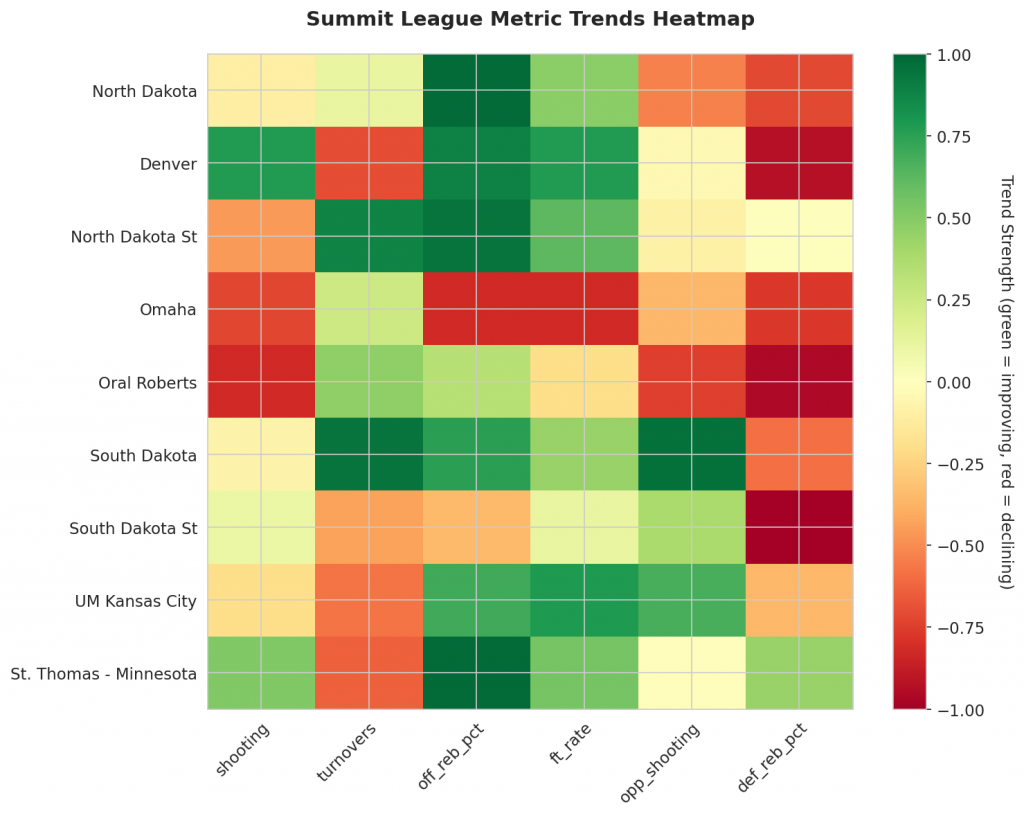
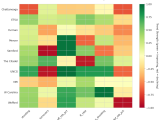
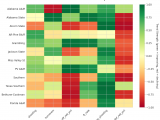
Figure 4: MACD trends heatmap showing which metrics are improving (green) or declining (red) for each team. Stronger colors indicate more pronounced trends.
Looking Ahead
As Summit League teams continue their season, the MACD trending indicators will help identify which teams are genuinely improving versus those riding unsustainable momentum. Check back next week for updated analysis.
Metrics Glossary
Four Factors (Dean Oliver’s framework for basketball success):
- eFG% (Effective Field Goal %): Field goal percentage adjusted for 3-pointers being worth more (FGM + 0.5×3PM) / FGA. Higher is better offensively, lower is better defensively.
- TOV% (Turnover Rate): Turnovers per 100 possessions. Lower is better offensively (taking care of the ball), higher is better defensively (forcing turnovers).
- OREB% / DREB% (Offensive/Defensive Rebound Rate): Percentage of available rebounds grabbed. Offensive rebounds create second-chance points; defensive rebounds end opponent possessions.
- FTR (Free Throw Rate): Free throws made per field goal attempt (FTM/FGA). Measures ability to get to the line AND convert. Higher is better offensively, lower is better defensively.
Other Metrics:
- Elo Rating: Chess-style rating system that updates based on game results and opponent strength. Higher Elo indicates stronger team.
- Efficiency Margin: Point differential per 100 possessions (Offensive Efficiency – Defensive Efficiency). Accounts for pace of play.
- MACD (Moving Average Convergence Divergence): Trend indicator comparing 12-game and 26-game exponential moving averages. Positive MACD = improving trend, Negative MACD = declining trend.
Analysis powered by HoopSci’s advanced metrics and MACD trending indicators.