Week 9: 2026’s Biggest Bullies
January 5, 2026College basketball efficiency rankings can be misleading. Some teams inflate their numbers by demolishing weaker opponents far beyond what statistical models predict, while simultaneously failing to meet expectations against quality competition.
This weekly feature identifies the biggest “bullies” in Division I basketball: teams whose efficiency metrics are artificially elevated by their performance against inferior opponents.
The rankings below count from #1 (biggest bully) to #25, highlighting teams that excel at padding stats against overmatched opponents while struggling to meet expectations against quality competition.

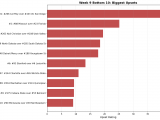
Figure 1: Top 10 teams with the highest bully scores in Week 9. Bully scores reflect the combination of overperformance against weak opponents and underperformance against quality competition.
#1: Penn State (9-5)
#132 Penn State was projected to beat #320 New Haven by 6. They cruised to a 87-43 victory, 38 points better than projected. Against #27 Indiana, Penn State lost 113-72. They were projected to lose by 1.
Bully Metrics: Exceeded projections by 58.9 total points against weak opponents (2 games); underperformed by 94.7 points against quality competition (7 games).
#2: Drake (8-7)
Against #359 Western Illinois, #148 Drake rolled to a 51-point win, 108-57. The model had them winning by 22; the actual margin was 51, outpacing the projection by 29. Facing #51 Illinois State, Drake came up short, losing 73-56 after being projected to win by 10.
Bully Metrics: Exceeded projections by 28.6 total points against weak opponents (1 games); underperformed by 121.8 points against quality competition (9 games).
#3: Marquette (5-10)
#127 Marquette faced #322 Little Rock as 16-point favorites and won handily 89-49, 24 points above the spread. Marquette fell to #27 Indiana 100-77, missing the 6-point projection by 29.
Bully Metrics: Exceeded projections by 24.0 total points against weak opponents (1 games); underperformed by 167.2 points against quality competition (10 games).
#4: Wake Forest (10-5)
Expected to win by 10 over #216 Campbell, #62 Wake Forest coasted to a 99-51 win—beating the line by 38. The model had Wake Forest winning by 2 against #11 Vanderbilt. Instead, they lost 98-67.
Bully Metrics: Exceeded projections by 91.5 total points against weak opponents (3 games); underperformed by 74.0 points against quality competition (8 games).
#5: American (9-6)
#240 American won comfortably 92-66 against #270 Longwood. Favored by 1, the 26-point margin was +25 versus projection. Against #14 Virginia, American lost 95-51. They were projected to lose by 4.
Bully Metrics: Exceeded projections by 24.8 total points against weak opponents (1 games); underperformed by 100.8 points against quality competition (7 games).
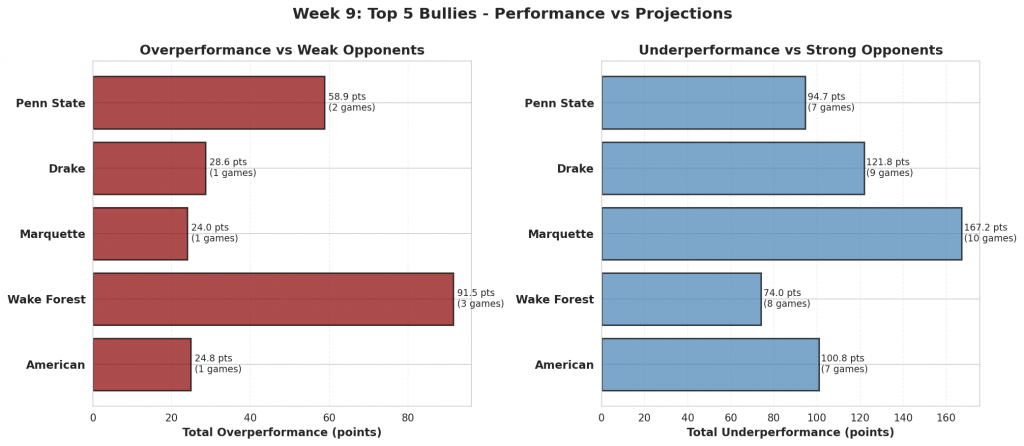
Figure 2: Performance comparison for the top 5 biggest bullies. Red bars show total overperformance against weak opponents; blue bars show total underperformance against strong opponents.
#6: High Point (14-3)
The model gave #67 High Point a 2-point edge over #325 Bryant. They rolled to a 46-point win, 93-47, finishing 44 beyond the expected margin. Facing #123 UAB, High Point came up short, losing 91-74 after being projected to win by 2.
Bully Metrics: Exceeded projections by 96.1 total points against weak opponents (4 games); underperformed by 29.6 points against quality competition (2 games).
#7: Queens University (7-8)
#211 Queens University handled #361 Gardner-Webb, winning 107-74. That 33-point margin was a 28-point swing from the projection. Queens University fell to #62 Wake Forest 111-73, missing the 9-point projection by 29.
Bully Metrics: Exceeded projections by 67.7 total points against weak opponents (3 games); underperformed by 97.4 points against quality competition (6 games).
#8: NC State (10-5)
Facing #311 UNC Greensboro, #31 NC State coasted to a 110-64 win. With a projected spread of 1, the result was 45 points past expectations. The model had NC State winning by 6 against #33 Seton Hall. Instead, they lost 85-74.
Bully Metrics: Exceeded projections by 107.7 total points against weak opponents (3 games); underperformed by 31.5 points against quality competition (11 games).
#9: Wyoming (10-4)
#102 Wyoming was projected to beat #273 Denver by 4. They cruised to a 101-59 victory, 38 points better than projected. Against #94 New Mexico, Wyoming lost 78-58. They were projected to lose by 14.
Bully Metrics: Exceeded projections by 71.9 total points against weak opponents (2 games); underperformed by 11.5 points against quality competition (6 games).
#10: Lindenwood (10-5)
Against #314 Northern Illinois, #218 Lindenwood rolled to a 35-point win, 99-64. The model had them winning by 3; the actual margin was 35, outpacing the projection by 32. Facing #34 Saint Louis, Lindenwood came up short, losing 109-66 after being projected to lose by 13.
Bully Metrics: Exceeded projections by 47.7 total points against weak opponents (2 games); underperformed by 41.5 points against quality competition (3 games).
#11: South Dakota St (8-9)
#182 South Dakota St faced #298 Georgia State as 10-point favorites and won handily 105-58, 38 points above the spread. South Dakota St fell to #102 Wyoming 87-72, missing the 8-point projection by 23.
Bully Metrics: Exceeded projections by 50.1 total points against weak opponents (2 games); underperformed by 86.9 points against quality competition (7 games).
#12: Tenn Tech (6-9)
Expected to win by 2 over #277 West Georgia, #326 Tenn Tech took care of business, winning 87-59—beating the line by 26. The model had Tenn Tech losing by 25 against #26 Kentucky. Instead, they lost 104-54.
Bully Metrics: Exceeded projections by 26.1 total points against weak opponents (1 games); underperformed by 53.8 points against quality competition (5 games).
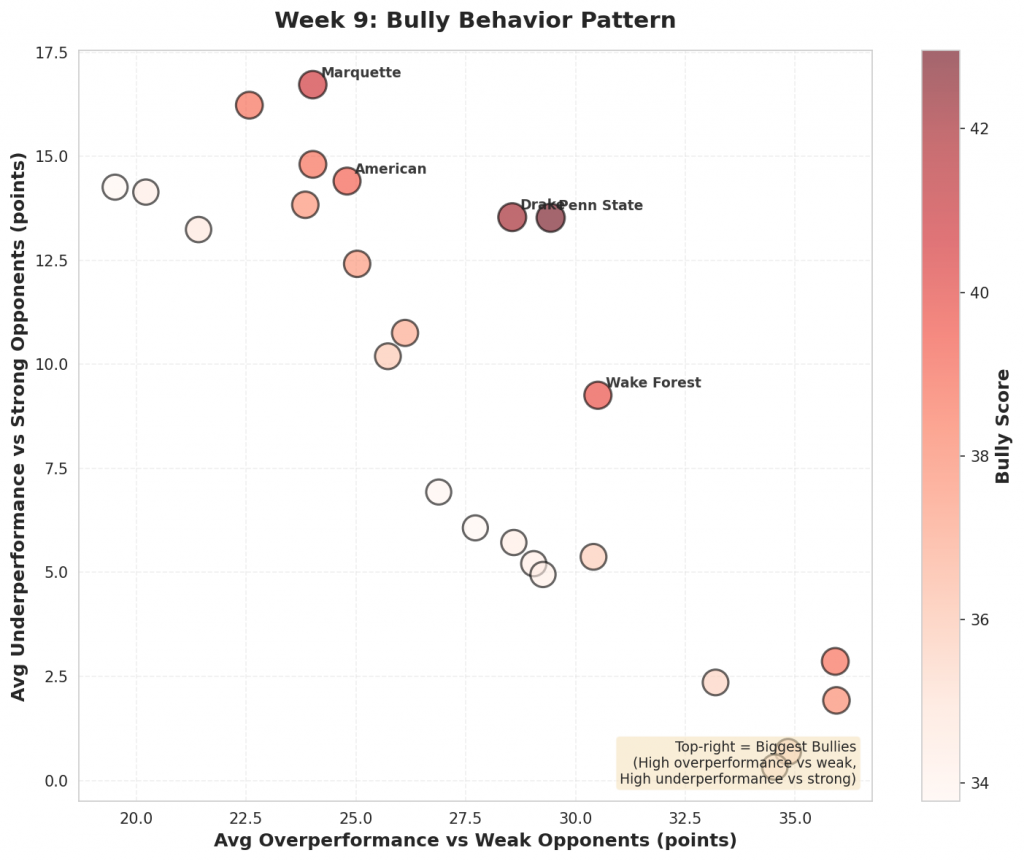
Figure 3: Scatter plot showing the relationship between overperformance against weak opponents (x-axis) and underperformance against strong opponents (y-axis). Bubble size and color indicate bully score magnitude. Top-right quadrant represents the biggest bullies.
#13: Pitt (7-8)
#88 Pitt cruised to a 103-63 victory against #350 Binghamton. Favored by 14, the 40-point margin was +26 versus projection. Against #45 West Virginia, Pitt lost 71-49. They were projected to win by 2.
Bully Metrics: Exceeded projections by 51.5 total points against weak opponents (2 games); underperformed by 112.1 points against quality competition (11 games).
#14: St John’s (9-5)
The model gave #24 St John’s a 18-point edge over #300 Bucknell. They rolled to a 48-point win, 97-49, finishing 30 beyond the expected margin. Facing #54 Providence, St John’s came up short, losing 77-71 after being projected to win by 14.
Bully Metrics: Exceeded projections by 30.4 total points against weak opponents (1 games); underperformed by 64.5 points against quality competition (12 games).
#15: Saint Louis (13-1)
#34 Saint Louis handled #282 Bethune-Cookman, winning 112-53. That 59-point margin was a 49-point swing from the projection. Saint Louis fell to #90 Stanford 78-77, missing the 11-point projection by 12.
Bully Metrics: Exceeded projections by 165.9 total points against weak opponents (5 games); underperformed by 11.8 points against quality competition (5 games).
#16: Michigan (13-0)
Facing #278 La Salle, #1 Michigan coasted to a 102-50 win. With a projected spread of 17, the result was 35 points past expectations. Michigan squeaked past #40 TCU 67-63, underperforming the 10-point line by 6.
Bully Metrics: Exceeded projections by 34.8 total points against weak opponents (1 games); underperformed by 8.3 points against quality competition (12 games).
#17: TCU (11-3)
#40 TCU was projected to beat #364 Jackson State by 9. They cruised to a 115-64 victory, 42 points better than projected. Against #69 Notre Dame, TCU lost 87-85. They were projected to lose by 0.
Bully Metrics: Exceeded projections by 103.6 total points against weak opponents (3 games); underperformed by 1.9 points against quality competition (6 games).
#18: Drexel (6-10)
Against #345 NJIT, #231 Drexel rolled to a 32-point win, 75-43. The model had them winning by 11; the actual margin was 32, outpacing the projection by 21. Facing #72 Syracuse, Drexel came up short, losing 80-50 after being projected to lose by 2.
Bully Metrics: Exceeded projections by 21.4 total points against weak opponents (1 games); underperformed by 79.4 points against quality competition (6 games).
#19: Radford (8-8)
#226 Radford faced #357 Saint Francis as 6-point favorites and won handily 89-56, 26 points above the spread. Radford fell to #126 Wright State 92-59, missing the 0-point projection by 33.
Bully Metrics: Exceeded projections by 40.4 total points against weak opponents (2 games); underperformed by 84.8 points against quality competition (6 games).
#20: Baylor (10-3)
Expected to win by 20 over #353 Alcorn State, #44 Baylor coasted to a 113-56 win—beating the line by 37. The model had Baylor winning by 8 against #40 TCU. Instead, they lost 69-63.
Bully Metrics: Exceeded projections by 85.8 total points against weak opponents (3 games); underperformed by 34.3 points against quality competition (6 games).
#21: Old Dominion (4-12)
#230 Old Dominion cruised to a 88-56 victory against #360 Morgan State. Favored by 3, the 32-point margin was +29 versus projection. Against #75 George Washington, Old Dominion lost 96-73. They were projected to lose by 10.
Bully Metrics: Exceeded projections by 29.0 total points against weak opponents (1 games); underperformed by 46.9 points against quality competition (9 games).
#22: Gonzaga (16-1)
The model gave #3 Gonzaga a 27-point edge over #354 Southern Utah. They rolled to a 72-point win, 122-50, finishing 45 beyond the expected margin. Facing #1 Michigan, Gonzaga came up short, losing 101-61 after being projected to lose by 1.
Bully Metrics: Exceeded projections by 117.0 total points against weak opponents (4 games); underperformed by 54.5 points against quality competition (11 games).
#23: Northwestern (8-6)
#42 Northwestern handled #284 Cleveland State, winning 110-63. That 47-point margin was a 43-point swing from the projection. Northwestern fell to #117 Oklahoma State 86-81, missing the 6-point projection by 11.
Bully Metrics: Exceeded projections by 80.7 total points against weak opponents (3 games); underperformed by 55.5 points against quality competition (8 games).
#24: ETSU (10-5)
Facing #343 UL Monroe, #107 ETSU coasted to a 97-55 win. With a projected spread of 14, the result was 28 points past expectations. The model had ETSU losing by 6 against #56 Dayton. Instead, they lost 88-71.
Bully Metrics: Exceeded projections by 27.7 total points against weak opponents (1 games); underperformed by 30.3 points against quality competition (5 games).
#25: C. Carolina (8-8)
#245 C. Carolina was projected to beat #359 Western Illinois by 0. They won comfortably 84-64, 20 points better than projected. Against #51 Illinois State, C. Carolina lost 94-42. They were projected to lose by 11.
Bully Metrics: Exceeded projections by 19.5 total points against weak opponents (1 games); underperformed by 42.8 points against quality competition (3 games).
What This Means
These rankings highlight teams whose efficiency numbers may not tell the full story. While crushing inferior opponents is expected, doing so far beyond statistical projections while simultaneously underperforming against quality teams suggests inflated metrics.
Actionable Advice
- Safe Bets vs Weak Teams: These teams are “flat-track bullies”—they don’t let up. They are often safe bets to cover large spreads against inferior competition because they play hard for 40 minutes regardless of the score.
- Fade vs Strong Teams: Be extremely careful backing these teams against quality opponents. Their efficiency metrics are artificially inflated by their bully behavior, often leading to them being overvalued favorites against teams that can actually punch back.
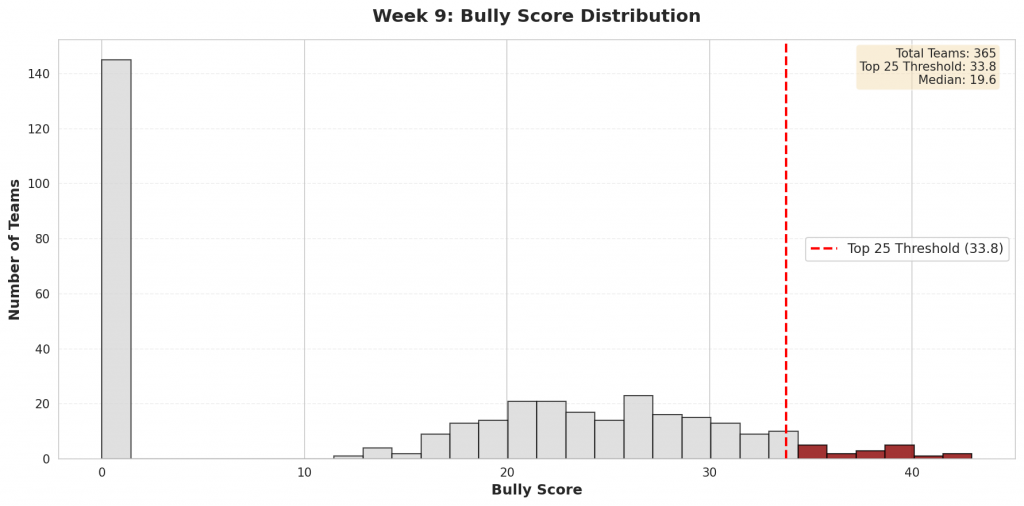
Figure 4: Distribution of bully scores across all Division I teams. The top 25 bullies (highlighted in red) represent teams whose efficiency metrics are most inflated by their performance patterns.
Check back next week for updated bully rankings.