Week 9: The Dial-Up Report
January 5, 2026Some teams are enigmas. They rise to the occasion against top-tier competition, looking like tournament contenders, only to turn around and sleepwalk through games against inferior opponents.
This weekly feature identifies the “Dial-Up” teams in Division I basketball: squads that consistently overperform against strong opponents but “phone it in” and underperform against weaker ones.
The rankings below highlight teams that play to the level of their competition—for better or worse.
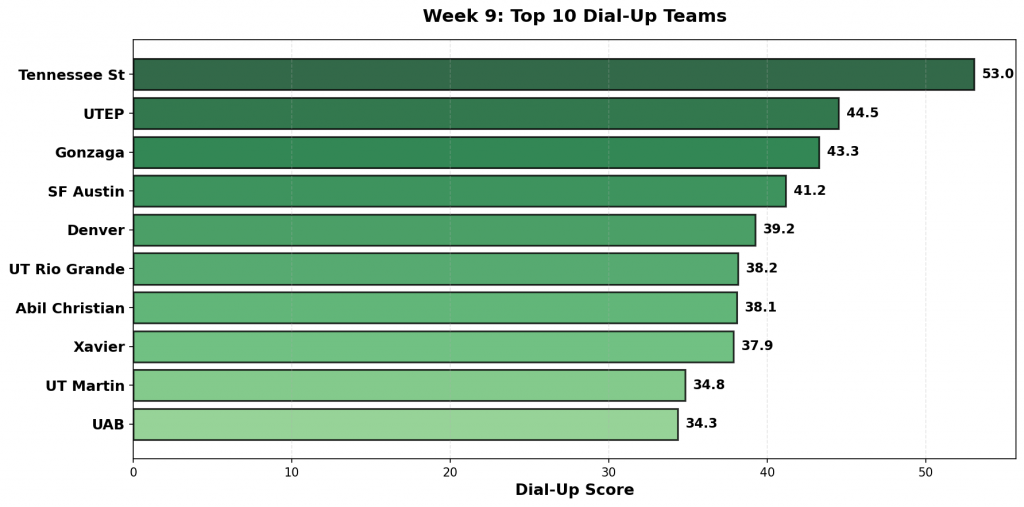
Figure 1: Top 10 teams with the highest Dial-Up scores in Week 9. Scores reflect the combination of overperformance against strong opponents and underperformance against weak ones.
#1: Tennessee St (9-5)
Against #118 UNLV, #249 Tennessee St pulled off a big win, 63-60. The model expected a margin of -8, but they performed 12 points better than projected. Facing #327 Alabama A&M, #249 Tennessee St suffered a bad loss, 53-80. Favored by 14, they underperformed by 42 points.
Dial-Up Metrics: Exceeded projections by 11.5 total points against strong opponents (1 games); underperformed by 41.5 points against weak competition (1 games).
#2: UTEP (4-10)
Against #139 North Dakota State, #297 UTEP pulled off a big win, 76-66. The model expected a margin of -8, but they performed outpacing the projection by 18. Facing #208 Missouri State, #297 UTEP suffered a bad loss, 55-79. Favored by 2, they underperformed by 26 points.
Dial-Up Metrics: Exceeded projections by 18.0 total points against strong opponents (1 games); underperformed by 26.5 points against weak competition (1 games).
#3: Gonzaga (16-1)
Against #141 Maryland, #3 Gonzaga pulled off a big win, 100-61. The model expected a margin of 3, but they performed beating the line by 36. Facing #276 San Diego, #3 Gonzaga struggled to put away San Diego, winning just 99-93. Favored by 30, they underperformed by 24 points.
Dial-Up Metrics: Exceeded projections by 117.4 total points against strong opponents (6 games); underperformed by 23.7 points against weak competition (1 games).
#4: SF Austin (12-2)
Against #170 Arkansas State, #121 SF Austin pulled off a big win, 90-65. The model expected a margin of -13, but they performed +38 versus projection. Facing #199 Fresno State, #121 SF Austin suffered a bad loss, 78-80. Favored by 2, they underperformed by 4 points.
Dial-Up Metrics: Exceeded projections by 37.7 total points against strong opponents (1 games); underperformed by 3.5 points against weak competition (1 games).
#5: Denver (8-9)
Against #93 Colorado State, #273 Denver pulled off a big win, 83-81. The model expected a margin of -19, but they performed 21 points better than projected. Facing #257 Cal State Fullerton, #273 Denver suffered a bad loss, 86-105. Favored by 6, they underperformed by 24 points.
Dial-Up Metrics: Exceeded projections by 59.0 total points against strong opponents (4 games); underperformed by 24.5 points against weak competition (1 games).

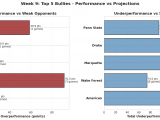
Figure 2: Performance comparison for the top 5 Dial-Up teams. Green bars show total overperformance against strong opponents; orange bars show total underperformance against weak opponents.
#6: UT Rio Grande (5-9)
Against #176 Austin Peay, #214 UT Rio Grande pulled off a big win, 63-50. The model expected a margin of -0, but they performed outpacing the projection by 13. Facing #251 New Orleans, #214 UT Rio Grande suffered a bad loss, 69-85. Favored by 11, they underperformed by 27 points.
Dial-Up Metrics: Exceeded projections by 22.9 total points against strong opponents (2 games); underperformed by 26.7 points against weak competition (1 games).
#7: Abil Christian (9-6)
Against #106 Utah Valley, #263 Abil Christian pulled off a big win, 85-68. The model expected a margin of -10, but they performed beating the line by 27. Facing #217 Utah Tech, #263 Abil Christian suffered a bad loss, 64-79. Favored by 5, they underperformed by 20 points.
Dial-Up Metrics: Exceeded projections by 37.0 total points against strong opponents (2 games); underperformed by 19.6 points against weak competition (1 games).
#8: Xavier (9-6)
Against #45 West Virginia, #125 Xavier pulled off a big win, 78-68. The model expected a margin of -10, but they performed +20 versus projection. Facing #220 Le Moyne, #125 Xavier struggled to put away Le Moyne, winning just 74-69. Favored by 22, they underperformed by 17 points.
Dial-Up Metrics: Exceeded projections by 20.5 total points against strong opponents (1 games); underperformed by 17.4 points against weak competition (1 games).
#9: UT Martin (11-4)
Against #131 Bradley, #195 UT Martin pulled off a big win, 78-67. The model expected a margin of -16, but they performed 27 points better than projected. Facing #196 Southern Miss, #195 UT Martin suffered a bad loss, 60-70. Favored by 8, they underperformed by 18 points.
Dial-Up Metrics: Exceeded projections by 43.2 total points against strong opponents (2 games); underperformed by 26.4 points against weak competition (2 games).
#10: UAB (10-5)
Against #67 High Point, #123 UAB pulled off a big win, 91-74. The model expected a margin of -2, but they performed outpacing the projection by 19. Facing #272 Alabama State, #123 UAB suffered a bad loss, 74-77. Favored by 15, they underperformed by 18 points.
Dial-Up Metrics: Exceeded projections by 32.5 total points against strong opponents (2 games); underperformed by 18.1 points against weak competition (1 games).
#11: UNLV (7-6)
Against #108 Memphis, #118 UNLV pulled off a big win, 92-78. The model expected a margin of -7, but they performed beating the line by 21. Facing #195 UT Martin, #118 UNLV suffered a bad loss, 81-86. Favored by 11, they underperformed by 16 points.
Dial-Up Metrics: Exceeded projections by 20.7 total points against strong opponents (1 games); underperformed by 39.4 points against weak competition (3 games).
#12: UMass (9-6)
Against #122 Florida State, #150 UMass pulled off a big win, 103-95. The model expected a margin of -8, but they performed +16 versus projection. Facing #238 Green Bay, #150 UMass suffered a bad loss, 75-79. Favored by 14, they underperformed by 18 points.
Dial-Up Metrics: Exceeded projections by 15.7 total points against strong opponents (1 games); underperformed by 18.1 points against weak competition (1 games).
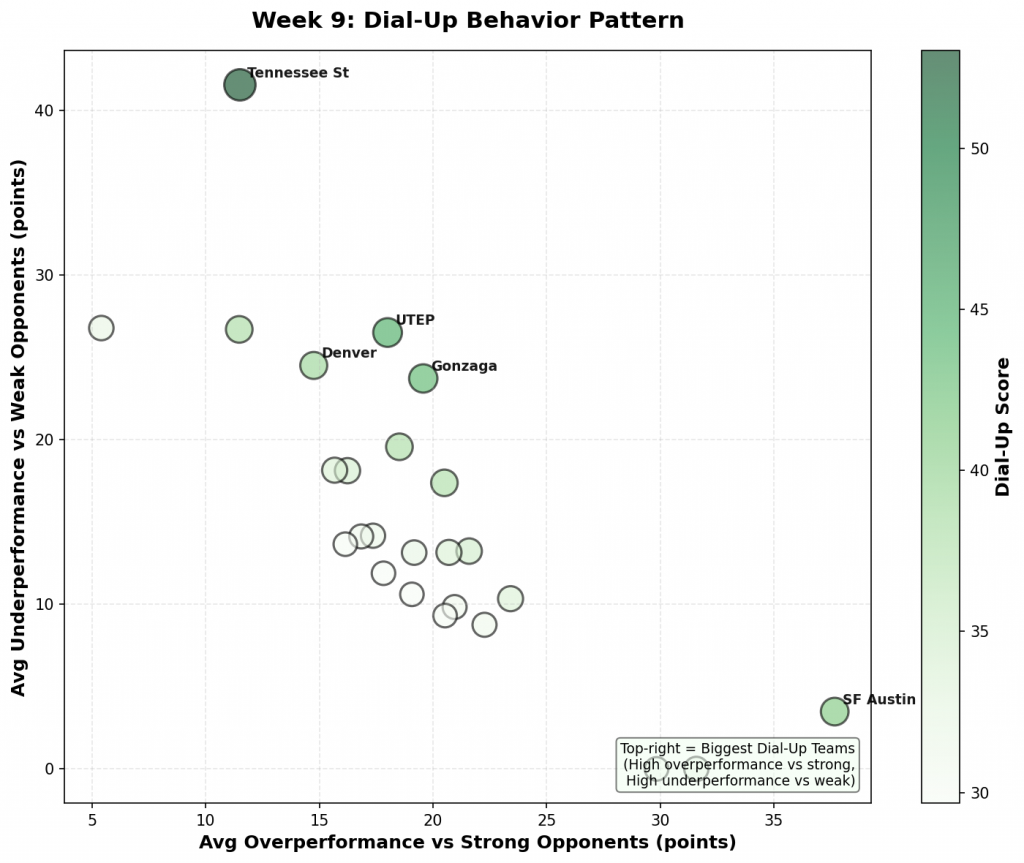
Figure 3: Scatter plot showing the relationship between overperformance against strong opponents (x-axis) and underperformance against weak opponents (y-axis). Bubble size and color indicate Dial-Up score magnitude. Top-right quadrant represents the biggest Dial-Up teams.
#13: Utah State (12-1)
Against #93 Colorado State, #28 Utah State pulled off a big win, 100-58. The model expected a margin of -1, but they performed 43 points better than projected. Facing #199 Fresno State, #28 Utah State struggled to put away Fresno State, winning just 72-63. Favored by 21, they underperformed by 12 points.
Dial-Up Metrics: Exceeded projections by 93.7 total points against strong opponents (4 games); underperformed by 20.7 points against weak competition (2 games).
#14: Winthrop (9-8)
Against #161 Mercer, #198 Winthrop pulled off a big win, 105-69. The model expected a margin of 7, but they performed outpacing the projection by 29. Facing #245 Coastal Carolina, #198 Winthrop suffered a bad loss, 66-72. Favored by 9, they underperformed by 15 points.
Dial-Up Metrics: Exceeded projections by 38.3 total points against strong opponents (2 games); underperformed by 52.5 points against weak competition (4 games).
#15: Loyola-Chicago (5-10)
Against #74 Santa Clara, #281 Loyola-Chicago pulled off a big win, 80-78. The model expected a margin of -3, but they performed beating the line by 5. Facing #314 Northern Illinois, #281 Loyola-Chicago suffered a bad loss, 59-76. Favored by 19, they underperformed by 36 points.
Dial-Up Metrics: Exceeded projections by 5.4 total points against strong opponents (1 games); underperformed by 107.1 points against weak competition (4 games).
#16: Pitt (7-8)
Against #132 Penn State, #88 Pitt pulled off a big win, 80-46. The model expected a margin of 2, but they performed +32 versus projection.
Dial-Up Metrics: Exceeded projections by 31.6 total points against strong opponents (1 games).
#17: Nevada (11-3)
Against #105 San Francisco, #91 Nevada pulled off a big win, 81-65. The model expected a margin of -12, but they performed 28 points better than projected. Facing #204 UC Davis, #91 Nevada suffered a bad loss, 71-75. Favored by 11, they underperformed by 15 points.
Dial-Up Metrics: Exceeded projections by 86.8 total points against strong opponents (5 games); underperformed by 28.3 points against weak competition (2 games).
#18: Vanderbilt (14-0)
Against #167 Lipscomb, #11 Vanderbilt pulled off a big win, 105-61. The model expected a margin of -0, but they performed outpacing the projection by 44. Facing #234 Central Arkansas, #11 Vanderbilt struggled to put away Central Arkansas, winning just 83-72. Favored by 20, they underperformed by 9 points.
Dial-Up Metrics: Exceeded projections by 178.1 total points against strong opponents (8 games); underperformed by 8.8 points against weak competition (1 games).
#19: Delaware (5-9)
Against #75 George Washington, #243 Delaware pulled off a big win, 70-58. The model expected a margin of -5, but they performed beating the line by 17. Facing #208 Missouri State, #243 Delaware suffered a bad loss, 43-61. Favored by 1, they underperformed by 19 points.
Dial-Up Metrics: Exceeded projections by 16.8 total points against strong opponents (1 games); underperformed by 28.2 points against weak competition (2 games).
#20: Illinois (11-3)
Against #82 Missouri, #15 Illinois pulled off a big win, 91-48. The model expected a margin of 5, but they performed +38 versus projection. Facing #214 UT Rio Grande Valley, #15 Illinois struggled to put away UT Rio Grande Valley, winning just 87-73. Favored by 24, they underperformed by 10 points.
Dial-Up Metrics: Exceeded projections by 83.8 total points against strong opponents (4 games); underperformed by 9.8 points against weak competition (1 games).
#21: UNC Wilmington (14-2)
Against #153 Navy, #98 UNC Wilmington pulled off a big win, 87-57. The model expected a margin of 10, but they performed 20 points better than projected. Facing #246 Howard, #98 UNC Wilmington suffered a bad loss, 66-67. Favored by 16, they underperformed by 17 points.
Dial-Up Metrics: Exceeded projections by 20.5 total points against strong opponents (1 games); underperformed by 55.9 points against weak competition (6 games).
#22: Michigan (13-0)
Against #3 Gonzaga, #1 Michigan pulled off a big win, 101-61. The model expected a margin of 1, but they performed outpacing the projection by 39.
Dial-Up Metrics: Exceeded projections by 298.4 total points against strong opponents (10 games).
#23: Youngstown St (8-8)
Against #116 Grand Canyon, #188 Youngstown St pulled off a big win, 90-81. The model expected a margin of -7, but they performed beating the line by 16. Facing #248 Detroit Mercy, #188 Youngstown St suffered a bad loss, 68-73. Favored by 13, they underperformed by 18 points.
Dial-Up Metrics: Exceeded projections by 16.1 total points against strong opponents (1 games); underperformed by 27.3 points against weak competition (2 games).
#24: Incarnate Word (8-6)
Against #92 McNeese, #265 Incarnate Word pulled off a big win, 71-67. The model expected a margin of -14, but they performed +18 versus projection. Facing #251 New Orleans, #265 Incarnate Word suffered a bad loss, 83-84. Favored by 11, they underperformed by 12 points.
Dial-Up Metrics: Exceeded projections by 17.8 total points against strong opponents (1 games); underperformed by 11.9 points against weak competition (1 games).
#25: Bradley (10-6)
Against #124 Liberty, #131 Bradley pulled off a big win, 74-64. The model expected a margin of -9, but they performed 19 points better than projected. Facing #195 UT Martin, #131 Bradley suffered a bad loss, 67-78. Favored by 16, they underperformed by 27 points.
Dial-Up Metrics: Exceeded projections by 19.1 total points against strong opponents (1 games); underperformed by 31.8 points against weak competition (3 games).
What This Means
These rankings highlight teams that are dangerous underdogs but risky favorites. They have the ceiling to beat anyone in the country but the floor to lose to anyone.
Actionable Advice
- High Value as Underdogs: These teams often perform best when the lights are brightest. Look for them to cover spreads or pull off moneyline upsets against Top 50 competition.
- High Risk as Favorites: Be extremely cautious backing these teams as double-digit favorites against sub-200 opponents. Their tendency to “phone it in” makes them prime candidates to let inferior teams hang around and cover the spread.
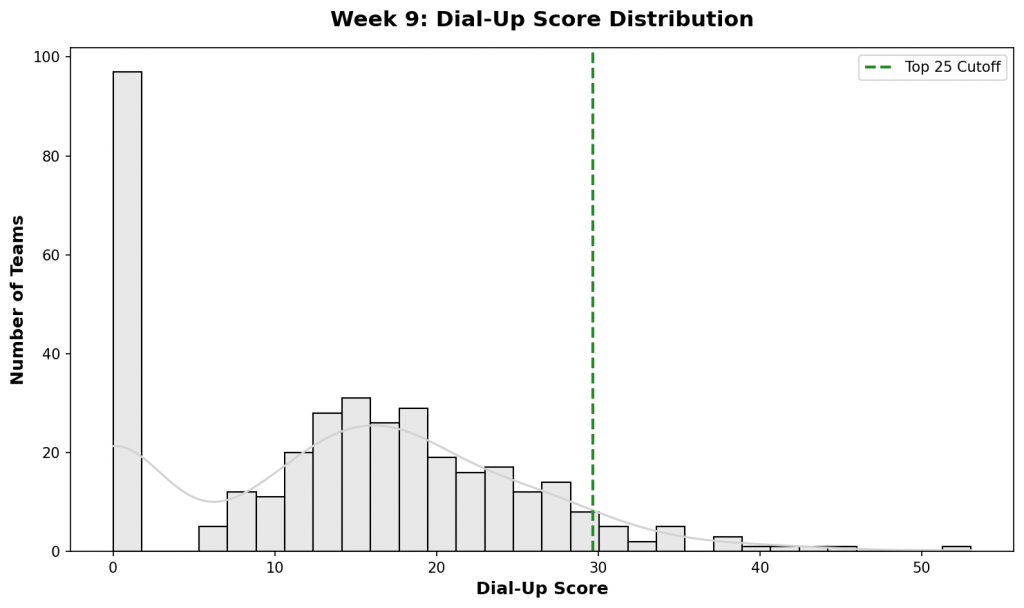
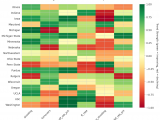
Figure 4: Distribution of Dial-Up scores across all Division I teams. The top 25 teams (highlighted in green) represent those with the most extreme performance splits based on opponent quality.
Check back next week for updated rankings.