West Coast Update: Week 9
January 5, 2026The West Coast enters Week 9 with teams showing diverse trending patterns. This analysis examines each team’s performance trends using MACD (Moving Average Convergence Divergence) indicators to identify not just where teams stand, but where they’re headed.
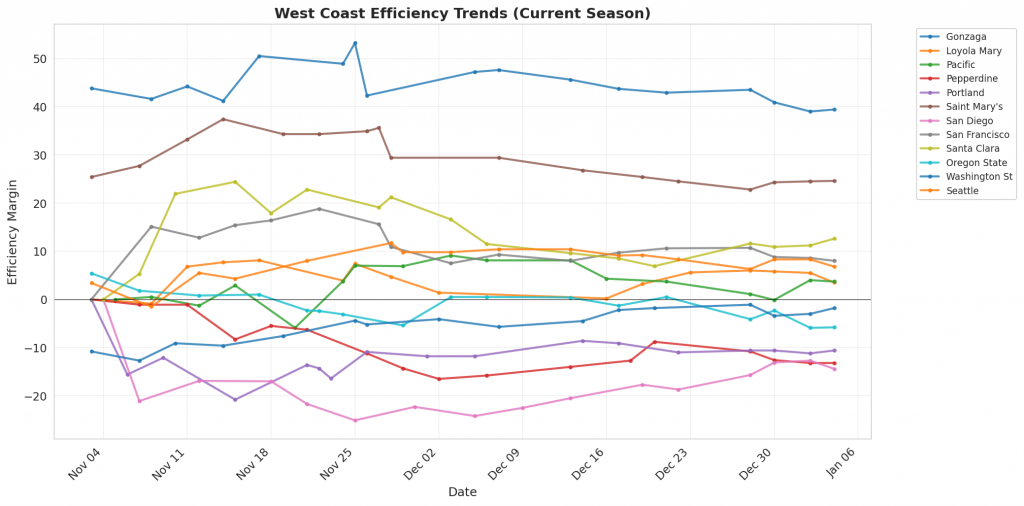
Figure 1: Efficiency margin trends for West Coast teams throughout the season. Teams trending upward show improving performance, while downward trends indicate struggles.
Conference Snapshot
- Week Dates: December 29 – January 04, 2026
- Trending Up (Efficiency): Gonzaga, Pacific, Saint Mary’s, San Diego, Santa Clara
- Trending Down (Efficiency): Loyola Mary, Pepperdine, Portland, San Francisco, Oregon State
Team-by-Team Analysis
Gonzaga
Record: 16-1 | Elo: 1749.3 (ranked 4 of 365) | Efficiency Margin: +39.35 (ranked 4 of 365)
Offensive Trends:
- Adj Off Eff (Adjusted Offensive Efficiency): Currently ranked 11 of 365 in D1. Trending up strongly 🟢.
- 2Pt Rate (2 Point Attempts/FGA (%)): Currently ranked 21 of 365 in D1. Trending up strongly 🟢.
Defensive Trends:
- Opp FT Rate (Opp FTA/FGA (%)): Currently ranked 123 of 365 in D1. Trending down strongly 🟢.
- Opp 3PA Per Poss (Opp 3 Point Attempts Per Possession (%)): Currently ranked 271 of 365 in D1. Trending up strongly 🔴.
Loyola Mary
Record: 10-7 | Elo: 1497.6 (ranked 195 of 365) | Efficiency Margin: +3.49 (ranked 136 of 365)
Offensive Trends:
- Shooting (Shooting): Currently ranked 124 of 365 in D1. Trending down strongly 🔴.
- FG Pct (Field Goal Percentage (FGM/FGA)): Currently ranked 130 of 365 in D1. Trending down strongly 🔴.
Defensive Trends:
- Opp FGM Per Poss (Opp FG Makes Per Possession (%)): Currently ranked 121 of 365 in D1. Trending up strongly 🔴.
- Opp 2Pt Rate (Opp 2 Point Attempts/FGA (%)): Currently ranked 327 of 365 in D1. Trending up strongly 🔴.
Oregon State
Record: 8-9 | Elo: 1485.3 (ranked 210 of 365) | Efficiency Margin: -5.81 (ranked 206 of 365)
Offensive Trends:
- Off Reb Pct (Offensive Rebounding): Currently ranked 325 of 365 in D1. Trending down strongly 🔴.
- FGM Per Poss (Field Goal Makes Per Possession (%)): Currently ranked 328 of 365 in D1. Trending down strongly 🔴.
Defensive Trends:
- Opp Shooting (Opp Shooting): Currently ranked 178 of 365 in D1. Trending up strongly 🔴.
- Def Reb Pct (Defensive Rebounding): Currently ranked 290 of 365 in D1. Trending down strongly 🔴.
Pacific
Record: 11-6 | Elo: 1417.2 (ranked 290 of 365) | Efficiency Margin: +3.74 (ranked 134 of 365)
Offensive Trends:
- Shooting (Shooting): Currently ranked 89 of 365 in D1. Trending up strongly 🟢.
- Turnovers (Turnovers): Currently ranked 347 of 365 in D1. Trending up strongly 🔴.
Defensive Trends:
- Def Reb Pct (Defensive Rebounding): Currently ranked 8 of 365 in D1. Trending up strongly 🟢.
- Opp FGM Per Poss (Opp FG Makes Per Possession (%)): Currently ranked 63 of 365 in D1. Trending down strongly 🟢.
Pepperdine
Record: 5-12 | Elo: 1373.1 (ranked 330 of 365) | Efficiency Margin: -13.18 (ranked 269 of 365)
Offensive Trends:
- Turnovers (Turnovers): Currently ranked 279 of 365 in D1. Trending up strongly 🔴.
- Off Reb Pct (Offensive Rebounding): Currently ranked 296 of 365 in D1. Trending down strongly 🔴.
Defensive Trends:
- Opp Turnovers (Opp Turnovers): Currently ranked 177 of 365 in D1. Trending up strongly 🔴.
- Opp FT Pct (Opp FTM/FTA (%)): Currently ranked 339 of 365 in D1. Trending up strongly 🔴.
Portland
Record: 7-10 | Elo: 1406.0 (ranked 301 of 365) | Efficiency Margin: -10.63 (ranked 247 of 365)
Offensive Trends:
- Shooting (Shooting): Currently ranked 139 of 365 in D1. Trending down strongly 🔴.
- FGA Per Poss (Field Goal Attempts Per Possession (%)): Currently ranked 323 of 365 in D1. Trending up strongly 🟢.
Defensive Trends:
- Def Reb Pct (Defensive Rebounding): Currently ranked 271 of 365 in D1. Trending down strongly 🔴.
- Opp FT Rate (Opp FTA/FGA (%)): Currently ranked 136 of 365 in D1. Trending up strongly 🔴.
Saint Mary’s
Record: 15-2 | Elo: 1725.6 (ranked 8 of 365) | Efficiency Margin: +24.61 (ranked 27 of 365)
Offensive Trends:
- FG Pct (Field Goal Percentage (FGM/FGA)): Currently ranked 87 of 365 in D1. Trending up strongly 🟢.
- 3Pt Pct (3 Point FGM/FGA (%)): Currently ranked 53 of 365 in D1. Trending up strongly 🟢.
Defensive Trends:
- Opp FT Rate (Opp FTA/FGA (%)): Currently ranked 8 of 365 in D1. Trending down strongly 🟢.
- Opp FGM Per Poss (Opp FG Makes Per Possession (%)): Currently ranked 122 of 365 in D1. Trending up strongly 🔴.
San Diego
Record: 6-10 | Elo: 1371.6 (ranked 333 of 365) | Efficiency Margin: -14.36 (ranked 280 of 365)
Offensive Trends:
- Off Reb Pct (Offensive Rebounding): Currently ranked 292 of 365 in D1. Trending down strongly 🔴.
- Adj Off Eff (Adjusted Offensive Efficiency): Currently ranked 259 of 365 in D1. Trending up strongly 🟢.
Defensive Trends:
- Def Reb Pct (Defensive Rebounding): Currently ranked 359 of 365 in D1. Trending down strongly 🔴.
- Opp FT Rate (Opp FTA/FGA (%)): Currently ranked 238 of 365 in D1. Trending down strongly 🟢.
San Francisco
Record: 11-6 | Elo: 1602.2 (ranked 71 of 365) | Efficiency Margin: +7.98 (ranked 105 of 365)
Offensive Trends:
- Shooting (Shooting): Currently ranked 155 of 365 in D1. Trending down strongly 🔴.
- FT Rate (FTA/FGA (%)): Currently ranked 47 of 365 in D1. Trending up strongly 🟢.
Defensive Trends:
- Def Reb Pct (Defensive Rebounding): Currently ranked 43 of 365 in D1. Trending up strongly 🟢.
- Opp 2Pt Rate (Opp 2 Point Attempts/FGA (%)): Currently ranked 238 of 365 in D1. Trending down strongly 🟢.
Santa Clara
Record: 13-4 | Elo: 1607.2 (ranked 66 of 365) | Efficiency Margin: +12.65 (ranked 73 of 365)
Offensive Trends:
- Off Reb Pct (Offensive Rebounding): Currently ranked 12 of 365 in D1. Trending up strongly 🟢.
- FGM Per Poss (Field Goal Makes Per Possession (%)): Currently ranked 34 of 365 in D1. Trending up strongly 🟢.
Defensive Trends:
- Opp Turnovers (Opp Turnovers): Currently ranked 25 of 365 in D1. Trending up strongly 🔴.
- Opp FGA Per Poss (Opp FG Attempts Per Possession (%)): Currently ranked 29 of 365 in D1. Trending down strongly 🟢.
Seattle
Record: 12-5 | Elo: 1543.8 (ranked 123 of 365) | Efficiency Margin: +6.85 (ranked 115 of 365)
Offensive Trends:
- Turnovers (Turnovers): Currently ranked 199 of 365 in D1. Trending down strongly 🟢.
- Off Reb Pct (Offensive Rebounding): Currently ranked 314 of 365 in D1. Trending down strongly 🔴.
Defensive Trends:
- Opp Turnovers (Opp Turnovers): Currently ranked 30 of 365 in D1. Trending down strongly 🟢.
- Def Reb Pct (Defensive Rebounding): Currently ranked 252 of 365 in D1. Trending down strongly 🔴.
Washington St
Record: 7-9 | Elo: 1517.5 (ranked 156 of 365) | Efficiency Margin: -1.84 (ranked 176 of 365)
Offensive Trends:
- 2Pt Pct (2 Point FGM/FGA (%)): Currently ranked 131 of 365 in D1. Trending down strongly 🔴.
- Assists per FGM (Assists/FGM (%)): Currently ranked 333 of 365 in D1. Trending down strongly 🔴.
Defensive Trends:
- Opp Shooting (Opp Shooting): Currently ranked 239 of 365 in D1. Trending down strongly 🟢.
- Def Reb Pct (Defensive Rebounding): Currently ranked 3 of 365 in D1. Trending up strongly 🟢.
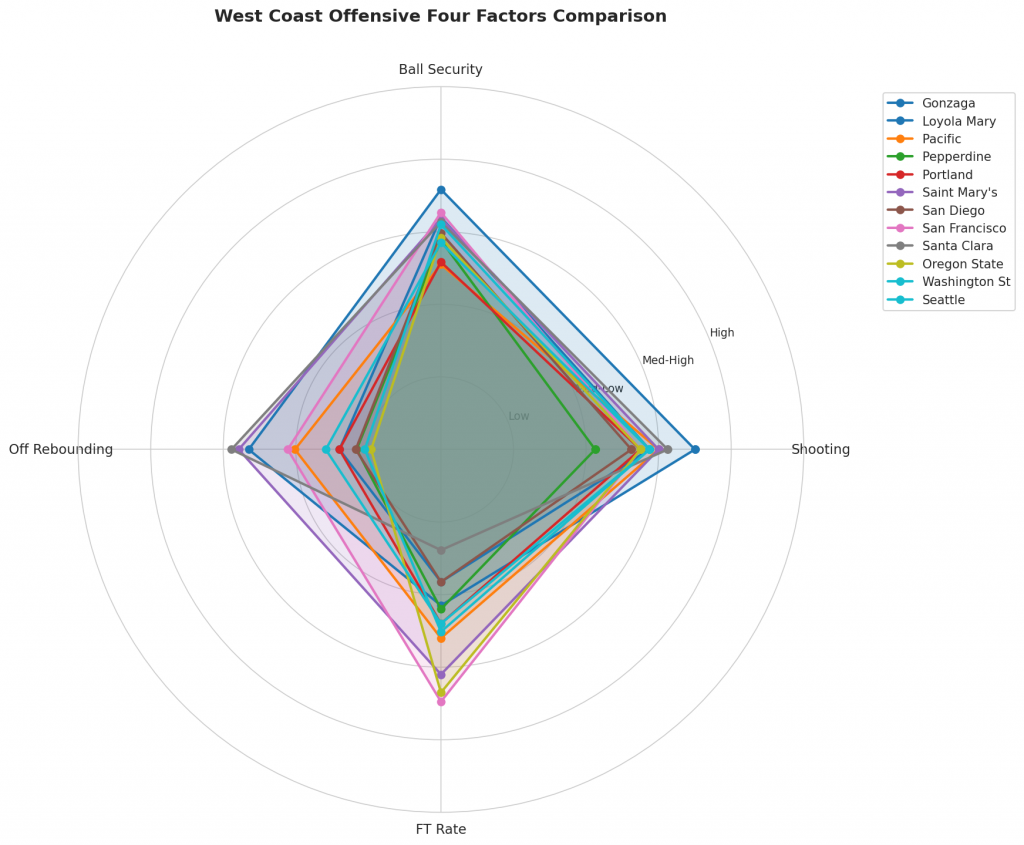
Figure 2: Offensive Four Factors comparison across West Coast teams. The radar chart shows each team’s shooting efficiency (eFG%), ball security (TOV%), offensive rebounding (OREB%), and free throw generation (FT Rate).
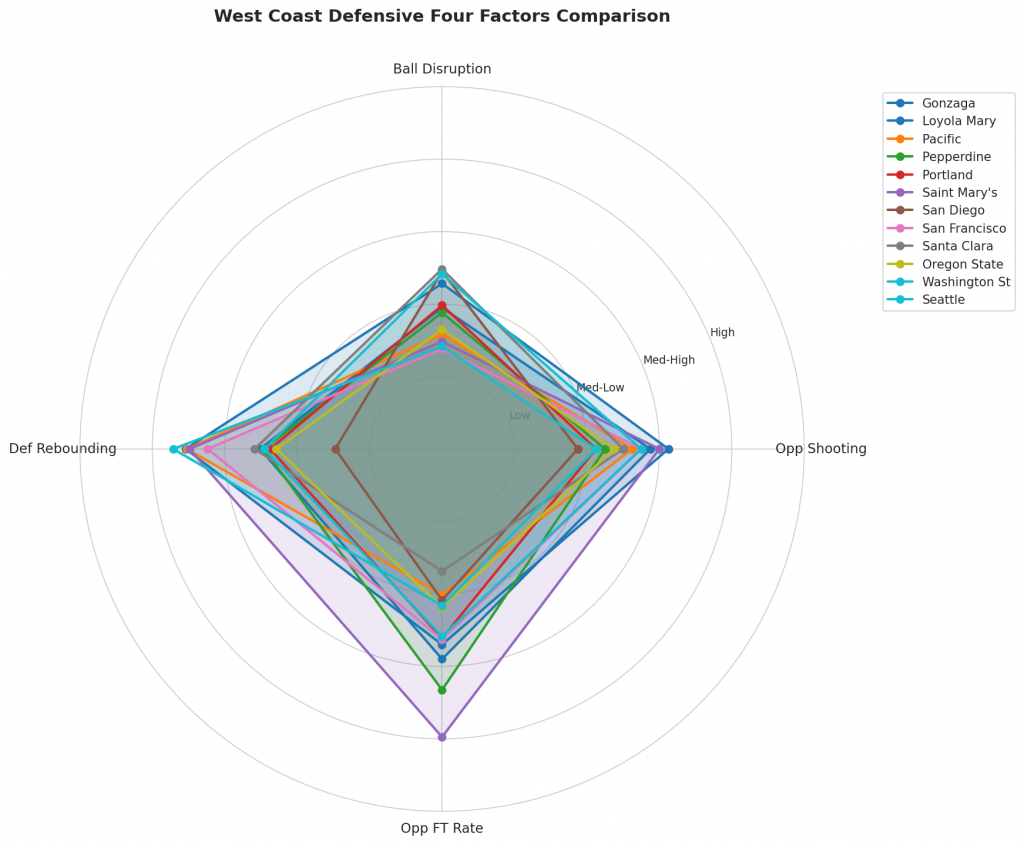
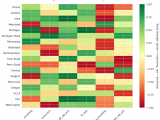
Figure 3: Defensive Four Factors comparison across West Coast teams. The radar chart shows each team’s opponent shooting defense (Opp eFG%), ball disruption (forcing TOV%), defensive rebounding (DREB%), and opponent free throw prevention (Opp FT Rate).
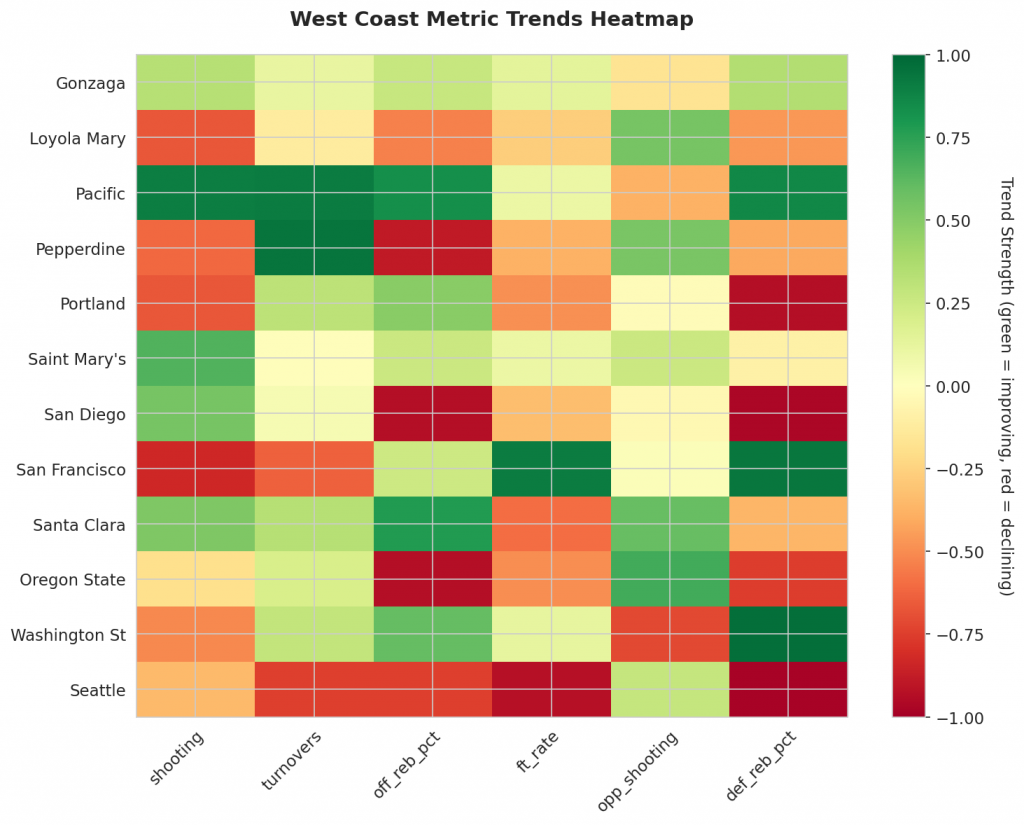
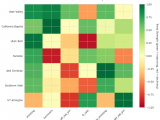
Figure 4: MACD trends heatmap showing which metrics are improving (green) or declining (red) for each team. Stronger colors indicate more pronounced trends.
Looking Ahead
As West Coast teams continue their season, the MACD trending indicators will help identify which teams are genuinely improving versus those riding unsustainable momentum. Check back next week for updated analysis.
Metrics Glossary
Four Factors (Dean Oliver’s framework for basketball success):
- eFG% (Effective Field Goal %): Field goal percentage adjusted for 3-pointers being worth more (FGM + 0.5×3PM) / FGA. Higher is better offensively, lower is better defensively.
- TOV% (Turnover Rate): Turnovers per 100 possessions. Lower is better offensively (taking care of the ball), higher is better defensively (forcing turnovers).
- OREB% / DREB% (Offensive/Defensive Rebound Rate): Percentage of available rebounds grabbed. Offensive rebounds create second-chance points; defensive rebounds end opponent possessions.
- FTR (Free Throw Rate): Free throws made per field goal attempt (FTM/FGA). Measures ability to get to the line AND convert. Higher is better offensively, lower is better defensively.
Other Metrics:
- Elo Rating: Chess-style rating system that updates based on game results and opponent strength. Higher Elo indicates stronger team.
- Efficiency Margin: Point differential per 100 possessions (Offensive Efficiency – Defensive Efficiency). Accounts for pace of play.
- MACD (Moving Average Convergence Divergence): Trend indicator comparing 12-game and 26-game exponential moving averages. Positive MACD = improving trend, Negative MACD = declining trend.
Analysis powered by HoopSci’s advanced metrics and MACD trending indicators.