Big Sky Update: Week 11
January 19, 2026The Big Sky enters Week 11 with teams showing diverse trending patterns. This analysis examines each team’s performance trends using MACD (Moving Average Convergence Divergence) indicators to identify not just where teams stand, but where they’re headed.
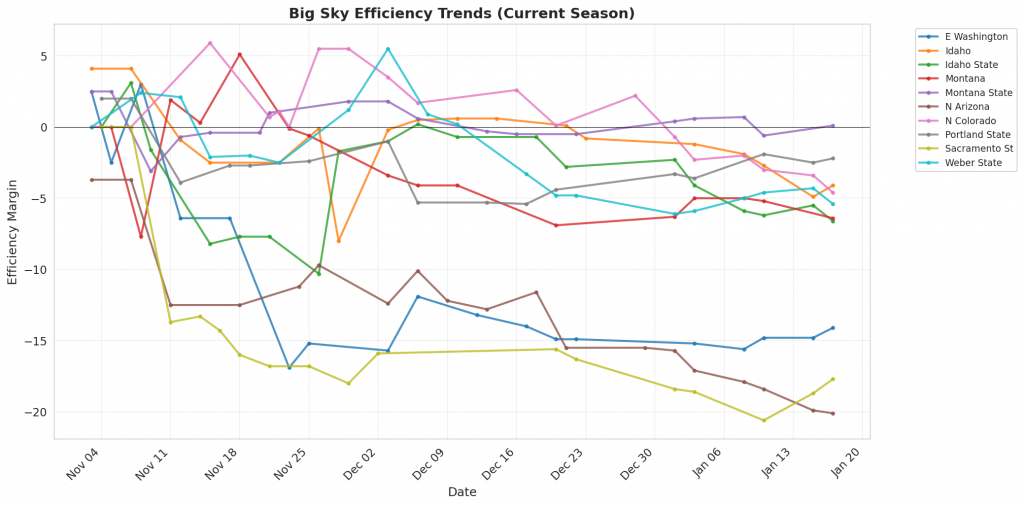
Figure 1: Efficiency margin trends for Big Sky teams throughout the season. Teams trending upward show improving performance, while downward trends indicate struggles.
Conference Snapshot
- Week Dates: January 12 – January 18, 2026
- Trending Up (Efficiency): Idaho State, Montana State, Portland State
- Trending Down (Efficiency): E Washington, Idaho, Montana, N Arizona, N Colorado
Team-by-Team Analysis
E Washington
Record: 4-14 | Elo: 1396.7 (ranked 310 of 365) | Efficiency Margin: -14.14 (ranked 280 of 365)
Offensive Trends:
- FT Rate (FTA/FGA (%)): Currently ranked 248 of 365 in D1. Trending up strongly 🟢.
- 2Pt Rate (2 Point Attempts/FGA (%)): Currently ranked 93 of 365 in D1. Trending up strongly 🟢.
Defensive Trends:
- Opp 3Pt Pct (Opp 3 Point FGM/FGA (%)): Currently ranked 324 of 365 in D1. Trending down strongly 🟢.
- Opp FTM Per Poss (Opp Free Throw Makes Per Possession (%)): Currently ranked 260 of 365 in D1. Trending up strongly 🔴.
Idaho
Record: 11-7 | Elo: 1460.8 (ranked 242 of 365) | Efficiency Margin: -4.08 (ranked 195 of 365)
Offensive Trends:
- Off Reb Pct (Offensive Rebounding): Currently ranked 217 of 365 in D1. Trending down strongly 🔴.
- FT Rate (FTA/FGA (%)): Currently ranked 116 of 365 in D1. Trending up strongly 🟢.
Defensive Trends:
- Opp Shooting (Opp Shooting): Currently ranked 223 of 365 in D1. Trending down strongly 🟢.
- Opp Turnovers (Opp Turnovers): Currently ranked 228 of 365 in D1. Trending up strongly 🔴.
Idaho State
Record: 10-9 | Elo: 1448.1 (ranked 254 of 365) | Efficiency Margin: -6.56 (ranked 215 of 365)
Offensive Trends:
- FT Rate (FTA/FGA (%)): Currently ranked 75 of 365 in D1. Trending up strongly 🟢.
- Adj Off Eff (Adjusted Offensive Efficiency): Currently ranked 127 of 365 in D1. Trending up strongly 🟢.
Defensive Trends:
- Opp Turnovers (Opp Turnovers): Currently ranked 223 of 365 in D1. Trending down strongly 🟢.
- Opp FT Rate (Opp FTA/FGA (%)): Currently ranked 264 of 365 in D1. Trending up strongly 🔴.
Montana
Record: 9-8 | Elo: 1546.6 (ranked 120 of 365) | Efficiency Margin: -6.44 (ranked 213 of 365)
Offensive Trends:
- Shooting (Shooting): Currently ranked 66 of 365 in D1. Trending down strongly 🔴.
- Turnovers (Turnovers): Currently ranked 342 of 365 in D1. Trending up strongly 🔴.
Defensive Trends:
- Opp FG Pct (%) (Opp FGM/FGA (%)): Currently ranked 189 of 365 in D1. Trending down strongly 🟢.
- Opp 2PM Per Poss (Opp 2 Point Makes Per Possession (%)): Currently ranked 325 of 365 in D1. Trending down strongly 🟢.
Montana State
Record: 10-8 | Elo: 1498.5 (ranked 191 of 365) | Efficiency Margin: +0.08 (ranked 158 of 365)
Offensive Trends:
- Off Reb Pct (Offensive Rebounding): Currently ranked 274 of 365 in D1. Trending up strongly 🟢.
- 2Pt Pct (2 Point FGM/FGA (%)): Currently ranked 52 of 365 in D1. Trending down strongly 🔴.
Defensive Trends:
- Opp 2Pt Rate (Opp 2 Point Attempts/FGA (%)): Currently ranked 307 of 365 in D1. Trending down strongly 🟢.
- Opp 2PM Per Poss (Opp 2 Point Makes Per Possession (%)): Currently ranked 281 of 365 in D1. Trending down strongly 🟢.
N Arizona
Record: 6-13 | Elo: 1380.7 (ranked 327 of 365) | Efficiency Margin: -20.05 (ranked 324 of 365)
Offensive Trends:
- Off Reb Pct (Offensive Rebounding): Currently ranked 322 of 365 in D1. Trending down strongly 🔴.
- FGA Per Poss (Field Goal Attempts Per Possession (%)): Currently ranked 225 of 365 in D1. Trending down strongly 🔴.
Defensive Trends:
- Def Reb Pct (Defensive Rebounding): Currently ranked 289 of 365 in D1. Trending down strongly 🔴.
- Opp FGA Per Poss (Opp FG Attempts Per Possession (%)): Currently ranked 265 of 365 in D1. Trending up strongly 🔴.
N Colorado
Record: 11-8 | Elo: 1533.3 (ranked 137 of 365) | Efficiency Margin: -4.64 (ranked 200 of 365)
Offensive Trends:
- Off Reb Pct (Offensive Rebounding): Currently ranked 325 of 365 in D1. Trending down strongly 🔴.
- 3Pt Pct (3 Point FGM/FGA (%)): Currently ranked 90 of 365 in D1. Trending down strongly 🔴.
Defensive Trends:
- Def Reb Pct (Defensive Rebounding): Currently ranked 30 of 365 in D1. Trending down strongly 🔴.
- Opp FT Rate (Opp FTA/FGA (%)): Currently ranked 275 of 365 in D1. Trending up strongly 🔴.
Portland State
Record: 11-5 | Elo: 1522.4 (ranked 150 of 365) | Efficiency Margin: -2.24 (ranked 182 of 365)
Offensive Trends:
- 2PA Per Poss (2 Point Attempts Per Possession (%)): Currently ranked 115 of 365 in D1. Trending down strongly 🔴.
- FTM Per Poss (Free Throw Makes Per Possession (%)): Currently ranked 234 of 365 in D1. Trending up strongly 🟢.
Defensive Trends:
- Def Reb Pct (Defensive Rebounding): Currently ranked 40 of 365 in D1. Trending up strongly 🟢.
- Opp FGM Per Poss (Opp FG Makes Per Possession (%)): Currently ranked 19 of 365 in D1. Trending down strongly 🟢.
Sacramento St
Record: 6-11 | Elo: 1331.0 (ranked 359 of 365) | Efficiency Margin: -17.67 (ranked 313 of 365)
Offensive Trends:
- Turnovers (Turnovers): Currently ranked 108 of 365 in D1. Trending down strongly 🟢.
- Off Reb Pct (Offensive Rebounding): Currently ranked 240 of 365 in D1. Trending down strongly 🔴.
Defensive Trends:
- Opp 2Pt Rate (Opp 2 Point Attempts/FGA (%)): Currently ranked 162 of 365 in D1. Trending up strongly 🔴.
- Opp 2PM Per Poss (Opp 2 Point Makes Per Possession (%)): Currently ranked 289 of 365 in D1. Trending up strongly 🔴.
Weber State
Record: 10-9 | Elo: 1439.8 (ranked 261 of 365) | Efficiency Margin: -5.43 (ranked 208 of 365)
Offensive Trends:
- Off Reb Pct (Offensive Rebounding): Currently ranked 129 of 365 in D1. Trending up strongly 🟢.
- FT Rate (FTA/FGA (%)): Currently ranked 53 of 365 in D1. Trending up strongly 🟢.
Defensive Trends:
- Opp 2Pt Rate (Opp 2 Point Attempts/FGA (%)): Currently ranked 249 of 365 in D1. Trending up strongly 🔴.
- Opp 3Pt Rate (Opp 3 Point Attempts/FGA (%)): Currently ranked 117 of 365 in D1. Trending down strongly 🟢.
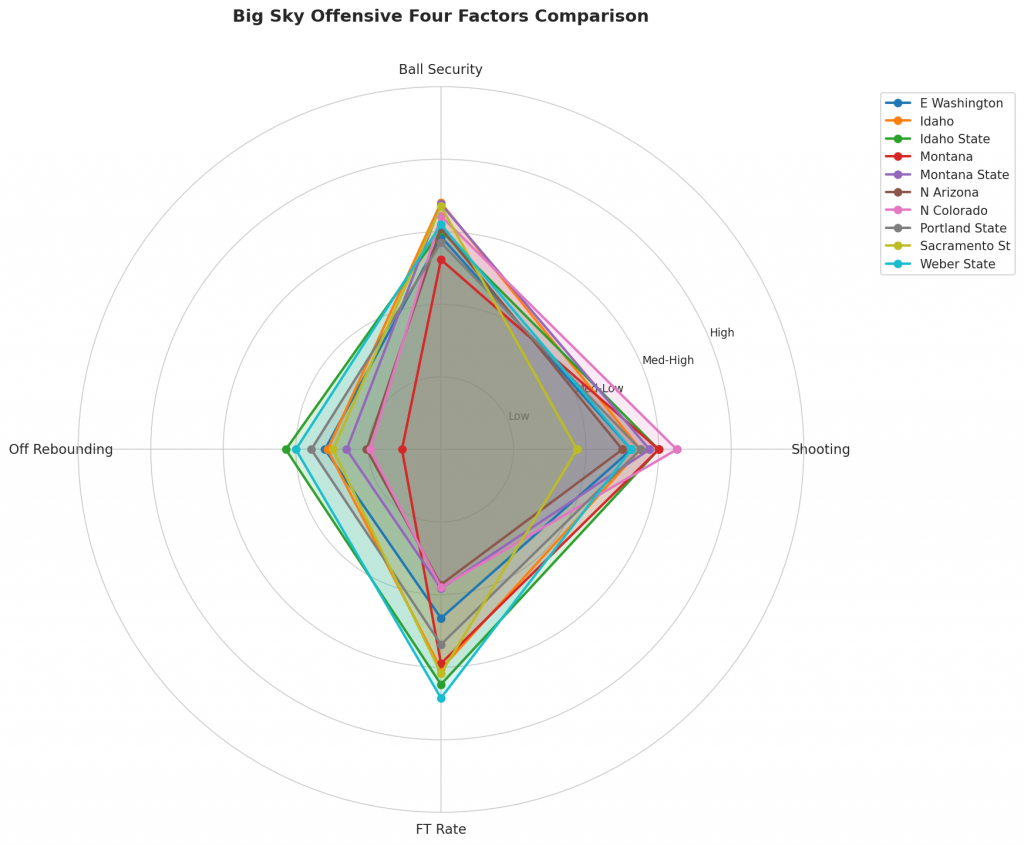
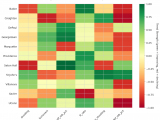
Figure 2: Offensive Four Factors comparison across Big Sky teams. The radar chart shows each team’s shooting efficiency (eFG%), ball security (TOV%), offensive rebounding (OREB%), and free throw generation (FT Rate).
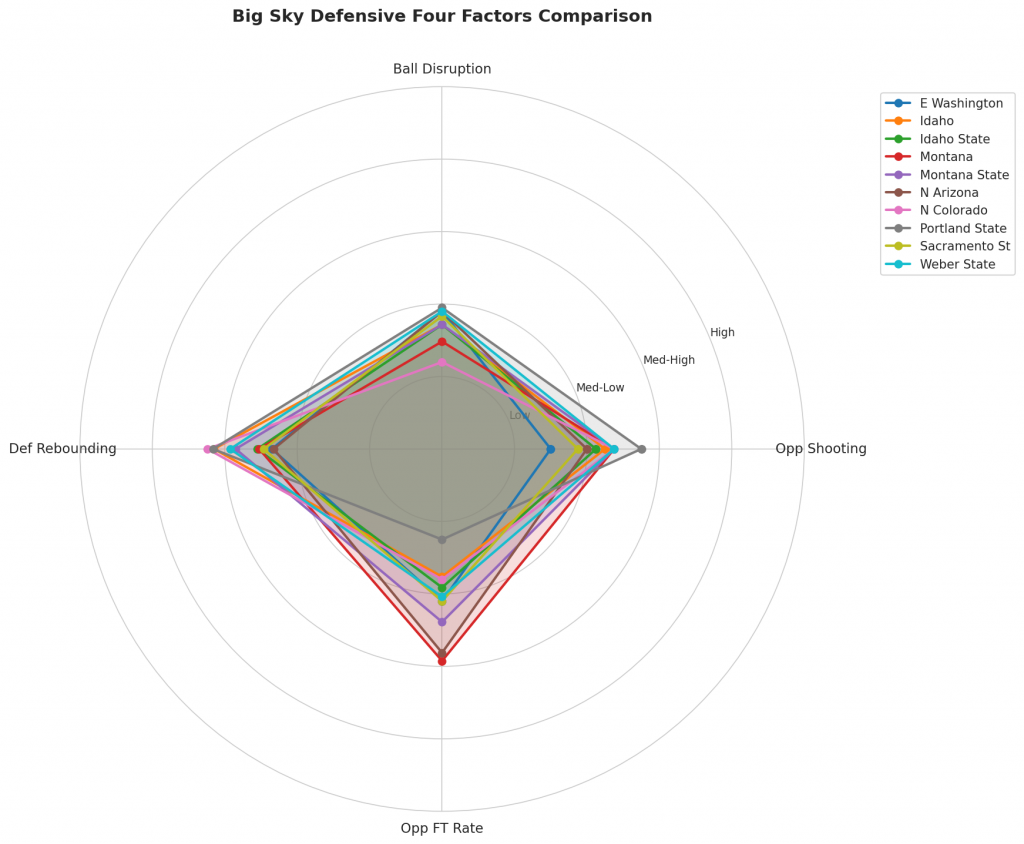
Figure 3: Defensive Four Factors comparison across Big Sky teams. The radar chart shows each team’s opponent shooting defense (Opp eFG%), ball disruption (forcing TOV%), defensive rebounding (DREB%), and opponent free throw prevention (Opp FT Rate).
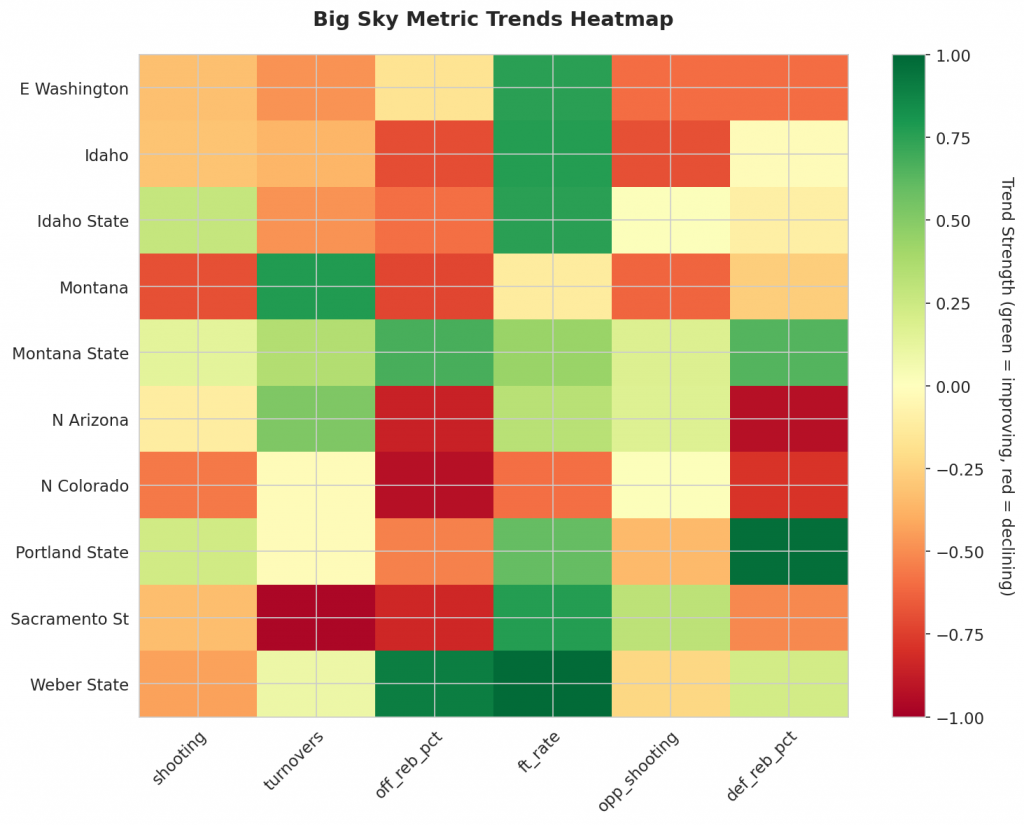
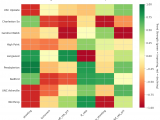
Figure 4: MACD trends heatmap showing which metrics are improving (green) or declining (red) for each team. Stronger colors indicate more pronounced trends.
Looking Ahead
As Big Sky teams continue their season, the MACD trending indicators will help identify which teams are genuinely improving versus those riding unsustainable momentum. Check back next week for updated analysis.
Metrics Glossary
Four Factors (Dean Oliver’s framework for basketball success):
- eFG% (Effective Field Goal %): Field goal percentage adjusted for 3-pointers being worth more (FGM + 0.5×3PM) / FGA. Higher is better offensively, lower is better defensively.
- TOV% (Turnover Rate): Turnovers per 100 possessions. Lower is better offensively (taking care of the ball), higher is better defensively (forcing turnovers).
- OREB% / DREB% (Offensive/Defensive Rebound Rate): Percentage of available rebounds grabbed. Offensive rebounds create second-chance points; defensive rebounds end opponent possessions.
- FTR (Free Throw Rate): Free throws made per field goal attempt (FTM/FGA). Measures ability to get to the line AND convert. Higher is better offensively, lower is better defensively.
Other Metrics:
- Elo Rating: Chess-style rating system that updates based on game results and opponent strength. Higher Elo indicates stronger team.
- Efficiency Margin: Point differential per 100 possessions (Offensive Efficiency – Defensive Efficiency). Accounts for pace of play.
- MACD (Moving Average Convergence Divergence): Trend indicator comparing 12-game and 26-game exponential moving averages. Positive MACD = improving trend, Negative MACD = declining trend.
Analysis powered by HoopSci’s advanced metrics and MACD trending indicators.