America East Update: Week 12
January 26, 2026America East Teams Showcase Varied Performance Trends in Week 12
The America East conference enters its 12th week of play, with each team exhibiting distinct trends that warrant examination. By analyzing key performance metrics such as rebounding percentage and opponent shooting percentage, we can gain insight into where these teams stand and where they’re headed.
Albany’s Mixed Bag
Albany’s offense has seen a decline in rebounding percentage, now standing at 27.5%. This trend could impact their scoring ability. Conversely, Albany’s defense has shown improvement in opponent shooting percentage, with an average of 53.0% (up from the season average). Additionally, they’re defending the paint well with a defensive rebound percentage of 68.2%.
Binghamton’s Struggles
Binghamton is struggling on both sides of the ball. Their offense has been trending downward in terms of rebounding percentage, now at 19.8%. This decline could hinder their ability to secure second-chance opportunities. On defense, Binghamton’s opponent shooting percentage has increased to 56%.
Maine’s Glimmers of Improvement
Maine is showing signs of improvement in certain areas. Their turnover count has decreased significantly, which could lead to more scoring opportunities. However, their offense has struggled with rebounding percentage, now at 19.5%. This trend may impact their overall performance.
UNH’s Shooting Surge
The University of New Hampshire is experiencing a boost in shooting efficiency, with an average opponent shooting percentage of 47.0%.
UMass Lowell and UMBC’s Trends
UMass Lowell has seen improvement in defensive rebounding percentage, now at 72.5%. Their offense has struggled with scoring efficiency, averaging 64.2 points per game.
UMBC is holding opponents to a low field goal percentage, with an average of 43.1%.
Bryant and NJIT’s Trends
Bryant’s offense has seen improvement in rebounding percentage, now at 28.5%. Their defense has struggled with opponent shooting efficiency, averaging 51.9% against them.
NJIT’s defense has excelled in defending the paint, holding opponents to a low defensive rebound percentage of 63.4%.
Vermont and Albany (Continued)
Vermont’s offense has shown improvement in scoring efficiency, averaging 69.8 points per game. However, their defense has struggled with opponent shooting percentage, averaging 53.1%.
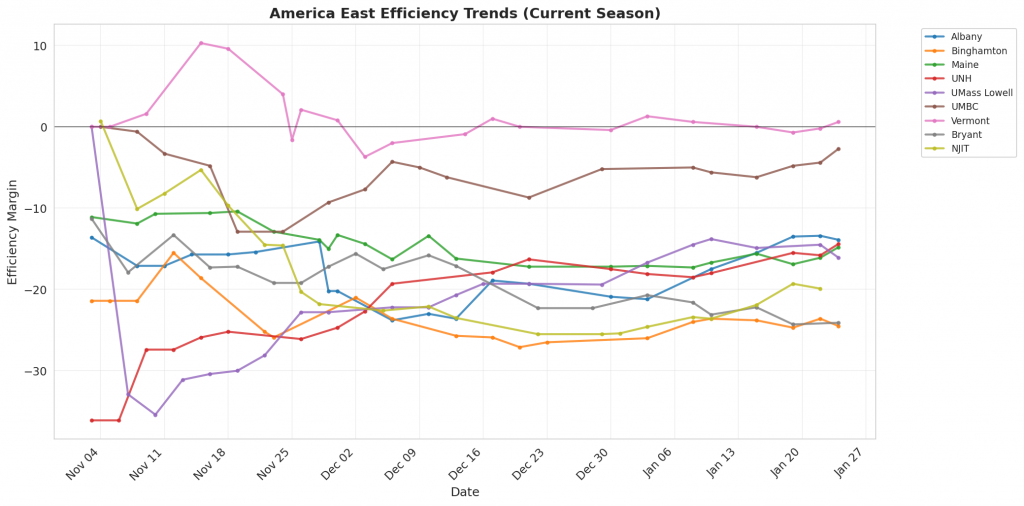
Figure 1: Efficiency margin trends for America East teams throughout the season. Teams trending upward show improving performance, while downward trends indicate struggles.
Conference Snapshot
- Week Dates: January 19 – January 25, 2026
- Trending Up (Efficiency): Albany, UNH, UMBC, NJIT
- Trending Down (Efficiency): Binghamton, Maine, UMass Lowell, Vermont, Bryant
Team-by-Team Analysis
Albany
Record: 7-14 | Elo: 1411.5 (ranked 291 of 365) | Efficiency Margin: -13.95 (ranked 281 of 365)
Offensive Trends:
- Off Reb Pct (Offensive Rebounding): Currently ranked 213 of 365 in D1. Trending down strongly 🔴.
- Turnovers (Turnovers): Currently ranked 246 of 365 in D1. Trending up moderately 🔴.
Defensive Trends:
- Opp Shooting (Opp Shooting): Currently ranked 258 of 365 in D1. Trending down strongly 🟢.
- Opp Turnovers (Opp Turnovers): Currently ranked 265 of 365 in D1. Trending down strongly 🔴.
Binghamton
Record: 2-18 | Elo: 1321.3 (ranked 358 of 365) | Efficiency Margin: -24.55 (ranked 347 of 365)
Offensive Trends:
- Off Reb Pct (Offensive Rebounding): Currently ranked 354 of 365 in D1. Trending down strongly 🔴.
- Turnovers (Turnovers): Currently ranked 333 of 365 in D1. Trending down moderately 🟢.
Defensive Trends:
- Opp Shooting (Opp Shooting): Currently ranked 327 of 365 in D1. Trending up strongly 🔴.
- Def Reb Pct (Defensive Rebounding): Currently ranked 52 of 365 in D1. Trending up strongly 🟢.
Bryant
Record: 6-14 | Elo: 1467.6 (ranked 234 of 365) | Efficiency Margin: -24.05 (ranked 346 of 365)
Offensive Trends:
- Shooting (Shooting): Currently ranked 358 of 365 in D1. Trending down strongly 🔴.
- Off Reb Pct (Offensive Rebounding): Currently ranked 309 of 365 in D1. Trending down moderately 🔴.
Defensive Trends:
- Opp Shooting (Opp Shooting): Currently ranked 187 of 365 in D1. Trending up strongly 🔴.
- Def Reb Pct (Defensive Rebounding): Currently ranked 320 of 365 in D1. Trending down strongly 🔴.
Maine
Record: 5-17 | Elo: 1405.8 (ranked 299 of 365) | Efficiency Margin: -14.82 (ranked 290 of 365)
Offensive Trends:
- Turnovers (Turnovers): Currently ranked 348 of 365 in D1. Trending down strongly 🟢.
- Off Reb Pct (Offensive Rebounding): Currently ranked 357 of 365 in D1. Trending down strongly 🔴.
Defensive Trends:
- Def Reb Pct (Defensive Rebounding): Currently ranked 308 of 365 in D1. Trending up strongly 🟢.
- Opp Turnovers (Opp Turnovers): Currently ranked 92 of 365 in D1. Trending down moderately 🔴.
NJIT
Record: 9-12 | Elo: 1376.0 (ranked 330 of 365) | Efficiency Margin: -19.91 (ranked 326 of 365)
Offensive Trends:
- Turnovers (Turnovers): Currently ranked 250 of 365 in D1. Trending down strongly 🟢.
- Shooting (Shooting): Currently ranked 342 of 365 in D1. Trending up moderately 🟢.
Defensive Trends:
- Def Reb Pct (Defensive Rebounding): Currently ranked 249 of 365 in D1. Trending up strongly 🟢.
- Opp Turnovers (Opp Turnovers): Currently ranked 279 of 365 in D1. Trending up moderately 🟢.
UMBC
Record: 12-7 | Elo: 1451.7 (ranked 248 of 365) | Efficiency Margin: -2.72 (ranked 190 of 365)
Offensive Trends:
- Turnovers (Turnovers): Currently ranked 89 of 365 in D1. Trending down strongly 🟢.
- Off Reb Pct (Offensive Rebounding): Currently ranked 344 of 365 in D1. Trending down strongly 🔴.
Defensive Trends:
- Opp Shooting (Opp Shooting): Currently ranked 180 of 365 in D1. Trending down strongly 🟢.
- Def Reb Pct (Defensive Rebounding): Currently ranked 84 of 365 in D1. Trending up moderately 🟢.
UMass Lowell
Record: 8-13 | Elo: 1445.8 (ranked 257 of 365) | Efficiency Margin: -16.05 (ranked 301 of 365)
Offensive Trends:
- Shooting (Shooting): Currently ranked 260 of 365 in D1. Trending down strongly 🔴.
- Turnovers (Turnovers): Currently ranked 320 of 365 in D1. Trending down moderately 🟢.
Defensive Trends:
- Def Reb Pct (Defensive Rebounding): Currently ranked 232 of 365 in D1. Trending up strongly 🟢.
- Opp Turnovers (Opp Turnovers): Currently ranked 291 of 365 in D1. Trending down moderately 🔴.
UNH
Record: 7-12 | Elo: 1392.3 (ranked 317 of 365) | Efficiency Margin: -14.41 (ranked 287 of 365)
Offensive Trends:
- Shooting (Shooting): Currently ranked 333 of 365 in D1. Trending up strongly 🟢.
- Turnovers (Turnovers): Currently ranked 177 of 365 in D1. Trending down moderately 🟢.
Defensive Trends:
- Def Reb Pct (Defensive Rebounding): Currently ranked 70 of 365 in D1. Trending up strongly 🟢.
- Opp Shooting (Opp Shooting): Currently ranked 191 of 365 in D1. Trending down moderately 🟢.
Vermont
Record: 13-8 | Elo: 1581.1 (ranked 84 of 365) | Efficiency Margin: +0.60 (ranked 155 of 365)
Offensive Trends:
- Turnovers (Turnovers): Currently ranked 38 of 365 in D1. Trending down moderately 🟢.
- Shooting (Shooting): Currently ranked 104 of 365 in D1. Trending down weakly 🔴.
Defensive Trends:
- Opp Shooting (Opp Shooting): Currently ranked 188 of 365 in D1. Trending down strongly 🟢.
- Opp Turnovers (Opp Turnovers): Currently ranked 343 of 365 in D1. Trending down moderately 🔴.
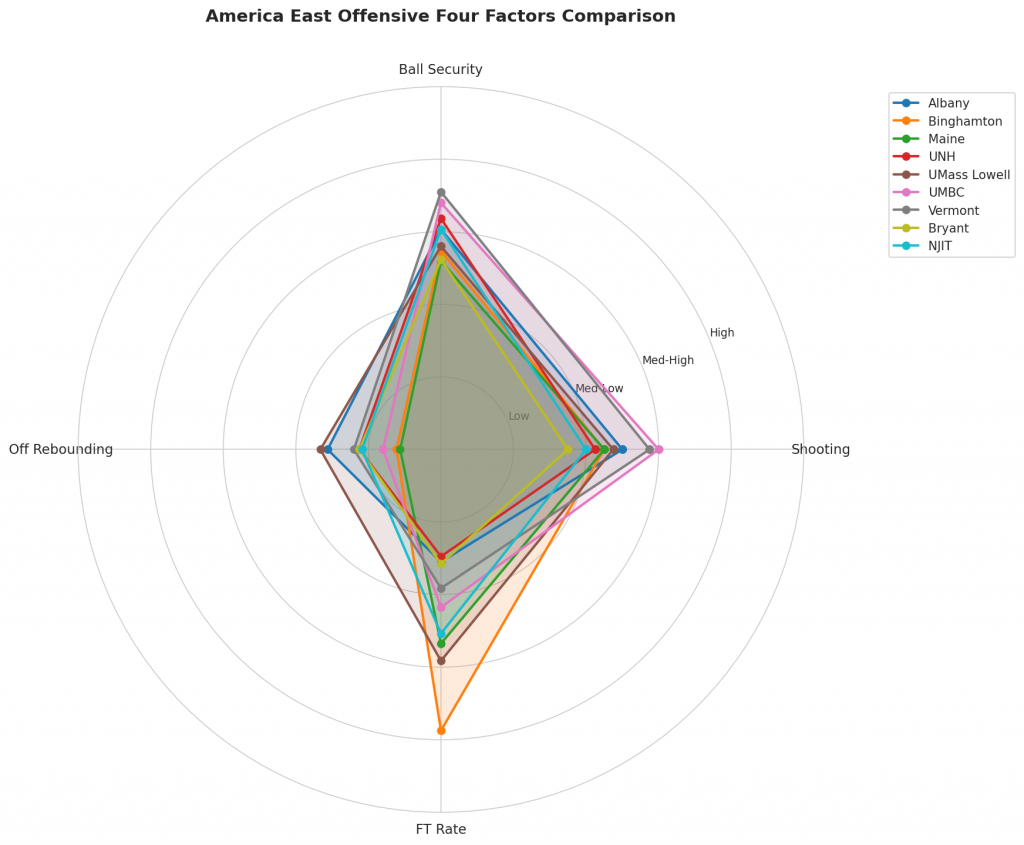
Figure 2: Offensive Four Factors comparison across America East teams. The radar chart shows each team’s shooting efficiency (eFG%), ball security (TOV%), offensive rebounding (OREB%), and free throw generation (FT Rate).
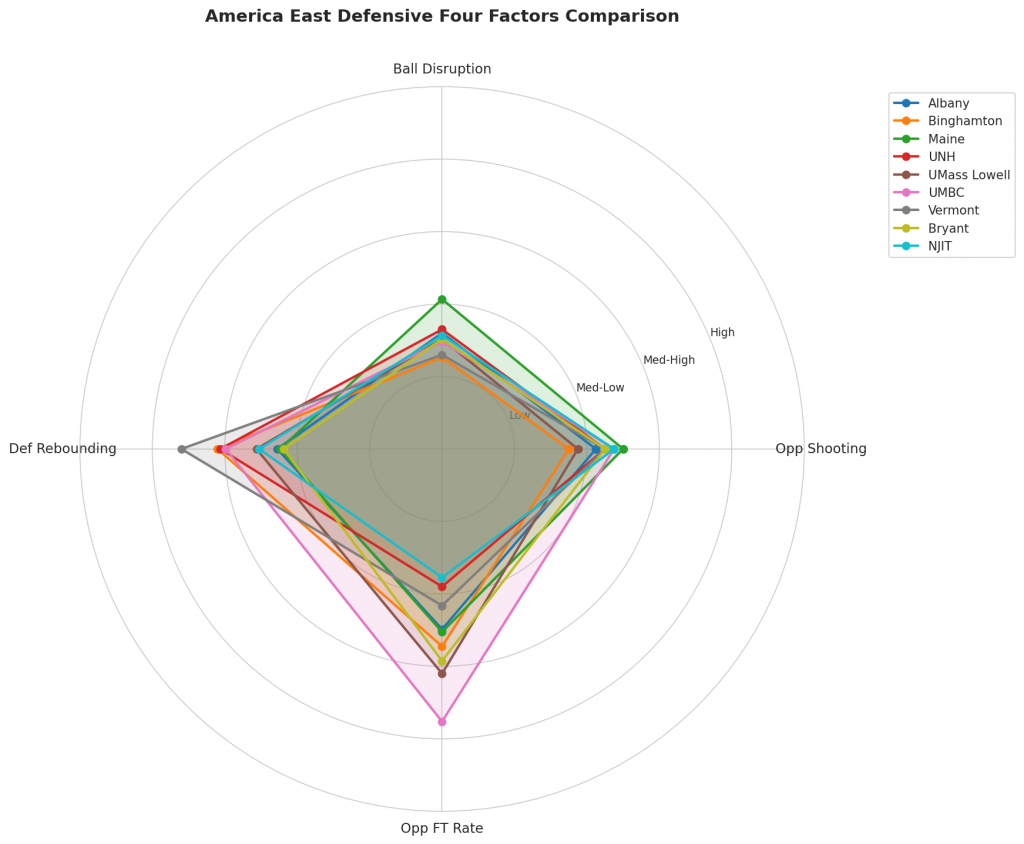
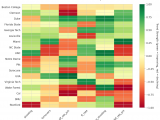
Figure 3: Defensive Four Factors comparison across America East teams. The radar chart shows each team’s opponent shooting defense (Opp eFG%), ball disruption (forcing TOV%), defensive rebounding (DREB%), and opponent free throw prevention (Opp FT Rate).
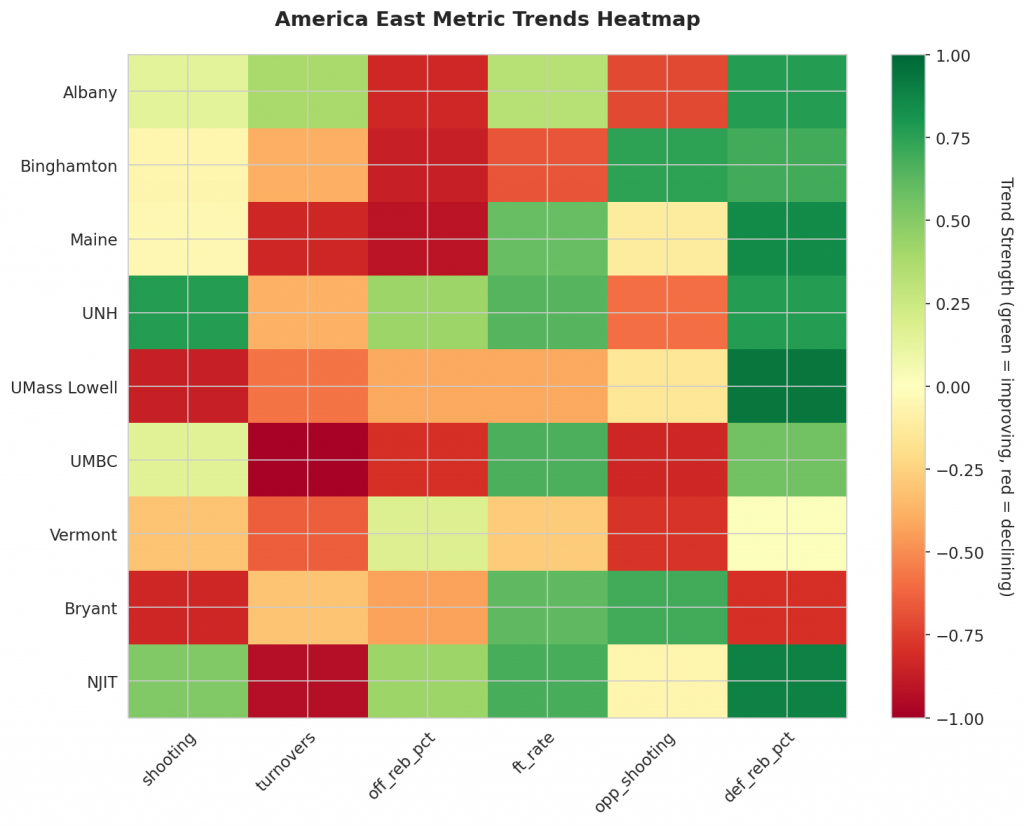
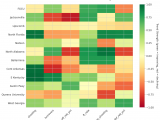
Figure 4: MACD trends heatmap showing which metrics are improving (green) or declining (red) for each team. Stronger colors indicate more pronounced trends.
Looking Ahead
America East Teams Face Key Trends as Regular Season Winds Down
As the college basketball regular season enters its final stretch, teams in the America East conference are navigating significant trends that will shape their postseason aspirations. Our analysis of momentum indicators reveals areas where teams are excelling and those that need improvement.
Offensive Struggles Mount for Albany and Binghamton
Albany’s struggles on the glass are a concern, as their off-rebound percentage (ORB%) has worsened throughout the season. This trend indicates a decline in their ability to secure second-chance opportunities, which may impact their overall scoring efficiency.
Similarly, Binghamton is facing issues in this area as well. Their ORB% has also declined, suggesting they are struggling to capitalize on loose balls and maintain possession.
Maine Shows Signs of Improvement
On the other hand, Maine’s turnover rate has improved significantly, a trend that is expected to continue. This decline in turnovers should allow them to maintain possession for longer periods, potentially leading to more scoring opportunities.
However, Maine also faces challenges on the glass, as their ORB% has worsened over the season. Like Albany and Binghamton, this trend indicates difficulties in securing second chances and maintaining control of rebounds.
Albany’s Defense Continues to Impress
In a contrasting narrative, Albany’s defense has shown marked improvement. Their opponents’ shooting efficiency momentum (OOPSHM%) has decreased throughout the season, suggesting their defensive strategy is paying dividends. Additionally, they have reduced their opponents’ turnover rate, making it harder for opposing teams to maintain possession.
Binghamton’s Defensive Woes
Binghamton’s defense faces challenges as their opponents’ shooting efficiency momentum has increased over the season. This trend indicates a decline in their ability to prevent scoring opportunities and limit opponents’ efficiency from the field.
The America East conference is now at a critical juncture, with teams vying for positioning ahead of the postseason. These trends will undoubtedly shape the narrative as the regular season winds down, and our analysis will continue next week to provide updated insights into team momentum.
Metrics Glossary
Four Factors (Dean Oliver’s framework for basketball success):
- eFG% (Effective Field Goal %): Field goal percentage adjusted for 3-pointers being worth more (FGM + 0.5×3PM) / FGA. Higher is better offensively, lower is better defensively.
- TOV% (Turnover Rate): Turnovers per 100 possessions. Lower is better offensively (taking care of the ball), higher is better defensively (forcing turnovers).
- OREB% / DREB% (Offensive/Defensive Rebound Rate): Percentage of available rebounds grabbed. Offensive rebounds create second-chance points; defensive rebounds end opponent possessions.
- FTR (Free Throw Rate): Free throws made per field goal attempt (FTM/FGA). Measures ability to get to the line AND convert. Higher is better offensively, lower is better defensively.
Other Metrics:
- Elo Rating: Chess-style rating system that updates based on game results and opponent strength. Higher Elo indicates stronger team.
- Efficiency Margin: Point differential per 100 possessions (Offensive Efficiency – Defensive Efficiency). Accounts for pace of play.
- MACD (Moving Average Convergence Divergence): Trend indicator comparing 12-game and 26-game exponential moving averages. Positive MACD = improving trend, Negative MACD = declining trend.
Analysis powered by HoopSci’s advanced metrics and MACD trending indicators.