Ivy Update: Week 12
January 26, 2026Ivy League Teams Show Diverse Performance Trends Heading into Week 12
The Ivy League enters its final stretch of the regular season, with teams displaying varied trends in performance. This analysis examines the momentum indicators for each team using Moving Average Convergence Divergence (MACD) to identify both current standing and future trajectory.
For those unfamiliar, MACD is a technical indicator used to gauge momentum by comparing two moving averages of different lengths. A positive MACD value indicates that short-term average growth exceeds long-term average growth, suggesting upward momentum, while a negative value suggests downward momentum.
Offensive Strengths and Weaknesses
Dartmouth’s improvement in turnover prevention is a notable trend, with an average of 0.172 turnovers per game decreasing over time. This strong performance suggests the team is getting better at minimizing mistakes on offense. In contrast, Brown’s shooting has been declining, averaging 0.48 points per possession.
Harvard is experiencing a significant uptick in shooting efficiency, with a season average of 0.54 points per possession trending upwards strongly. The team’s ability to capitalize on scoring opportunities is becoming more consistent. Additionally, Harvard’s turnover prevention has also seen improvement, averaging 0.157 turnovers per game and decreasing over time.
Defensive Strengths and Weaknesses
Columbia’s defensive rebounding percentage has been trending downwards, with an average of 0.748 rebounds per possession declining strongly. This decline in defensive prowess is a concern for the team. On the other hand, Penn’s ability to force turnovers from opponents is on the rise, averaging 0.146 turnovers forced per game and increasing over time.
Cornell’s opposition shooting has seen a significant uptick, with an average of 0.58 points allowed per possession trending upwards strongly. This increase in allowed scoring could be a challenge for the team’s defense. Princeton, meanwhile, is experiencing improvements on both sides of the ball: its opponents’ shooting percentage is trending downwards, averaging 0.51 points allowed per possession.
Turnover Prevention Analysis
A closer look at turnover prevention reveals that Harvard and Dartmouth are among the top performers in the league. However, Princeton’s slight decline in effectiveness may indicate a potential vulnerability moving forward.
By examining these key metrics, we gain insight into each team’s strengths and weaknesses, setting the stage for an intriguing conclusion to the regular season.
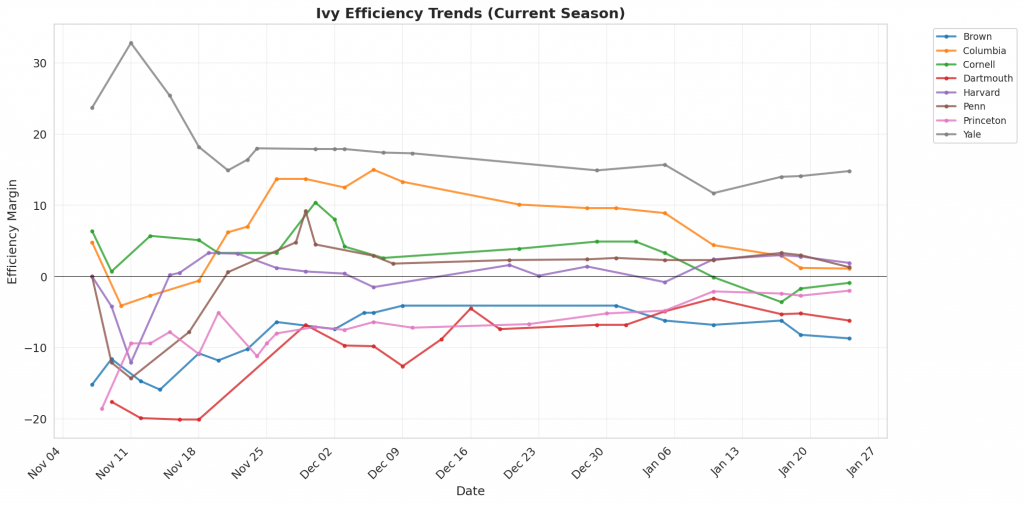
Figure 1: Efficiency margin trends for Ivy teams throughout the season. Teams trending upward show improving performance, while downward trends indicate struggles.
Conference Snapshot
- Week Dates: January 19 – January 25, 2026
- Trending Up (Efficiency): Dartmouth, Harvard
- Trending Down (Efficiency): Brown, Columbia, Cornell, Penn, Princeton
Team-by-Team Analysis
Brown
Record: 7-11 | Elo: 1449.9 (ranked 251 of 365) | Efficiency Margin: -8.72 (ranked 235 of 365)
Offensive Trends:
- Shooting (Shooting): Currently ranked 311 of 365 in D1. Trending down moderately 🔴.
- Turnovers (Turnovers): Currently ranked 289 of 365 in D1. Trending down moderately 🟢.
Defensive Trends:
- Opp Shooting (Opp Shooting): Currently ranked 82 of 365 in D1. Trending down weakly 🟢.
- Opp Turnovers (Opp Turnovers): Currently ranked 140 of 365 in D1. Trending down weakly 🔴.
Columbia
Record: 13-6 | Elo: 1488.4 (ranked 203 of 365) | Efficiency Margin: +1.14 (ranked 151 of 365)
Offensive Trends:
- Turnovers (Turnovers): Currently ranked 323 of 365 in D1. Trending up moderately 🔴.
- Off Reb Pct (Offensive Rebounding): Currently ranked 44 of 365 in D1. Trending up moderately 🟢.
Defensive Trends:
- Def Reb Pct (Defensive Rebounding): Currently ranked 55 of 365 in D1. Trending down strongly 🔴.
- Opp Turnovers (Opp Turnovers): Currently ranked 316 of 365 in D1. Trending down moderately 🔴.
Cornell
Record: 9-9 | Elo: 1550.9 (ranked 114 of 365) | Efficiency Margin: -0.92 (ranked 171 of 365)
Offensive Trends:
- Turnovers (Turnovers): Currently ranked 168 of 365 in D1. Trending down moderately 🟢.
- Off Reb Pct (Offensive Rebounding): Currently ranked 231 of 365 in D1. Trending up moderately 🟢.
Defensive Trends:
- Opp Shooting (Opp Shooting): Currently ranked 357 of 365 in D1. Trending up strongly 🔴.
- Opp Turnovers (Opp Turnovers): Currently ranked 305 of 365 in D1. Trending down moderately 🔴.
Dartmouth
Record: 9-9 | Elo: 1461.3 (ranked 238 of 365) | Efficiency Margin: -6.18 (ranked 211 of 365)
Offensive Trends:
- Turnovers (Turnovers): Currently ranked 273 of 365 in D1. Trending down strongly 🟢.
- Shooting (Shooting): Currently ranked 103 of 365 in D1. Trending up weakly 🟢.
Defensive Trends:
- Opp Shooting (Opp Shooting): Currently ranked 162 of 365 in D1. Trending up moderately 🔴.
- Opp Turnovers (Opp Turnovers): Currently ranked 359 of 365 in D1. Trending down moderately 🔴.
Harvard
Record: 10-9 | Elo: 1495.9 (ranked 194 of 365) | Efficiency Margin: +1.85 (ranked 142 of 365)
Offensive Trends:
- Shooting (Shooting): Currently ranked 77 of 365 in D1. Trending up strongly 🟢.
- Turnovers (Turnovers): Currently ranked 162 of 365 in D1. Trending down strongly 🟢.
Defensive Trends:
- Opp Shooting (Opp Shooting): Currently ranked 256 of 365 in D1. Trending up weakly 🔴.
- Opp Turnovers (Opp Turnovers): Currently ranked 113 of 365 in D1. Trending down weakly 🔴.
Penn
Record: 9-9 | Elo: 1449.3 (ranked 252 of 365) | Efficiency Margin: +1.32 (ranked 149 of 365)
Offensive Trends:
- Shooting (Shooting): Currently ranked 203 of 365 in D1. Trending down moderately 🔴.
- Turnovers (Turnovers): Currently ranked 131 of 365 in D1. Trending down weakly 🟢.
Defensive Trends:
- Opp Turnovers (Opp Turnovers): Currently ranked 269 of 365 in D1. Trending up strongly 🟢.
- Def Reb Pct (Defensive Rebounding): Currently ranked 222 of 365 in D1. Trending down moderately 🔴.
Princeton
Record: 7-13 | Elo: 1512.7 (ranked 161 of 365) | Efficiency Margin: -1.99 (ranked 181 of 365)
Offensive Trends:
- Turnovers (Turnovers): Currently ranked 137 of 365 in D1. Trending down strongly 🟢.
- Shooting (Shooting): Currently ranked 268 of 365 in D1. Trending down moderately 🔴.
Defensive Trends:
- Opp Shooting (Opp Shooting): Currently ranked 163 of 365 in D1. Trending down strongly 🟢.
- Opp Turnovers (Opp Turnovers): Currently ranked 314 of 365 in D1. Trending down strongly 🔴.
Yale
Record: 15-3 | Elo: 1681.7 (ranked 24 of 365) | Efficiency Margin: +14.82 (ranked 56 of 365)
Offensive Trends:
- Off Reb Pct (Offensive Rebounding): Currently ranked 64 of 365 in D1. Trending up moderately 🟢.
- Shooting (Shooting): Currently ranked 29 of 365 in D1. Trending down weakly 🔴.
Defensive Trends:
- Def Reb Pct (Defensive Rebounding): Currently ranked 194 of 365 in D1. Trending down moderately 🔴.
- Opp Shooting (Opp Shooting): Currently ranked 209 of 365 in D1. Trending down weakly 🟢.
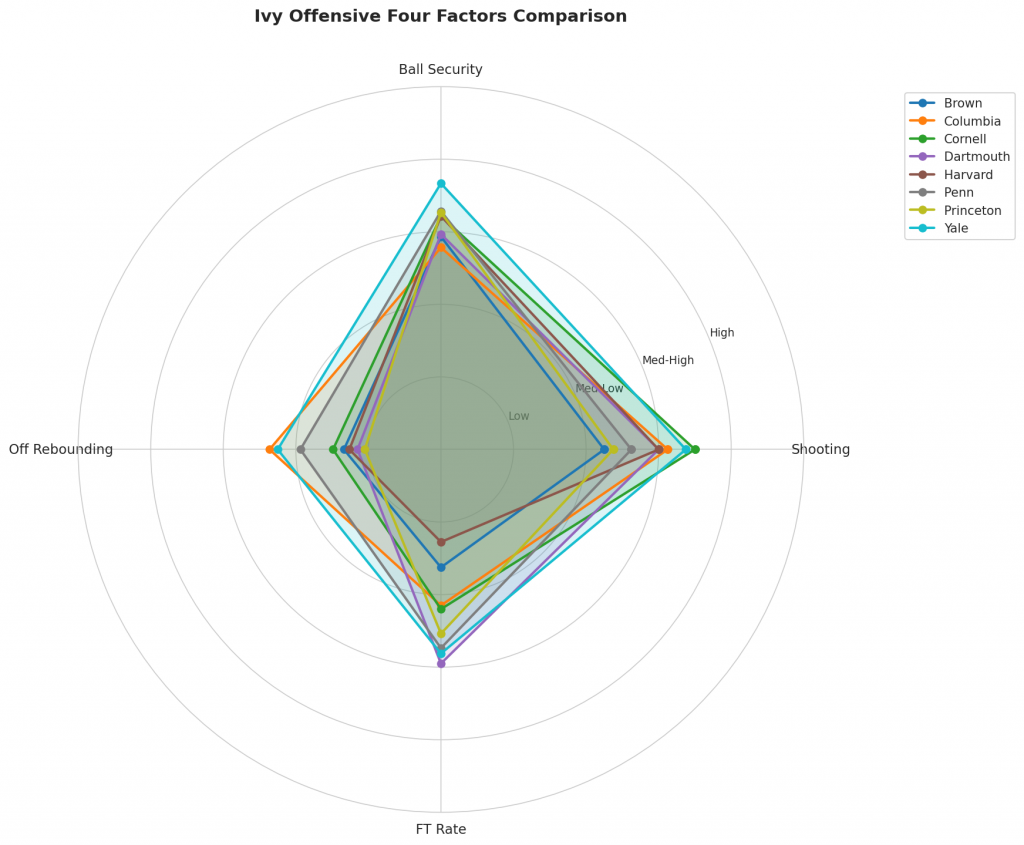
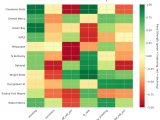
Figure 2: Offensive Four Factors comparison across Ivy teams. The radar chart shows each team’s shooting efficiency (eFG%), ball security (TOV%), offensive rebounding (OREB%), and free throw generation (FT Rate).
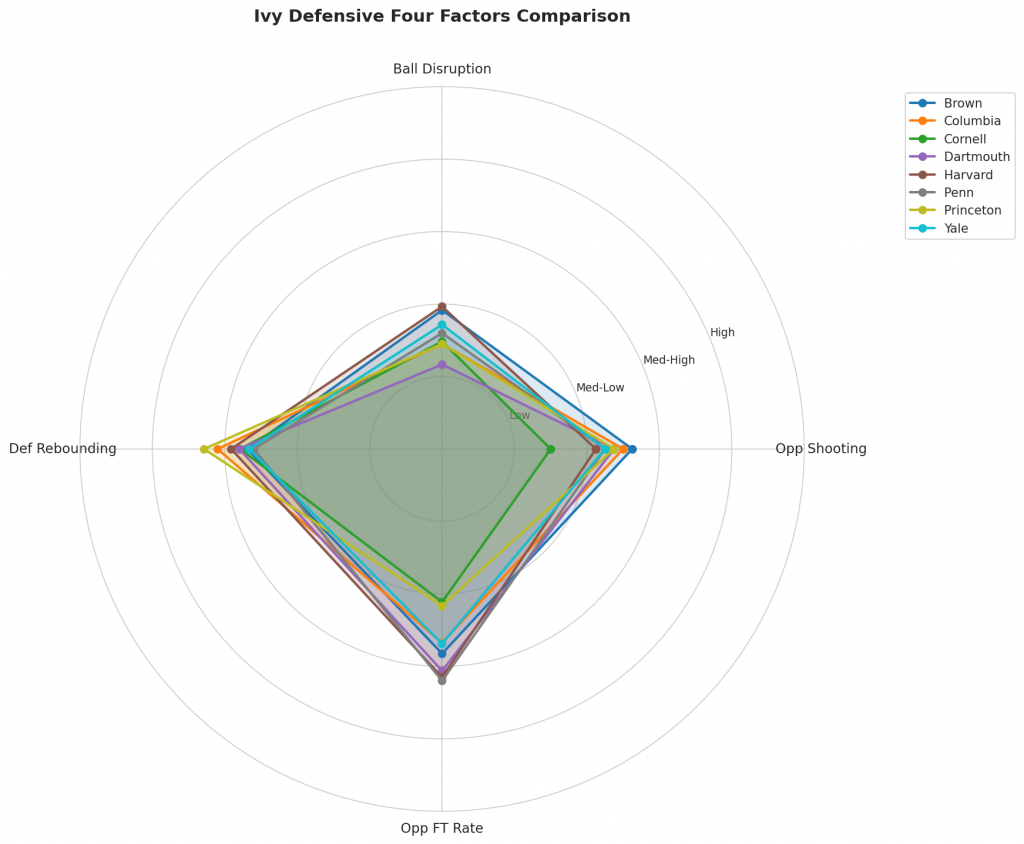
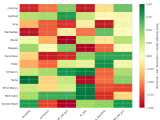
Figure 3: Defensive Four Factors comparison across Ivy teams. The radar chart shows each team’s opponent shooting defense (Opp eFG%), ball disruption (forcing TOV%), defensive rebounding (DREB%), and opponent free throw prevention (Opp FT Rate).
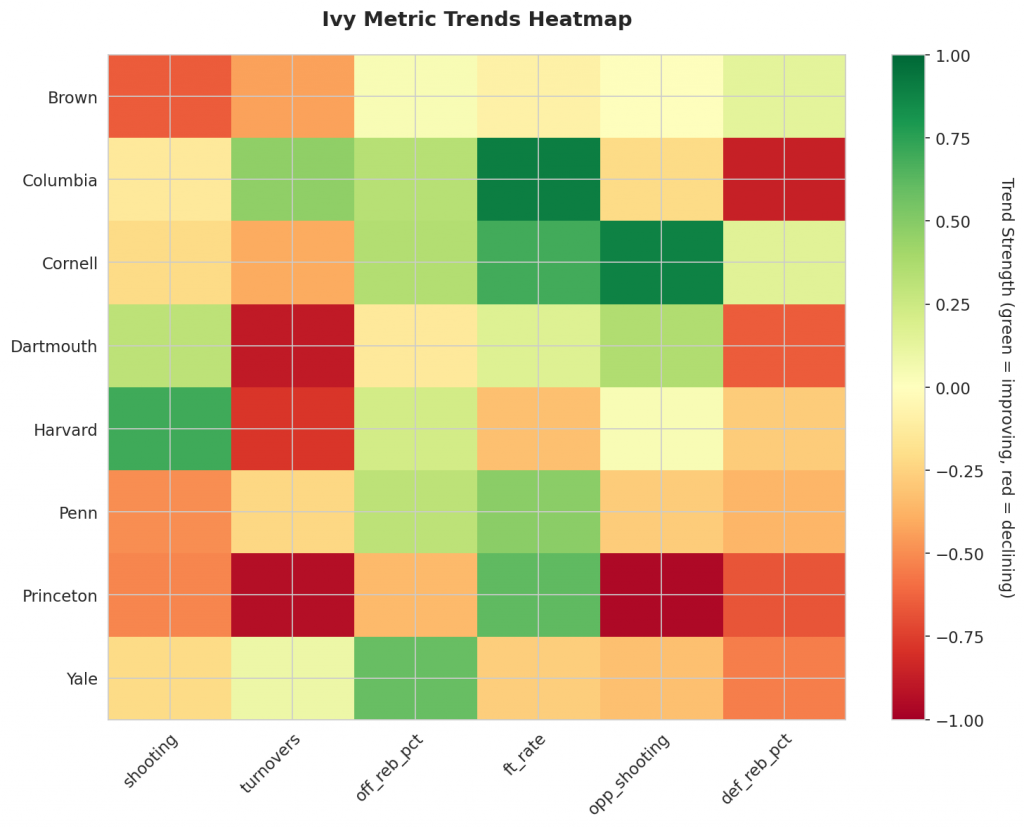
Figure 4: MACD trends heatmap showing which metrics are improving (green) or declining (red) for each team. Stronger colors indicate more pronounced trends.
Looking Ahead
Ivy League Teams Showcase Key Improvements in Offense and Defense
As the Ivy League season reaches its midpoint, several teams have demonstrated significant improvements on both ends of the court. A closer examination of key trends reveals that Dartmouth, Harvard, and Princeton are making strides offensively, while Columbia and Cornell’s defensive performances have taken a downturn.
Offensive Improvements
Dartmouth has shown marked improvement in reducing turnovers, with their average turnover rate decreasing from 0.172 to a lower value (Season Avg: 0.172, Trend: Down). This decline is likely contributing to their overall performance, as they aim to capitalize on scoring opportunities. Harvard’s shooting percentage has also increased significantly, trending up strongly at an average of 0.54 (Trend: Up). Furthermore, the Crimson have reduced turnovers at an impressive rate, with a decrease in their average turnover rate from 0.157 to a lower value (Season Avg: 0.157, Trend: Down).
Princeton’s defensive prowess has allowed them to limit opponents’ shooting opportunities, as evidenced by their opponent’s shooting percentage decreasing from 0.51 to a lower value (Trend: Down). This improvement is likely a result of their strong defensive performance.
Defensive Decline
Columbia’s defensive rebounding percentage has decreased, signaling a decline in their ability to secure rebounds on both ends of the floor (Season Avg: 0.748, Trend: Down). Cornell’s opponents have seen an increase in shooting opportunities against them, with their opponent’s shooting percentage increasing from 0.58 to a higher value (Trend: Up).
No Changes in Opponent Vulnerability
There are no notable changes in opponent vulnerability for the Ivy League teams at this time.
These trends indicate that while some Ivy League teams have made significant strides on both ends of the court, others face challenges in maintaining momentum. As the season progresses, it will be essential to monitor these trends and see which teams can sustain their improvements or correct their declines.
Metrics Glossary
Four Factors (Dean Oliver’s framework for basketball success):
- eFG% (Effective Field Goal %): Field goal percentage adjusted for 3-pointers being worth more (FGM + 0.5×3PM) / FGA. Higher is better offensively, lower is better defensively.
- TOV% (Turnover Rate): Turnovers per 100 possessions. Lower is better offensively (taking care of the ball), higher is better defensively (forcing turnovers).
- OREB% / DREB% (Offensive/Defensive Rebound Rate): Percentage of available rebounds grabbed. Offensive rebounds create second-chance points; defensive rebounds end opponent possessions.
- FTR (Free Throw Rate): Free throws made per field goal attempt (FTM/FGA). Measures ability to get to the line AND convert. Higher is better offensively, lower is better defensively.
Other Metrics:
- Elo Rating: Chess-style rating system that updates based on game results and opponent strength. Higher Elo indicates stronger team.
- Efficiency Margin: Point differential per 100 possessions (Offensive Efficiency – Defensive Efficiency). Accounts for pace of play.
- MACD (Moving Average Convergence Divergence): Trend indicator comparing 12-game and 26-game exponential moving averages. Positive MACD = improving trend, Negative MACD = declining trend.
Analysis powered by HoopSci’s advanced metrics and MACD trending indicators.