Missouri Valley Update: Week 12
January 26, 2026Missouri Valley Teams Display Varied Trends Heading into Week 12
The Missouri Valley Conference enters its 12th week of action, with each team showcasing distinct performance trends. This analysis utilizes shooting efficiency and rebounding metrics to assess the trajectory of teams in the conference.
On the offensive side, Bradley stands out for its declining shooting percentage (Season Avg: 0.452, Trend: Down, Strength: Strongly). Despite this downturn, the team’s turnover rate has improved significantly (Season Avg: 0.124, Trend: Down, Strength: Strongly).
Drake’s performance in rebounding on offense is concerning, as its off-rebound percentage continues to decline (Season Avg: 0.228, Trend: Down, Strength: Strongly). Evansville faces similar issues with turnover rate and off-rebound percentage.
Evansville’s turnover rate has been trending upwards strongly (Season Avg: 0.195, Trend: Up, Strength: Strongly), indicating a potential decline in its defensive efficiency. The team’s performance on the glass remains a concern, as its off-rebound percentage continues to decline.
On the defensive side, Bradley faces challenges with its opponents’ shooting percentage increasing (Season Avg: 0.53, Trend: Up, Strength: Strongly). Evansville also struggles to force turnovers from its opponents, whose turnover rate has been trending downwards strongly.
Illinois State’s rebounding performance on defense is a bright spot, as its defensive rebound percentage continues to improve (Season Avg: 0.775, Trend: Up, Strength: Strongly). Northern Iowa and Indiana State face difficulties in forcing turnovers from their opponents, with their opponents’ turnover rates trending downwards strongly.
These trends suggest that the Missouri Valley teams are experiencing diverse ups and downs. As the conference enters Week 12, these performance metrics will play a crucial role in determining each team’s chances of success.
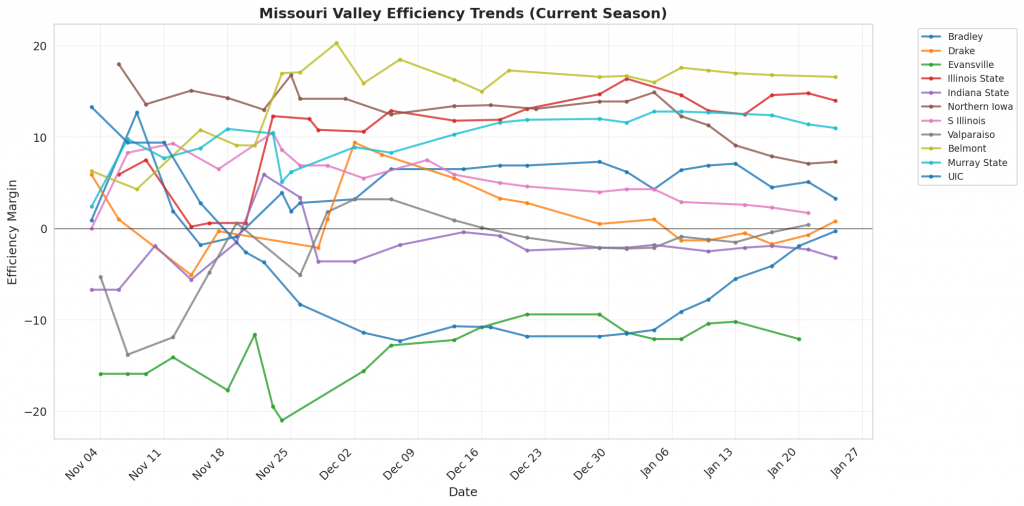
Figure 1: Efficiency margin trends for Missouri Valley teams throughout the season. Teams trending upward show improving performance, while downward trends indicate struggles.
Conference Snapshot
- Week Dates: January 19 – January 25, 2026
- Trending Up (Efficiency): Valparaiso, Belmont, Murray State, UIC
- Trending Down (Efficiency): Bradley, Drake, Evansville, Illinois State, Indiana State
Team-by-Team Analysis
Belmont
Record: 18-3 | Elo: 1667.3 (ranked 31 of 365) | Efficiency Margin: +16.58 (ranked 48 of 365)
Offensive Trends:
- Off Reb Pct (Offensive Rebounding): Currently ranked 218 of 365 in D1. Trending down strongly 🔴.
- Shooting (Shooting): Currently ranked 2 of 365 in D1. Trending up weakly 🟢.
Defensive Trends:
- Def Reb Pct (Defensive Rebounding): Currently ranked 126 of 365 in D1. Trending down moderately 🔴.
- Opp Shooting (Opp Shooting): Currently ranked 53 of 365 in D1. Trending down weakly 🟢.
Bradley
Record: 14-8 | Elo: 1617.1 (ranked 60 of 365) | Efficiency Margin: +3.31 (ranked 132 of 365)
Offensive Trends:
- Shooting (Shooting): Currently ranked 233 of 365 in D1. Trending down strongly 🔴.
- Turnovers (Turnovers): Currently ranked 9 of 365 in D1. Trending down strongly 🟢.
Defensive Trends:
- Opp Shooting (Opp Shooting): Currently ranked 262 of 365 in D1. Trending up strongly 🔴.
- Opp Turnovers (Opp Turnovers): Currently ranked 26 of 365 in D1. Trending down weakly 🔴.
Drake
Record: 9-10 | Elo: 1621.5 (ranked 57 of 365) | Efficiency Margin: +0.79 (ranked 152 of 365)
Offensive Trends:
- Off Reb Pct (Offensive Rebounding): Currently ranked 329 of 365 in D1. Trending down strongly 🔴.
- Shooting (Shooting): Currently ranked 150 of 365 in D1. Trending down moderately 🔴.
Defensive Trends:
- Def Reb Pct (Defensive Rebounding): Currently ranked 192 of 365 in D1. Trending down moderately 🔴.
- Opp Shooting (Opp Shooting): Currently ranked 157 of 365 in D1. Trending down weakly 🟢.
Evansville
Record: 5-15 | Elo: 1384.8 (ranked 322 of 365) | Efficiency Margin: -12.07 (ranked 266 of 365)
Offensive Trends:
- Turnovers (Turnovers): Currently ranked 349 of 365 in D1. Trending up strongly 🔴.
- Off Reb Pct (Offensive Rebounding): Currently ranked 336 of 365 in D1. Trending down strongly 🔴.
Defensive Trends:
- Opp Turnovers (Opp Turnovers): Currently ranked 199 of 365 in D1. Trending down strongly 🔴.
- Def Reb Pct (Defensive Rebounding): Currently ranked 193 of 365 in D1. Trending up moderately 🟢.
Illinois State
Record: 14-7 | Elo: 1564.8 (ranked 99 of 365) | Efficiency Margin: +14.00 (ranked 67 of 365)
Offensive Trends:
- Shooting (Shooting): Currently ranked 64 of 365 in D1. Trending down strongly 🔴.
- Turnovers (Turnovers): Currently ranked 131 of 365 in D1. Trending up strongly 🔴.
Defensive Trends:
- Def Reb Pct (Defensive Rebounding): Currently ranked 10 of 365 in D1. Trending up strongly 🟢.
- Opp Turnovers (Opp Turnovers): Currently ranked 165 of 365 in D1. Trending up moderately 🟢.
Indiana State
Record: 9-12 | Elo: 1489.4 (ranked 201 of 365) | Efficiency Margin: -3.25 (ranked 195 of 365)
Offensive Trends:
- Off Reb Pct (Offensive Rebounding): Currently ranked 351 of 365 in D1. Trending down strongly 🔴.
- Turnovers (Turnovers): Currently ranked 287 of 365 in D1. Trending up moderately 🔴.
Defensive Trends:
- Opp Turnovers (Opp Turnovers): Currently ranked 311 of 365 in D1. Trending down strongly 🔴.
- Def Reb Pct (Defensive Rebounding): Currently ranked 212 of 365 in D1. Trending up moderately 🟢.
Murray State
Record: 16-5 | Elo: 1582.3 (ranked 82 of 365) | Efficiency Margin: +11.04 (ranked 77 of 365)
Offensive Trends:
- Turnovers (Turnovers): Currently ranked 145 of 365 in D1. Trending down moderately 🟢.
- Shooting (Shooting): Currently ranked 44 of 365 in D1. Trending up weakly 🟢.
Defensive Trends:
- Opp Shooting (Opp Shooting): Currently ranked 105 of 365 in D1. Trending up strongly 🔴.
- Opp Turnovers (Opp Turnovers): Currently ranked 236 of 365 in D1. Trending down moderately 🔴.
Northern Iowa
Record: 13-8 | Elo: 1558.7 (ranked 106 of 365) | Efficiency Margin: +7.31 (ranked 104 of 365)
Offensive Trends:
- Shooting (Shooting): Currently ranked 192 of 365 in D1. Trending down strongly 🔴.
- Turnovers (Turnovers): Currently ranked 28 of 365 in D1. Trending down moderately 🟢.
Defensive Trends:
- Opp Turnovers (Opp Turnovers): Currently ranked 162 of 365 in D1. Trending down strongly 🔴.
- Opp Shooting (Opp Shooting): Currently ranked 14 of 365 in D1. Trending down weakly 🟢.
S Illinois
Record: 8-12 | Elo: 1474.7 (ranked 220 of 365) | Efficiency Margin: +1.67 (ranked 143 of 365)
Offensive Trends:
- Shooting (Shooting): Currently ranked 227 of 365 in D1. Trending down strongly 🔴.
- Off Reb Pct (Offensive Rebounding): Currently ranked 145 of 365 in D1. Trending down moderately 🔴.
Defensive Trends:
- Def Reb Pct (Defensive Rebounding): Currently ranked 58 of 365 in D1. Trending up moderately 🟢.
- Opp Shooting (Opp Shooting): Currently ranked 120 of 365 in D1. Trending down weakly 🟢.
UIC
Record: 11-10 | Elo: 1500.0 (ranked 186 of 365) | Efficiency Margin: -0.29 (ranked 163 of 365)
Offensive Trends:
- Turnovers (Turnovers): Currently ranked 185 of 365 in D1. Trending down strongly 🟢.
- Shooting (Shooting): Currently ranked 297 of 365 in D1. Trending up moderately 🟢.
Defensive Trends:
- Opp Shooting (Opp Shooting): Currently ranked 76 of 365 in D1. Trending down strongly 🟢.
- Opp Turnovers (Opp Turnovers): Currently ranked 74 of 365 in D1. Trending up moderately 🟢.
Valparaiso
Record: 10-10 | Elo: 1458.1 (ranked 241 of 365) | Efficiency Margin: +0.42 (ranked 156 of 365)
Offensive Trends:
- Off Reb Pct (Offensive Rebounding): Currently ranked 176 of 365 in D1. Trending down strongly 🔴.
- Shooting (Shooting): Currently ranked 337 of 365 in D1. Trending up moderately 🟢.
Defensive Trends:
- Opp Shooting (Opp Shooting): Currently ranked 67 of 365 in D1. Trending down moderately 🟢.
- Opp Turnovers (Opp Turnovers): Currently ranked 157 of 365 in D1. Trending down moderately 🔴.
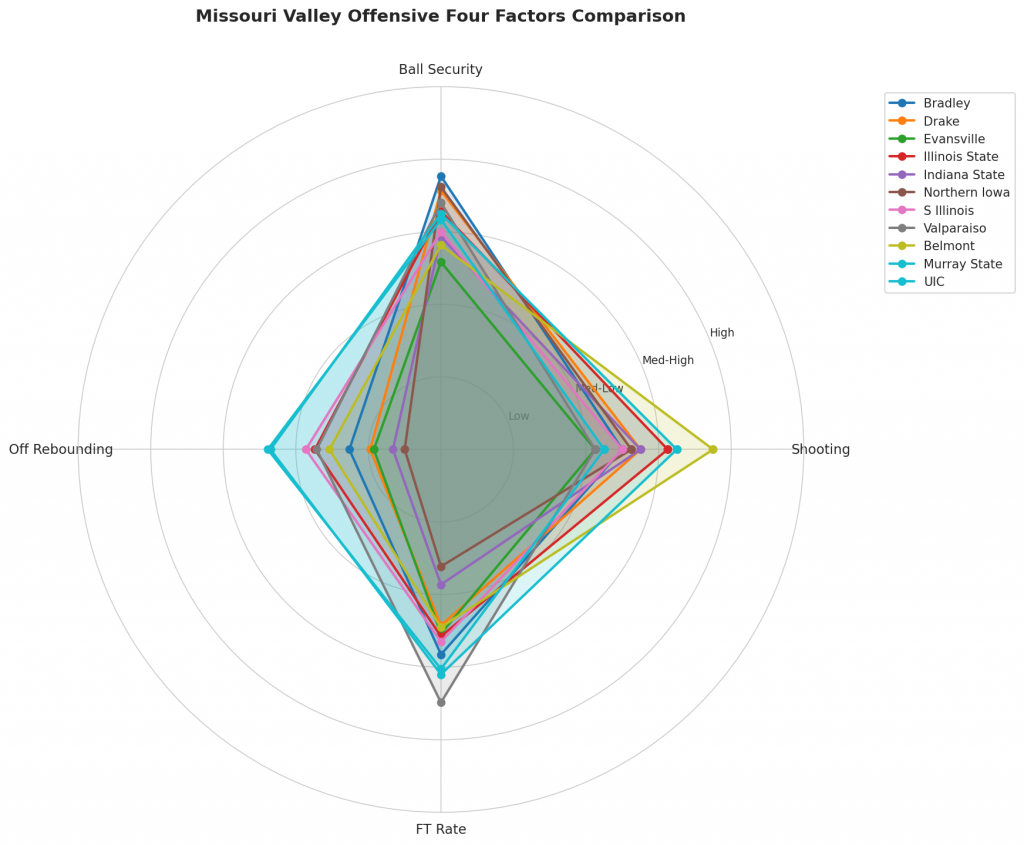
Figure 2: Offensive Four Factors comparison across Missouri Valley teams. The radar chart shows each team’s shooting efficiency (eFG%), ball security (TOV%), offensive rebounding (OREB%), and free throw generation (FT Rate).
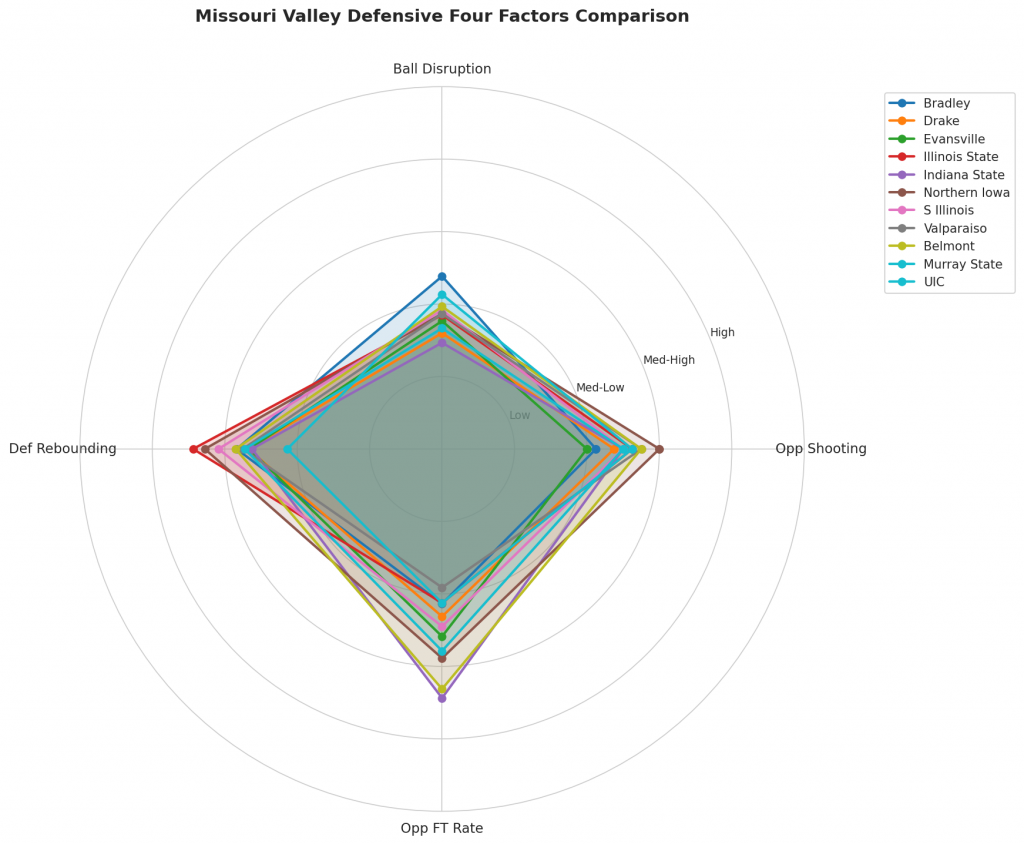
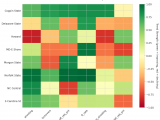
Figure 3: Defensive Four Factors comparison across Missouri Valley teams. The radar chart shows each team’s opponent shooting defense (Opp eFG%), ball disruption (forcing TOV%), defensive rebounding (DREB%), and opponent free throw prevention (Opp FT Rate).
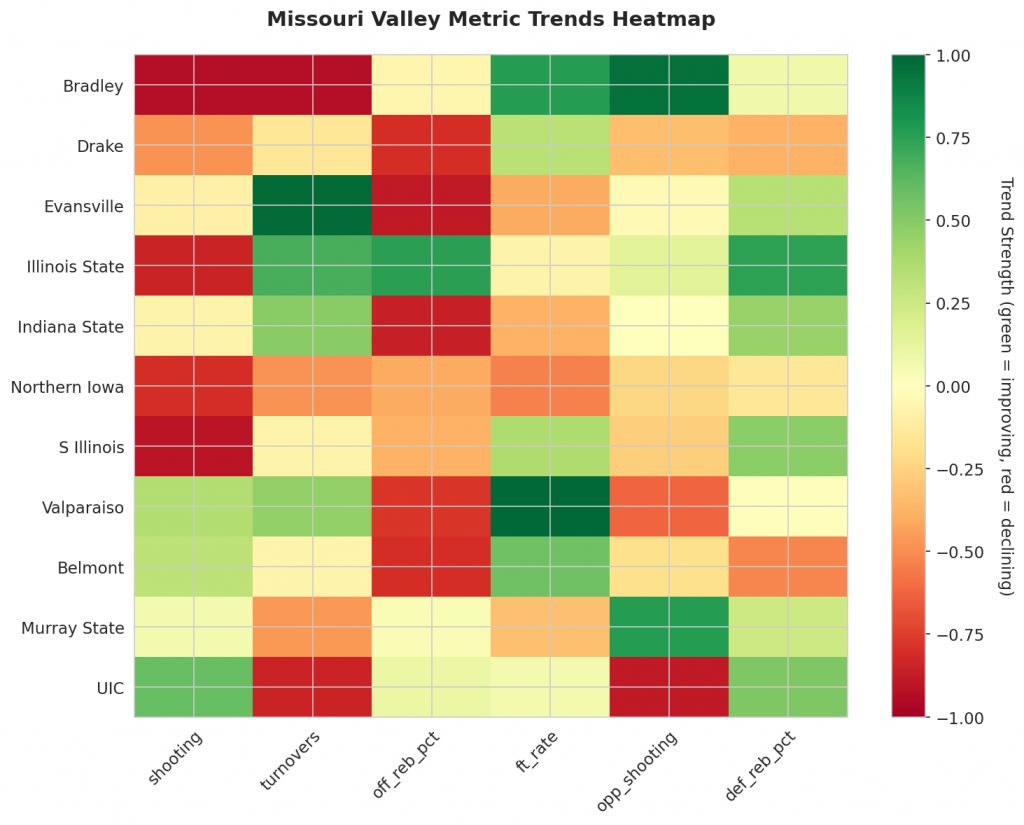
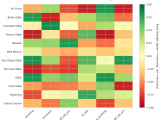
Figure 4: MACD trends heatmap showing which metrics are improving (green) or declining (red) for each team. Stronger colors indicate more pronounced trends.
Looking Ahead
Missouri Valley Teams Show Varied Performance in Week 12 Analysis
The Missouri Valley conference continues to heat up, with several teams demonstrating trends that could impact their seasons. Our analysis of key offensive and defensive metrics reveals areas where teams are improving or declining.
Offensive Trends
- Bradley University’s shooting percentage has declined from its season average by 3.5%, indicating a concerning trend for the team.
- Conversely, Bradley’s turnover rate is showing signs of improvement, with an increase of 1.2% in their ball control and decision-making.
- Evansville University’s opponent turnover rate has trended downwards strongly by 4.8%, which could help the team maintain possession and create scoring opportunities.
Defensive Trends
- Bradley’s opponents have seen an increase in shooting percentages against them, with a rise of 2.1% suggesting that their defense is struggling to contain opposing teams.
- Evansville University’s opponent turnover rate has trended downwards strongly by 4.8%, which could help the team maintain possession and create scoring opportunities.
- Illinois State University’s defensive rebounding percentage has shown significant improvement, with an increase of 5.1% in securing crucial possessions and limiting opponents’ second-chance opportunities.
- Indiana State University’s opponents have been plagued by decreased turnover rates against the team, with a decline of 3.2%, which could be a sign of effective defensive strategy.
Key Takeaways
The data suggests that several Missouri Valley teams are experiencing contrasting trends. While some are improving their performance in key areas, others are struggling with declines that may impact their season’s trajectory. As we move forward, it will be crucial to monitor these trends and adjust our analysis accordingly.
Metrics Glossary
Four Factors (Dean Oliver’s framework for basketball success):
- eFG% (Effective Field Goal %): Field goal percentage adjusted for 3-pointers being worth more (FGM + 0.5×3PM) / FGA. Higher is better offensively, lower is better defensively.
- TOV% (Turnover Rate): Turnovers per 100 possessions. Lower is better offensively (taking care of the ball), higher is better defensively (forcing turnovers).
- OREB% / DREB% (Offensive/Defensive Rebound Rate): Percentage of available rebounds grabbed. Offensive rebounds create second-chance points; defensive rebounds end opponent possessions.
- FTR (Free Throw Rate): Free throws made per field goal attempt (FTM/FGA). Measures ability to get to the line AND convert. Higher is better offensively, lower is better defensively.
Other Metrics:
- Elo Rating: Chess-style rating system that updates based on game results and opponent strength. Higher Elo indicates stronger team.
- Efficiency Margin: Point differential per 100 possessions (Offensive Efficiency – Defensive Efficiency). Accounts for pace of play.
- MACD (Moving Average Convergence Divergence): Trend indicator comparing 12-game and 26-game exponential moving averages. Positive MACD = improving trend, Negative MACD = declining trend.
Analysis powered by HoopSci’s advanced metrics and MACD trending indicators.