Southern Update: Week 12
January 26, 2026Southern Conference Teams Show Varied Momentum in Week 12
As we approach Week 12 of the college basketball season, the Southern Conference teams are exhibiting diverse trending patterns. By analyzing Moving Average Convergence Divergence (MACD) indicators, a momentum-based technical analysis tool that gauges the strength and direction of trends, we can gain insight into each team’s performance and predict their trajectory.
Offensive Trends
Chattanooga’s performance on the glass is a concern, as their rebounding percentage has been trending down strongly throughout the season (Season Avg: 0.177). This decline is particularly notable, with a strong downward momentum.
ETSU, on the other hand, is showing significant improvement in several areas. Their shooting percentage has trended up strongly (Season Avg: 0.56), indicating a boost in their scoring efficiency. Additionally, they have seen a downturn in turnovers, which will undoubtedly help their offense.
Furman’s also witnessed a decrease in turnovers, which should lead to more efficient playmaking opportunities for the team.
Defensive Trends
On the defensive side, Chattanooga is struggling with opposing turnover rates, as their opponents are taking advantage of their mistakes. This trend has been trending down strongly (Season Avg: 0.134).
ETSU, however, is demonstrating a marked improvement in defending the rebound, boasting an upward trend in defensive rebounding percentage (Season Avg: 0.746). Samford shares this trend, with both teams showing strong upticks in this category.
UNCG’s defense has been weakened by opponents’ shooting percentages trending up strongly (Season Avg: 0.57), a concerning trend for UNCG’s defense.
These insights offer a snapshot of the current momentum within each team. As we move into Week 12, it will be interesting to see which teams can continue their upward trends and adapt to counter their opponents’ improving statistics.
By examining these MACD indicators, fans and analysts alike can better understand where each team stands in terms of performance and potential for growth.
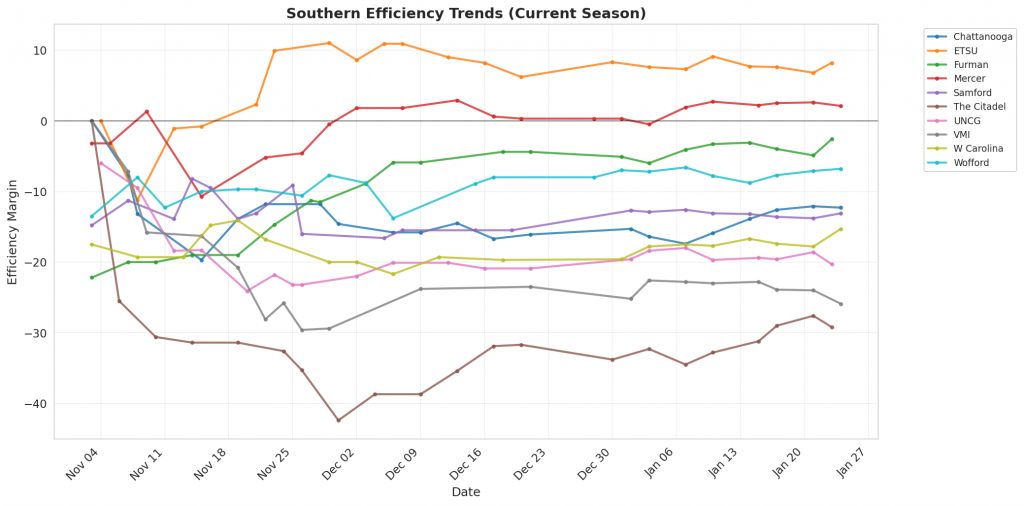
Figure 1: Efficiency margin trends for Southern teams throughout the season. Teams trending upward show improving performance, while downward trends indicate struggles.
Conference Snapshot
- Week Dates: January 19 – January 25, 2026
- Trending Up (Efficiency): ETSU, Mercer, Samford, The Citadel, UNCG
- Trending Down (Efficiency): Chattanooga, Furman
Team-by-Team Analysis
Chattanooga
Record: 9-12 | Elo: 1551.1 (ranked 113 of 365) | Efficiency Margin: -12.27 (ranked 268 of 365)
Offensive Trends:
- Off Reb Pct (Offensive Rebounding): Currently ranked 364 of 365 in D1. Trending down strongly 🔴.
- Shooting (Shooting): Currently ranked 124 of 365 in D1. Trending down weakly 🔴.
Defensive Trends:
- Opp Turnovers (Opp Turnovers): Currently ranked 329 of 365 in D1. Trending down strongly 🔴.
- Opp Shooting (Opp Shooting): Currently ranked 220 of 365 in D1. Trending down moderately 🟢.
ETSU
Record: 15-6 | Elo: 1562.2 (ranked 104 of 365) | Efficiency Margin: +8.16 (ranked 98 of 365)
Offensive Trends:
- Shooting (Shooting): Currently ranked 43 of 365 in D1. Trending up strongly 🟢.
- Turnovers (Turnovers): Currently ranked 82 of 365 in D1. Trending down strongly 🟢.
Defensive Trends:
- Def Reb Pct (Defensive Rebounding): Currently ranked 63 of 365 in D1. Trending up strongly 🟢.
- Opp Turnovers (Opp Turnovers): Currently ranked 48 of 365 in D1. Trending down moderately 🔴.
Furman
Record: 14-7 | Elo: 1581.4 (ranked 83 of 365) | Efficiency Margin: -2.59 (ranked 186 of 365)
Offensive Trends:
- Turnovers (Turnovers): Currently ranked 259 of 365 in D1. Trending down strongly 🟢.
- Off Reb Pct (Offensive Rebounding): Currently ranked 111 of 365 in D1. Trending down moderately 🔴.
Defensive Trends:
- Opp Shooting (Opp Shooting): Currently ranked 111 of 365 in D1. Trending down moderately 🟢.
- Def Reb Pct (Defensive Rebounding): Currently ranked 82 of 365 in D1. Trending up moderately 🟢.
Mercer
Record: 13-8 | Elo: 1505.6 (ranked 175 of 365) | Efficiency Margin: +2.07 (ranked 140 of 365)
Offensive Trends:
- Shooting (Shooting): Currently ranked 89 of 365 in D1. Trending up strongly 🟢.
- Off Reb Pct (Offensive Rebounding): Currently ranked 87 of 365 in D1. Trending up moderately 🟢.
Defensive Trends:
- Opp Shooting (Opp Shooting): Currently ranked 250 of 365 in D1. Trending up moderately 🔴.
- Def Reb Pct (Defensive Rebounding): Currently ranked 308 of 365 in D1. Trending down moderately 🔴.
Samford
Record: 10-11 | Elo: 1535.8 (ranked 133 of 365) | Efficiency Margin: -13.14 (ranked 274 of 365)
Offensive Trends:
- Turnovers (Turnovers): Currently ranked 1 of 365 in D1. Trending down strongly 🟢.
- Off Reb Pct (Offensive Rebounding): Currently ranked 342 of 365 in D1. Trending down strongly 🔴.
Defensive Trends:
- Opp Turnovers (Opp Turnovers): Currently ranked 357 of 365 in D1. Trending down strongly 🔴.
- Def Reb Pct (Defensive Rebounding): Currently ranked 54 of 365 in D1. Trending up strongly 🟢.
The Citadel
Record: 6-15 | Elo: 1284.8 (ranked 366 of 365) | Efficiency Margin: -29.18 (ranked 358 of 365)
Offensive Trends:
- Off Reb Pct (Offensive Rebounding): Currently ranked 252 of 365 in D1. Trending down strongly 🔴.
- Shooting (Shooting): Currently ranked 292 of 365 in D1. Trending up weakly 🟢.
Defensive Trends:
- Opp Shooting (Opp Shooting): Currently ranked 351 of 365 in D1. Trending down weakly 🟢.
- Opp Turnovers (Opp Turnovers): Currently ranked 354 of 365 in D1. Trending down weakly 🔴.
UNCG
Record: 8-13 | Elo: 1473.6 (ranked 226 of 365) | Efficiency Margin: -20.25 (ranked 330 of 365)
Offensive Trends:
- Turnovers (Turnovers): Currently ranked 92 of 365 in D1. Trending down moderately 🟢.
- Off Reb Pct (Offensive Rebounding): Currently ranked 270 of 365 in D1. Trending down moderately 🔴.
Defensive Trends:
- Opp Shooting (Opp Shooting): Currently ranked 350 of 365 in D1. Trending up strongly 🔴.
- Opp Turnovers (Opp Turnovers): Currently ranked 355 of 365 in D1. Trending down moderately 🔴.
VMI
Record: 4-15 | Elo: 1327.3 (ranked 356 of 365) | Efficiency Margin: -25.93 (ranked 353 of 365)
Offensive Trends:
- Turnovers (Turnovers): Currently ranked 119 of 365 in D1. Trending down strongly 🟢.
- Off Reb Pct (Offensive Rebounding): Currently ranked 272 of 365 in D1. Trending down strongly 🔴.
Defensive Trends:
- Opp Turnovers (Opp Turnovers): Currently ranked 181 of 365 in D1. Trending down strongly 🔴.
- Def Reb Pct (Defensive Rebounding): Currently ranked 355 of 365 in D1. Trending down strongly 🔴.
W Carolina
Record: 7-12 | Elo: 1410.9 (ranked 292 of 365) | Efficiency Margin: -15.30 (ranked 295 of 365)
Offensive Trends:
- Shooting (Shooting): Currently ranked 265 of 365 in D1. Trending up strongly 🟢.
- Turnovers (Turnovers): Currently ranked 233 of 365 in D1. Trending down strongly 🟢.
Defensive Trends:
- Opp Turnovers (Opp Turnovers): Currently ranked 332 of 365 in D1. Trending down moderately 🔴.
- Opp Shooting (Opp Shooting): Currently ranked 330 of 365 in D1. Trending up weakly 🔴.
Wofford
Record: 14-7 | Elo: 1559.8 (ranked 105 of 365) | Efficiency Margin: -6.84 (ranked 220 of 365)
Offensive Trends:
- Shooting (Shooting): Currently ranked 169 of 365 in D1. Trending up strongly 🟢.
- Turnovers (Turnovers): Currently ranked 16 of 365 in D1. Trending down strongly 🟢.
Defensive Trends:
- Opp Shooting (Opp Shooting): Currently ranked 274 of 365 in D1. Trending up moderately 🔴.
- Opp Turnovers (Opp Turnovers): Currently ranked 262 of 365 in D1. Trending up weakly 🟢.
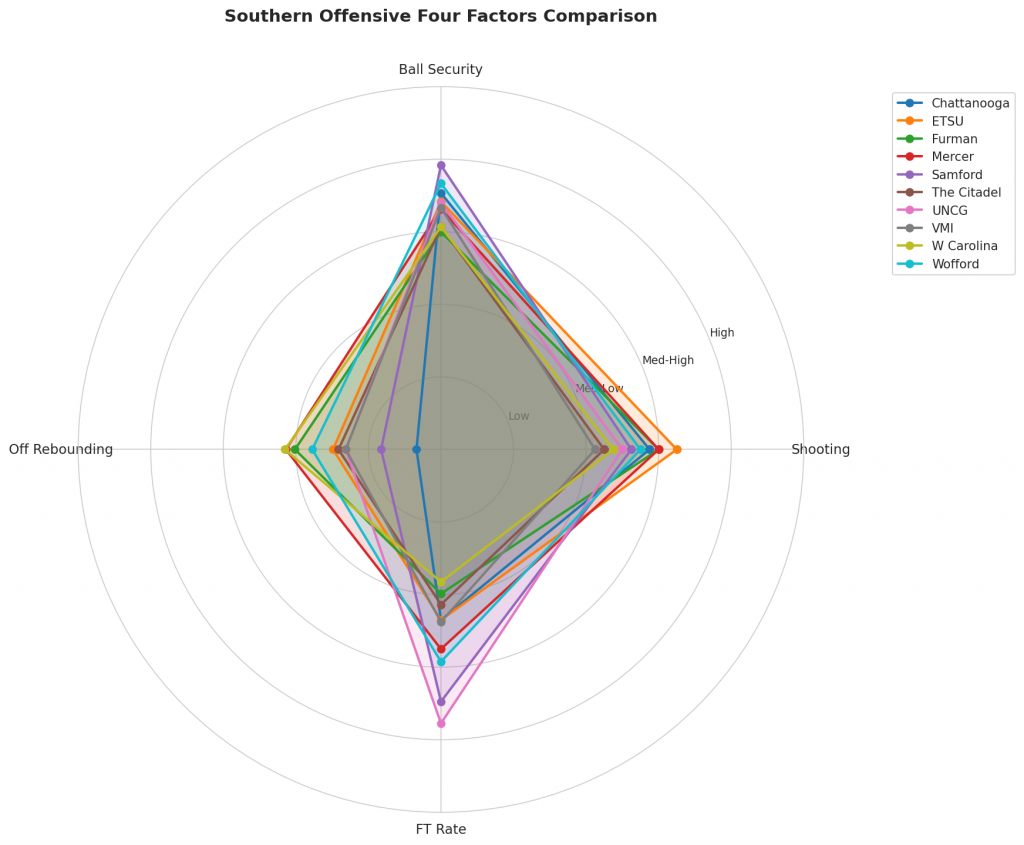
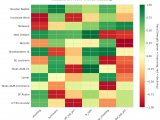
Figure 2: Offensive Four Factors comparison across Southern teams. The radar chart shows each team’s shooting efficiency (eFG%), ball security (TOV%), offensive rebounding (OREB%), and free throw generation (FT Rate).
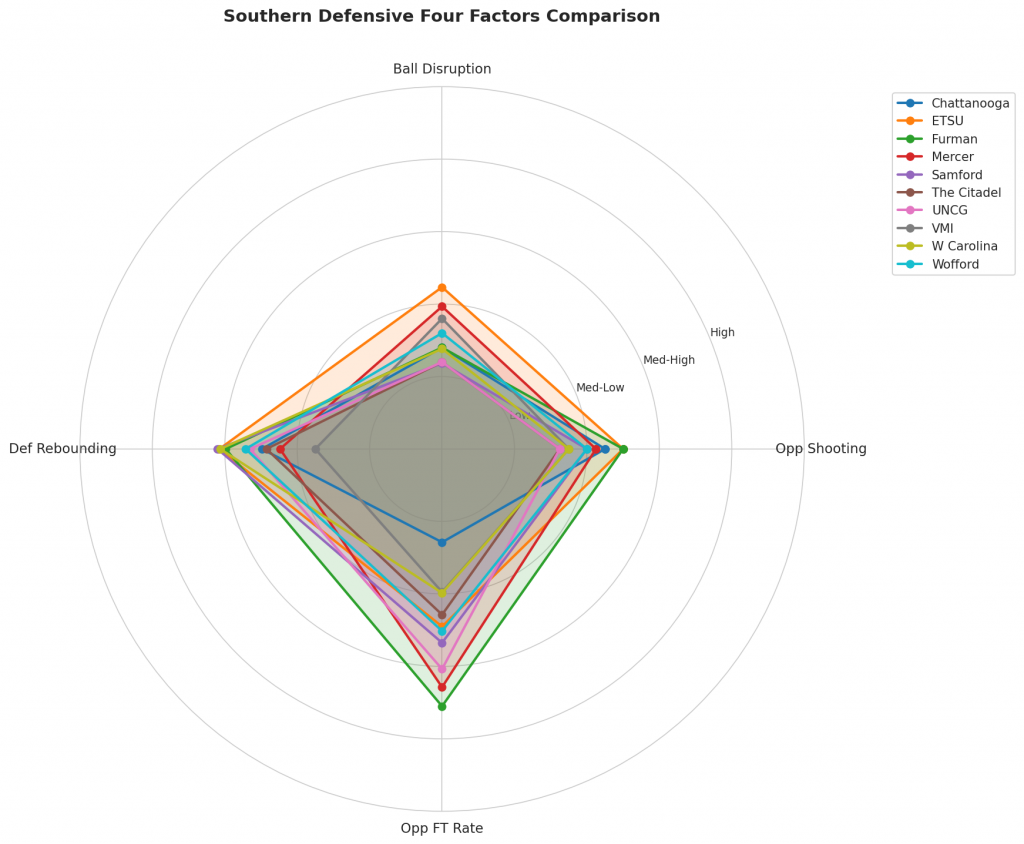
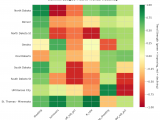
Figure 3: Defensive Four Factors comparison across Southern teams. The radar chart shows each team’s opponent shooting defense (Opp eFG%), ball disruption (forcing TOV%), defensive rebounding (DREB%), and opponent free throw prevention (Opp FT Rate).
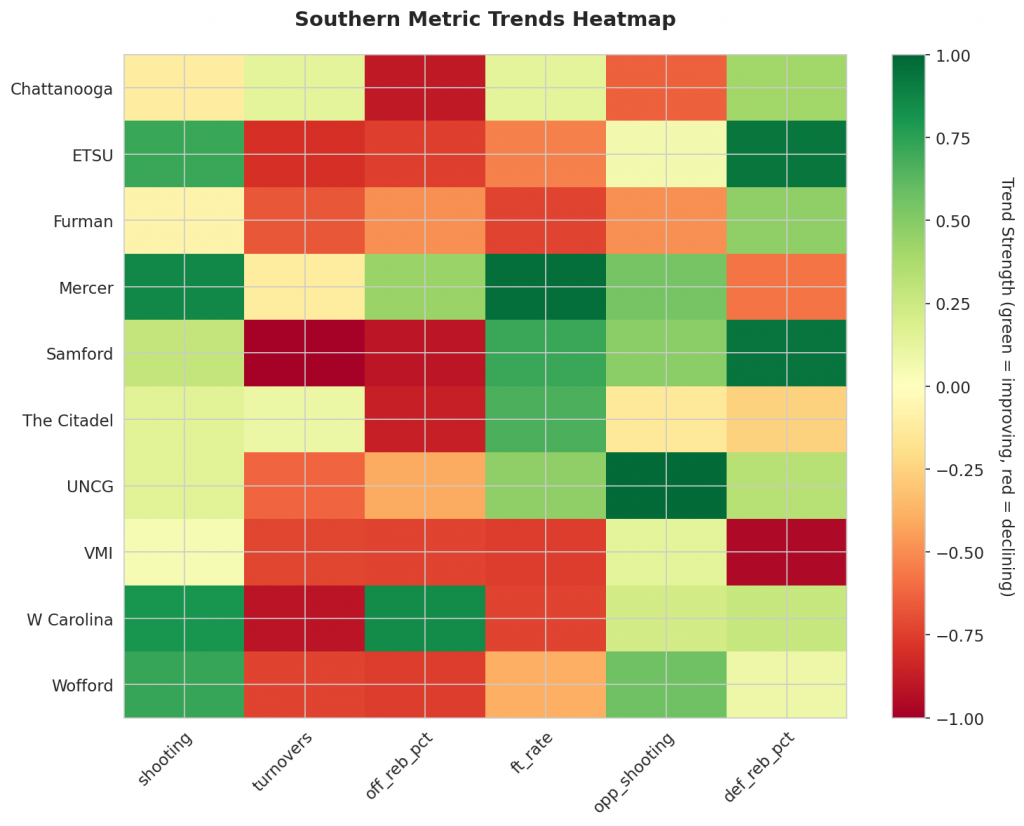
Figure 4: MACD trends heatmap showing which metrics are improving (green) or declining (red) for each team. Stronger colors indicate more pronounced trends.
Looking Ahead
Southern Teams’ Week 12 Analysis: Trends to Watch
As the Southern teams near the end of their regular season, it’s essential to separate the genuine improvers from those riding unsustainable momentum. This analysis highlights key trends in shooting percentage, defensive rebounding efficiency, and turnover rate that indicate which teams are making strides.
Offensive Trends to Highlight
- ETSU’s Shooting Percentage Increases: ETSU has shown a notable improvement in shooting percentage, indicating a surge in scoring opportunities.
- Chattanooga’s Rebounding Efficiency Declines: Chattanooga’s rebounding efficiency is trending down strongly, which could hinder their overall performance.
- ETSU’s Turnover Rate Decreases: A significant drop in turnovers suggests ETSU is becoming more efficient on offense.
Defensive Trends to Highlight
- Samford’s Defensive Rebounding Efficiency Improves: Samford has shown a strong trend up in defensive rebounding efficiency, indicating they’re effectively securing second-chance opportunities.
- Chattanooga’s Opponents’ Turnovers Increase: A downturn in opponents’ turnovers suggests Chattanooga may be struggling to apply pressure on their opponents.
- Samford’s Defense Shows Improvement with Rebounding and Turnover Rate: Similar to Chattanooga, Samford is trending up strongly in defensive rebounding efficiency but has a slightly upward trend in opponents’ turnover rates.
These trends provide valuable insights into each team’s performance. ETSU’s improved shooting percentage and decreased turnover rate could be key factors in their upcoming games, while Chattanooga faces challenges on both ends of the court.
Metrics Glossary
Four Factors (Dean Oliver’s framework for basketball success):
- eFG% (Effective Field Goal %): Field goal percentage adjusted for 3-pointers being worth more (FGM + 0.5×3PM) / FGA. Higher is better offensively, lower is better defensively.
- TOV% (Turnover Rate): Turnovers per 100 possessions. Lower is better offensively (taking care of the ball), higher is better defensively (forcing turnovers).
- OREB% / DREB% (Offensive/Defensive Rebound Rate): Percentage of available rebounds grabbed. Offensive rebounds create second-chance points; defensive rebounds end opponent possessions.
- FTR (Free Throw Rate): Free throws made per field goal attempt (FTM/FGA). Measures ability to get to the line AND convert. Higher is better offensively, lower is better defensively.
Other Metrics:
- Elo Rating: Chess-style rating system that updates based on game results and opponent strength. Higher Elo indicates stronger team.
- Efficiency Margin: Point differential per 100 possessions (Offensive Efficiency – Defensive Efficiency). Accounts for pace of play.
- MACD (Moving Average Convergence Divergence): Trend indicator comparing 12-game and 26-game exponential moving averages. Positive MACD = improving trend, Negative MACD = declining trend.
Analysis powered by HoopSci’s advanced metrics and MACD trending indicators.