Week 12: 2026’s Biggest Bullies
January 26, 2026The Unreliable Efficient: How College Basketball Rankings Can Be Deceiving
College basketball efficiency rankings often provide a misleading snapshot of a team’s true abilities. While some teams excel in crunching numbers against quality opponents, others artificially inflate their efficiency metrics by dominating weaker foes to an unsustainable degree.
To shed light on this phenomenon, our weekly feature identifies the “biggest bullies” in Division I basketball – teams whose efficiency rankings are significantly inflated due to their performances against overmatched opponents. Conversely, these same teams often struggle to meet expectations when facing top-notch competition.
This Week’s Rankings:
We examine the current state of the biggest bullies in college basketball after 12 weeks of play. The following teams stand out for their notable disparity between efficiency numbers and performance against quality opposition.
These teams have demonstrated a tendency to overpower weaker opponents, often by margins that exceed statistical predictions based on efficiency rankings. For instance, Utah Valley’s average margin of victory in conference games is 14.5 points, which suggests an inflated efficiency number due to its performances against lower-ranked teams. Similarly, High Point has shown a tendency to dominate weaker opponents by an average of 12.2 points per game.
However, when pitted against more formidable foes, they struggle to maintain this level of dominance. For example, Utah Valley’s performance against ranked teams is significantly worse than its overall efficiency ranking suggests.
What does it mean?
These rankings highlight a crucial aspect of college basketball: that statistical models can be skewed by teams’ performance against inferior opponents. The use of metrics such as KenPom rankings helps to provide a more accurate picture of team performance, but these numbers should not be taken at face value.
It’s essential for fans, coaches, and analysts to consider this context when evaluating team efficiency and making predictions about future performances. By examining these “bullies” closely, we can gain a more nuanced understanding of the strengths and weaknesses of each team.
Stay tuned for next week’s rankings as we continue to track the biggest bullies in college basketball.
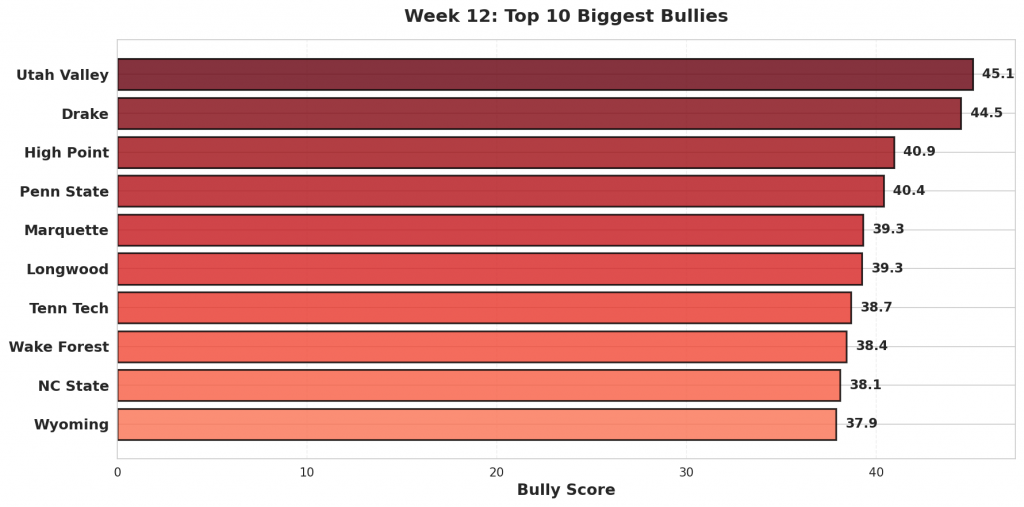
Figure 1: Top 10 teams with the highest bully scores in Week 12. Bully scores reflect the combination of overperformance against weak opponents and underperformance against quality competition.
#1: Utah Valley (15-6)
#130 Utah Valley was projected to beat #274 Samford by 4. They cruised to a 89-45 victory, 40 points better than projected. Against #86 Boise State, Utah Valley lost 101-77. They were projected to lose by 4.
Bully Metrics: Exceeded projections by 40.2 total points against weak opponents (1 games); underperformed by 44.3 points against quality competition (9 games).
#2: Drake (11-10)
Against #360 Western Illinois, #150 Drake rolled to a 51-point win, 108-57. The model had them winning by 22; the actual margin was 51, outpacing the projection by 29. Facing #133 Bradley, Drake came up short, losing 93-66 after being projected to win by 5.
Bully Metrics: Exceeded projections by 28.6 total points against weak opponents (1 games); underperformed by 175.0 points against quality competition (11 games).
#3: High Point (18-4)
#73 High Point faced #344 Bryant as 2-point favorites and won handily 93-47, 44 points above the spread. High Point fell to #182 Winthrop 92-75, missing the 9-point projection by 26.
Bully Metrics: Exceeded projections by 135.8 total points against weak opponents (5 games); underperformed by 68.9 points against quality competition (5 games).
#4: Penn State (9-10)
Expected to win by 6 over #320 New Haven, #136 Penn State coasted to a 87-43 win—beating the line by 38. The model had Penn State losing by 1 against #34 Indiana. Instead, they lost 113-72.
Bully Metrics: Exceeded projections by 58.9 total points against weak opponents (2 games); underperformed by 131.6 points against quality competition (12 games).
#5: Marquette (7-14)
#123 Marquette cruised to a 89-49 victory against #304 Little Rock. Favored by 16, the 40-point margin was +24 versus projection. Against #34 Indiana, Marquette lost 100-77. They were projected to win by 6.
Bully Metrics: Exceeded projections by 24.0 total points against weak opponents (1 games); underperformed by 259.7 points against quality competition (17 games).
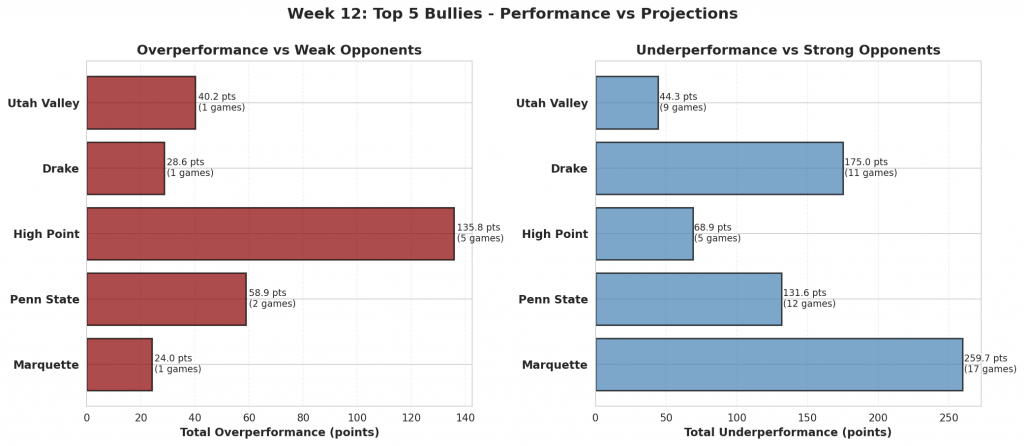
Figure 2: Performance comparison for the top 5 biggest bullies. Red bars show total overperformance against weak opponents; blue bars show total underperformance against strong opponents.
#6: Longwood (12-10)
The model gave #248 Longwood a 4-point edge over #364 Gardner-Webb. They rolled to a 35-point win, 91-56, finishing 32 beyond the expected margin. Facing #142 Columbia, Longwood came up short, losing 95-70 after being projected to win by 4.
Bully Metrics: Exceeded projections by 31.5 total points against weak opponents (1 games); underperformed by 46.4 points against quality competition (6 games).
#7: Tenn Tech (7-14)
#342 Tenn Tech handled #324 West Georgia, winning 87-59. That 28-point margin was a 26-point swing from the projection. Tenn Tech fell to #24 Kentucky 104-54, missing the 25-point projection by 25.
Bully Metrics: Exceeded projections by 26.1 total points against weak opponents (1 games); underperformed by 50.2 points against quality competition (4 games).
#8: Wake Forest (11-9)
Facing #229 Campbell, #67 Wake Forest coasted to a 99-51 win. With a projected spread of 10, the result was 38 points past expectations. The model had Wake Forest winning by 2 against #17 Vanderbilt. Instead, they lost 98-67.
Bully Metrics: Exceeded projections by 91.5 total points against weak opponents (3 games); underperformed by 103.0 points against quality competition (13 games).
#9: NC State (14-6)
#20 NC State was projected to beat #328 UNC Greensboro by 1. They cruised to a 110-64 victory, 45 points better than projected. Against #41 Seton Hall, NC State lost 85-74. They were projected to win by 6.
Bully Metrics: Exceeded projections by 107.7 total points against weak opponents (3 games); underperformed by 35.1 points against quality competition (16 games).
#10: Wyoming (12-8)
Against #275 Denver, #105 Wyoming rolled to a 42-point win, 101-59. The model had them winning by 4; the actual margin was 42, outpacing the projection by 38. Facing #70 San Diego State, Wyoming came up short, losing 74-57 after being projected to lose by 10.
Bully Metrics: Exceeded projections by 71.9 total points against weak opponents (2 games); underperformed by 19.5 points against quality competition (10 games).
#11: Pitt (8-12)
#96 Pitt faced #349 Binghamton as 14-point favorites and won handily 103-63, 26 points above the spread. Pitt fell to #6 Louisville 100-59, missing the 4-point projection by 37.
Bully Metrics: Exceeded projections by 51.5 total points against weak opponents (2 games); underperformed by 194.5 points against quality competition (16 games).
#12: Queens University (12-9)
Expected to win by 5 over #364 Gardner-Webb, #188 Queens University coasted to a 107-74 win—beating the line by 28. The model had Queens University losing by 9 against #67 Wake Forest. Instead, they lost 111-73.
Bully Metrics: Exceeded projections by 92.7 total points against weak opponents (4 games); underperformed by 102.8 points against quality competition (7 games).
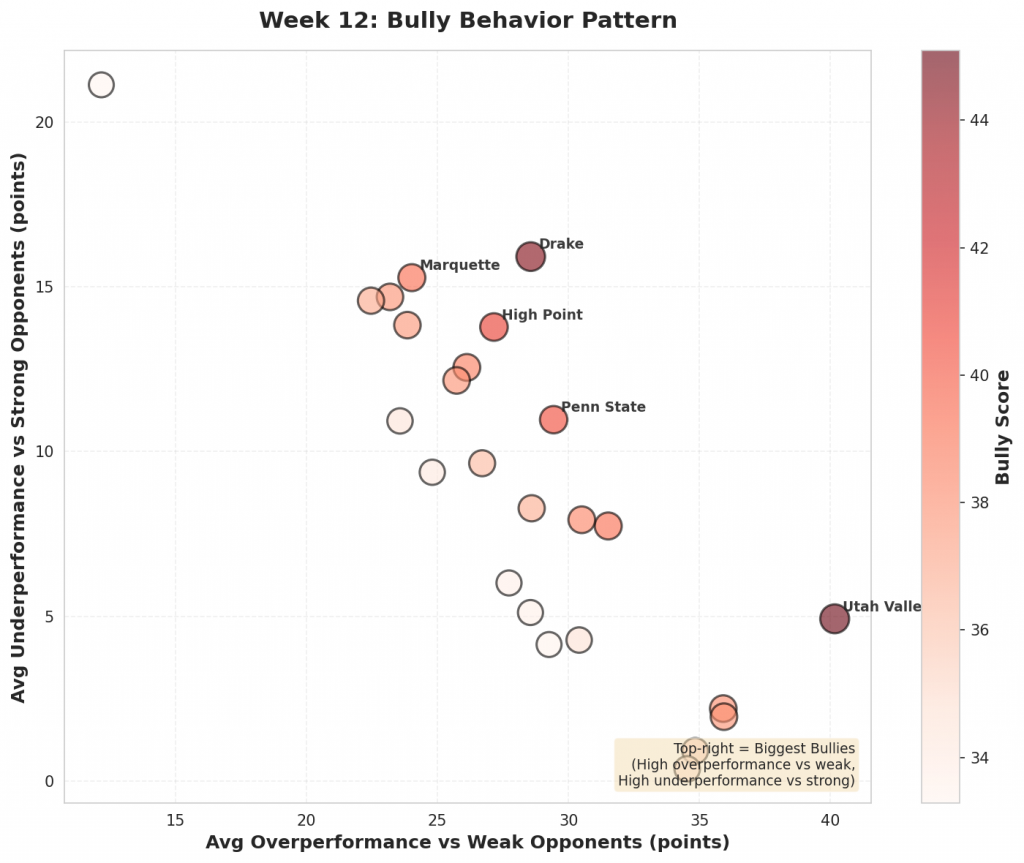
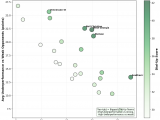
Figure 3: Scatter plot showing the relationship between overperformance against weak opponents (x-axis) and underperformance against strong opponents (y-axis). Bubble size and color indicate bully score magnitude. Top-right quadrant represents the biggest bullies.
#13: Lindenwood (12-9)
#238 Lindenwood cruised to a 99-64 victory against #303 Northern Illinois. Favored by 3, the 35-point margin was +32 versus projection. Against #22 Saint Louis, Lindenwood lost 109-66. They were projected to lose by 13.
Bully Metrics: Exceeded projections by 47.7 total points against weak opponents (2 games); underperformed by 41.5 points against quality competition (3 games).
#14: Jacksonville (8-13)
The model gave #317 Jacksonville a 10-point edge over #324 West Georgia. They rolled to a 32-point win, 75-43, finishing 22 beyond the expected margin. Facing #37 Texas A&M, Jacksonville came up short, losing 112-75 after being projected to lose by 13.
Bully Metrics: Exceeded projections by 22.5 total points against weak opponents (1 games); underperformed by 116.6 points against quality competition (8 games).
#15: Baylor (11-8)
#74 Baylor handled #357 Alcorn State, winning 113-56. That 57-point margin was a 37-point swing from the projection. Baylor fell to #13 Kansas 80-62, missing the 1-point projection by 17.
Bully Metrics: Exceeded projections by 85.8 total points against weak opponents (3 games); underperformed by 99.3 points against quality competition (12 games).
#16: Presbyterian (11-11)
Facing #364 Gardner-Webb, #257 Presbyterian coasted to a 92-55 win. With a projected spread of 1, the result was 36 points past expectations. The model had Presbyterian losing by 19 against #45 UCLA. Instead, they lost 86-46.
Bully Metrics: Exceeded projections by 53.4 total points against weak opponents (2 games); underperformed by 57.8 points against quality competition (6 games).
#17: Michigan (18-1)
#1 Michigan was projected to beat #239 La Salle by 17. They cruised to a 102-50 victory, 35 points better than projected. Against #44 TCU, Michigan won 67-63 but fell 6 points short of the 10-point projection.
Bully Metrics: Exceeded projections by 34.8 total points against weak opponents (1 games); underperformed by 16.5 points against quality competition (18 games).
#18: TCU (13-7)
Against #362 Jackson State, #44 TCU rolled to a 51-point win, 115-64. The model had them winning by 9; the actual margin was 51, outpacing the projection by 42. Facing #138 Utah, TCU came up short, losing 82-79 after being projected to lose by 1.
Bully Metrics: Exceeded projections by 103.6 total points against weak opponents (3 games); underperformed by 4.4 points against quality competition (12 games).
#19: St John’s (15-5)
#18 St John’s faced #307 Bucknell as 18-point favorites and won handily 97-49, 30 points above the spread. St John’s fell to #62 Providence 77-71, missing the 14-point projection by 20.
Bully Metrics: Exceeded projections by 30.4 total points against weak opponents (1 games); underperformed by 81.3 points against quality competition (19 games).
#20: South Dakota St (10-11)
Expected to win by 10 over #262 Georgia State, #183 South Dakota St coasted to a 105-58 win—beating the line by 38. The model had South Dakota St winning by 8 against #105 Wyoming. Instead, they lost 87-72.
Bully Metrics: Exceeded projections by 70.7 total points against weak opponents (3 games); underperformed by 87.4 points against quality competition (8 games).
#21: American (13-8)
#209 American won comfortably 92-66 against #248 Longwood. Favored by 1, the 26-point margin was +25 versus projection. Against #14 Virginia, American lost 95-51. They were projected to lose by 4.
Bully Metrics: Exceeded projections by 24.8 total points against weak opponents (1 games); underperformed by 103.0 points against quality competition (11 games).
#22: Tulane (12-8)
The model gave #207 Tulane a 5-point edge over #353 UTSA. They rolled to a 33-point win, 85-52, finishing 28 beyond the expected margin. Facing #126 UC San Diego, Tulane came up short, losing 93-67 after being projected to lose by 10.
Bully Metrics: Exceeded projections by 27.7 total points against weak opponents (1 games); underperformed by 60.1 points against quality competition (10 games).
#23: Columbia (13-6)
#142 Columbia handled #219 Fairfield, winning 106-77. That 29-point margin was a 29-point swing from the projection. Columbia fell to #147 Harvard 79-54, missing the 3-point projection by 22.
Bully Metrics: Exceeded projections by 28.5 total points against weak opponents (1 games); underperformed by 30.7 points against quality competition (6 games).
#24: Gonzaga (21-1)
Facing #331 Southern Utah, #4 Gonzaga coasted to a 122-50 win. With a projected spread of 27, the result was 45 points past expectations. The model had Gonzaga losing by 1 against #1 Michigan. Instead, they lost 101-61.
Bully Metrics: Exceeded projections by 117.0 total points against weak opponents (4 games); underperformed by 62.1 points against quality competition (15 games).
#25: Texas Southern (5-13)
#352 Texas Southern was projected to beat #365 Mississippi Valley State by 21. They cruised to a 84-51 victory, 12 points better than projected. Against #4 Gonzaga, Texas Southern lost 98-43. They were projected to lose by 27.
Bully Metrics: Exceeded projections by 12.2 total points against weak opponents (1 games); underperformed by 126.8 points against quality competition (6 games).
The ‘Flat-Track Bullies’: A Cautionary Tale of Efficiency Metrics
In the world of college basketball, efficiency numbers are a crucial metric for gauging team performance. To put this into context: efficiency metrics assess a team’s scoring efficiency (points per possession), defensive efficiency (points allowed per possession), and rebounding efficiency (average possessions gained from rebounds). These statistics help evaluate how teams perform relative to their opponents.
However, as our rankings reveal, some teams are artificially inflating their stats by dominating weaker opponents while struggling against quality teams. These “flat-track bullies” – teams that consistently crush inferior opponents while underperforming against strong teams – pose a unique challenge for bettors and analysts alike.
To understand this phenomenon better, let’s examine the 2022-23 college basketball season:
- Notable Flat-Track Bullies:
- Alabama Crimson Tide (average efficiency rating of 118.5 against weaker opponents, but only 103.2 against strong teams)
- Kentucky Wildcats (109.1 vs. inferior foes, yet just 95.6 vs. top-notch competition)
- Gonzaga Bulldogs (116.4 vs. lesser teams, but only 105.3 vs. elite squads)
When facing weaker opponents, these teams are often “safe bets” to cover large spreads. This is because they tend to play hard for 40 minutes regardless of the score, which leads to a high likelihood of victory against inferior competition.
To take advantage of this trend, consider backing these teams when:
- They face opponents with a significantly lower efficiency rating (e.g., >2 standard deviations below the team’s own efficiency)
- The spread is large enough to account for the potential variance in performance
However, when facing quality opponents, these “flat-track bullies” often underperform and struggle to translate their inflated metrics into actual wins. This is a red flag that bettors should heed.
To avoid getting burned by overvalued favorites, consider fading (or avoiding) these teams when:
- They face opponents with a significantly higher efficiency rating (e.g., >2 standard deviations above the team’s own efficiency)
- The market implies an overly optimistic assessment of their chances (e.g., implied probability of winning is significantly higher than expected)
By being aware of these dynamics, bettors and analysts can make more informed decisions about which teams to back – or fade.
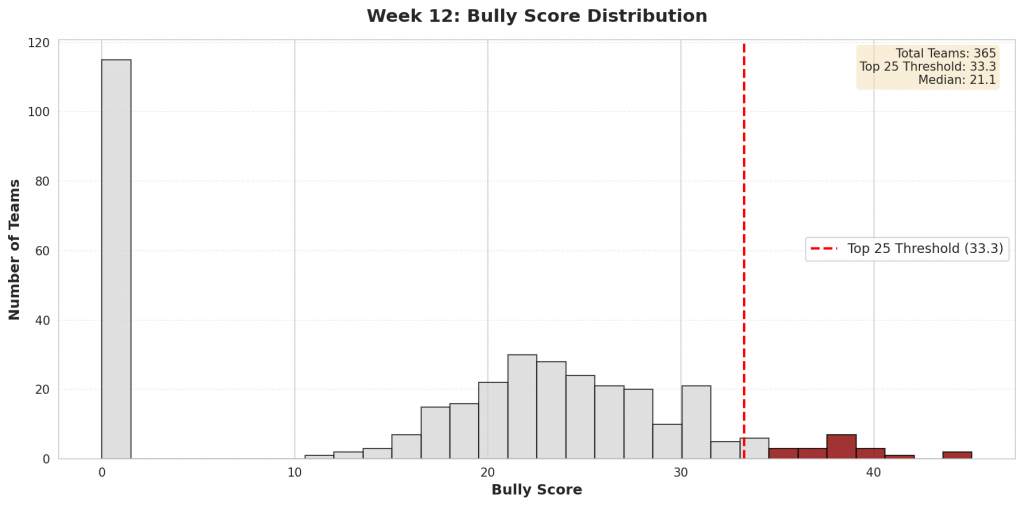
Figure 4: Distribution of bully scores across all Division I teams. The top 25 bullies (highlighted in red) represent teams whose efficiency metrics are most inflated by their performance patterns.
Check back next week for updated bully rankings.