Week 14: 2026’s Biggest Bullies
February 9, 2026College Basketball’s Biggest “Bullies” Revealed
In college basketball, efficiency rankings can be misleading due to teams inflating their statistics against inferior opponents while struggling against quality competition. Our analysis reveals the top three teams that fit this mold.
The Big Three:
- Drake outperformed expectations by +28.6 points versus weaker competition but struggled by -247.4 points versus stronger competition.
- Tenn Tech exceeded expectations by +50.7 points versus weaker competition, while struggling by -73.1 points versus stronger competition.
- Texas Southern outperformed expectations by +43.9 points versus weaker competition but underperformed by -126.8 points versus stronger competition.
These teams’ performances against weaker and stronger opponents paint a telling picture of their strengths and weaknesses.
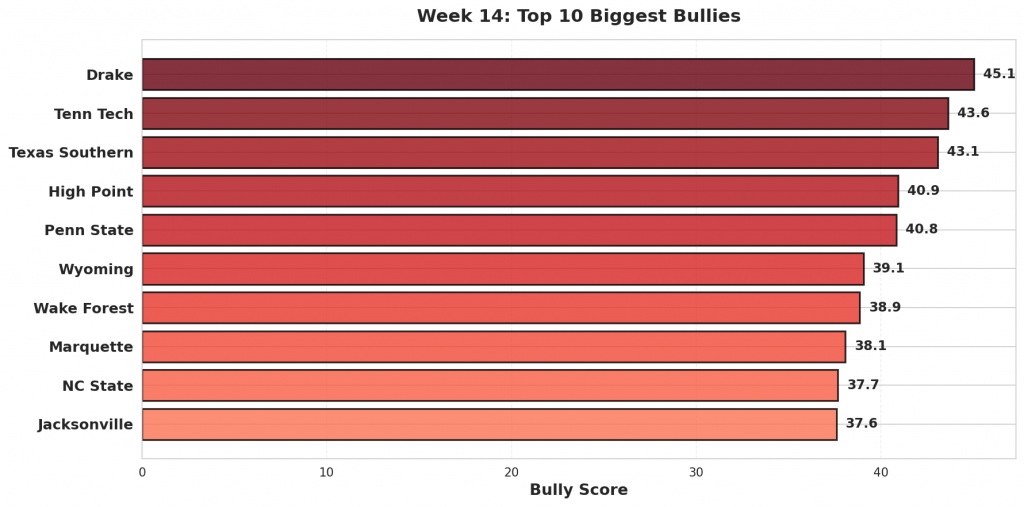
Figure 1: Top 10 teams with the highest bully scores in Week 14. Bully scores reflect the combination of overperformance against weak opponents and underperformance against quality competition.
#1: Drake (12-13)
#165 Drake was projected to beat #363 Western Illinois by 22. They cruised to a 108-57 victory, 29 points better than projected. Against #124 Bradley, Drake lost 93-66. They were projected to win by 5.
Bully Metrics: Exceeded projections by 28.6 total points against weak opponents (1 games); underperformed by 247.4 points against quality competition (15 games).
#2: Tenn Tech (10-15)
Against #318 West Georgia, #325 Tenn Tech pulled away for a 87-59 win. The model had them winning by 2; the actual margin was 28, outpacing the projection by 26. Facing #28 Kentucky, Tenn Tech came up short, losing 104-54 after being projected to lose by 25.
Bully Metrics: Exceeded projections by 50.7 total points against weak opponents (2 games); underperformed by 73.1 points against quality competition (4 games).
#3: Texas Southern (7-14)
#340 Texas Southern faced #329 Alabama State as 0-point favorites and won handily 96-64, 32 points above the spread. Texas Southern fell to #8 Gonzaga 98-43, missing the 27-point projection by 28.
Bully Metrics: Exceeded projections by 43.9 total points against weak opponents (2 games); underperformed by 126.8 points against quality competition (6 games).
#4: High Point (22-4)
Expected to win by 2 over #334 Bryant, #79 High Point coasted to a 93-47 win—beating the line by 44. The model had High Point winning by 9 against #180 Winthrop. Instead, they lost 92-75.
Bully Metrics: Exceeded projections by 135.8 total points against weak opponents (5 games); underperformed by 68.9 points against quality competition (5 games).
#5: Penn State (10-14)
#143 Penn State cruised to a 87-43 victory against #323 New Haven. Favored by 6, the 44-point margin was +38 versus projection. Against #33 Indiana, Penn State lost 113-72. They were projected to lose by 1.
Bully Metrics: Exceeded projections by 58.9 total points against weak opponents (2 games); underperformed by 193.9 points against quality competition (17 games).
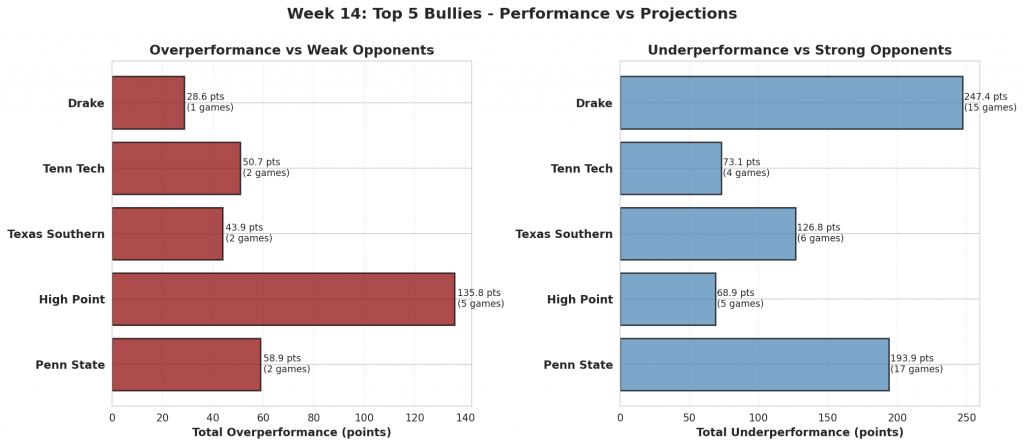
Figure 2: Performance comparison for the top 5 biggest bullies. Red bars show total overperformance against weak opponents; blue bars show total underperformance against strong opponents.
#6: Wyoming (13-11)
The model gave #112 Wyoming a 4-point edge over #247 Denver. They rolled to a 42-point win, 101-59, finishing 38 beyond the expected margin. Facing #26 Utah State, Wyoming came up short, losing 94-62 after being projected to lose by 15.
Bully Metrics: Exceeded projections by 71.9 total points against weak opponents (2 games); underperformed by 43.7 points against quality competition (14 games).
#7: Wake Forest (11-12)
#66 Wake Forest handled #220 Campbell, winning 99-51. That 48-point margin was a 38-point swing from the projection. Wake Forest fell to #18 Vanderbilt 98-67, missing the 2-point projection by 33.
Bully Metrics: Exceeded projections by 91.5 total points against weak opponents (3 games); underperformed by 133.6 points against quality competition (16 games).
#8: Marquette (9-15)
Facing #316 Little Rock, #95 Marquette coasted to a 89-49 win. With a projected spread of 16, the result was 24 points past expectations. The model had Marquette winning by 6 against #33 Indiana. Instead, they lost 100-77.
Bully Metrics: Exceeded projections by 24.0 total points against weak opponents (1 games); underperformed by 281.3 points against quality competition (20 games).
#9: NC State (18-6)
#19 NC State was projected to beat #324 UNC Greensboro by 1. They cruised to a 110-64 victory, 45 points better than projected. Against #39 Seton Hall, NC State lost 85-74. They were projected to win by 6.
Bully Metrics: Exceeded projections by 107.7 total points against weak opponents (3 games); underperformed by 35.1 points against quality competition (20 games).
#10: Jacksonville (9-16)
Against #318 West Georgia, #328 Jacksonville rolled to a 32-point win, 75-43. The model had them winning by 10; the actual margin was 32, outpacing the projection by 22. Facing #40 Texas A&M, Jacksonville came up short, losing 112-75 after being projected to lose by 13.
Bully Metrics: Exceeded projections by 22.5 total points against weak opponents (1 games); underperformed by 106.0 points against quality competition (7 games).
#11: Pitt (9-15)
#109 Pitt faced #351 Binghamton as 14-point favorites and won handily 103-63, 26 points above the spread. Pitt fell to #11 Louisville 100-59, missing the 4-point projection by 37.
Bully Metrics: Exceeded projections by 51.5 total points against weak opponents (2 games); underperformed by 240.9 points against quality competition (21 games).
#12: TCU (14-9)
Expected to win by 9 over #360 Jackson State, #54 TCU coasted to a 115-64 win—beating the line by 42. The model had TCU losing by 0 against #85 Colorado. Instead, they lost 87-61.
Bully Metrics: Exceeded projections by 103.6 total points against weak opponents (3 games); underperformed by 30.0 points against quality competition (15 games).
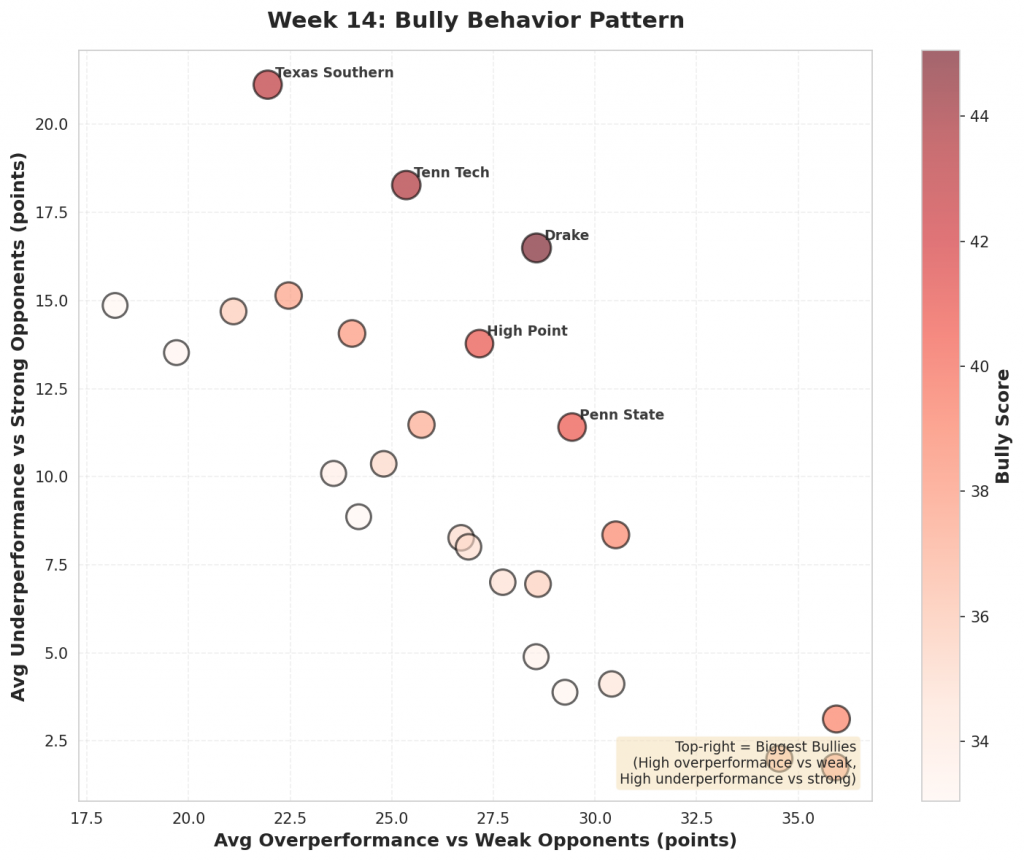
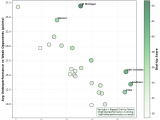
Figure 3: Scatter plot showing the relationship between overperformance against weak opponents (x-axis) and underperformance against strong opponents (y-axis). Bubble size and color indicate bully score magnitude. Top-right quadrant represents the biggest bullies.
#13: Queens University (14-11)
#203 Queens University cruised to a 107-74 victory against #364 Gardner-Webb. Favored by 5, the 33-point margin was +28 versus projection. Against #66 Wake Forest, Queens University lost 111-73. They were projected to lose by 9.
Bully Metrics: Exceeded projections by 105.5 total points against weak opponents (5 games); underperformed by 102.8 points against quality competition (7 games).
#14: Baylor (13-10)
The model gave #57 Baylor a 20-point edge over #359 Alcorn State. They rolled to a 57-point win, 113-56, finishing 37 beyond the expected margin. Facing #14 Kansas, Baylor came up short, losing 80-62 after being projected to lose by 1.
Bully Metrics: Exceeded projections by 85.8 total points against weak opponents (3 games); underperformed by 111.2 points against quality competition (16 games).
#15: American (13-12)
#228 American handled #253 Longwood, winning 92-66. That 26-point margin was a 25-point swing from the projection. American fell to #12 Virginia 95-51, missing the 4-point projection by 40.
Bully Metrics: Exceeded projections by 24.8 total points against weak opponents (1 games); underperformed by 114.0 points against quality competition (11 games).
#16: Presbyterian (12-13)
Facing #364 Gardner-Webb, #260 Presbyterian coasted to a 92-55 win. With a projected spread of 1, the result was 36 points past expectations. The model had Presbyterian losing by 19 against #37 UCLA. Instead, they lost 86-46.
Bully Metrics: Exceeded projections by 53.4 total points against weak opponents (2 games); underperformed by 57.8 points against quality competition (7 games).
#17: Northwestern (10-14)
#72 Northwestern was projected to beat #265 Cleveland State by 4. They cruised to a 110-63 victory, 43 points better than projected. Against #9 Illinois, Northwestern lost 84-44. They were projected to lose by 6.
Bully Metrics: Exceeded projections by 80.7 total points against weak opponents (3 games); underperformed by 152.2 points against quality competition (19 games).
#18: Tulane (13-10)
Against #353 UTSA, #211 Tulane rolled to a 33-point win, 85-52. The model had them winning by 5; the actual margin was 33, outpacing the projection by 28. Facing #64 South Florida, Tulane came up short, losing 97-83 after being projected to win by 3.
Bully Metrics: Exceeded projections by 27.7 total points against weak opponents (1 games); underperformed by 91.1 points against quality competition (13 games).
#19: St John’s (18-5)
#17 St John’s faced #306 Bucknell as 18-point favorites and won handily 97-49, 30 points above the spread. St John’s fell to #51 Providence 77-71, missing the 14-point projection by 20.
Bully Metrics: Exceeded projections by 30.4 total points against weak opponents (1 games); underperformed by 86.5 points against quality competition (21 games).
#20: South Dakota St (11-14)
Expected to win by 10 over #277 Georgia State, #197 South Dakota St coasted to a 105-58 win—beating the line by 38. The model had South Dakota St winning by 8 against #112 Wyoming. Instead, they lost 87-72.
Bully Metrics: Exceeded projections by 70.7 total points against weak opponents (3 games); underperformed by 100.9 points against quality competition (10 games).
#21: Columbia (14-8)
#184 Columbia won comfortably 106-77 against #217 Fairfield. Favored by 0, the 29-point margin was +29 versus projection. Against #133 Harvard, Columbia lost 79-54. They were projected to lose by 3.
Bully Metrics: Exceeded projections by 28.5 total points against weak opponents (1 games); underperformed by 39.1 points against quality competition (8 games).
#22: Lindenwood (15-10)
The model gave #245 Lindenwood a 3-point edge over #286 Northern Illinois. They rolled to a 35-point win, 99-64, finishing 32 beyond the expected margin. Facing #21 Saint Louis, Lindenwood came up short, losing 109-66 after being projected to lose by 13.
Bully Metrics: Exceeded projections by 59.1 total points against weak opponents (3 games); underperformed by 54.1 points against quality competition (4 games).
#23: Gonzaga (23-2)
#8 Gonzaga handled #327 Southern Utah, winning 122-50. That 72-point margin was a 45-point swing from the projection. Gonzaga fell to #1 Michigan 101-61, missing the 1-point projection by 39.
Bully Metrics: Exceeded projections by 117.0 total points against weak opponents (4 games); underperformed by 62.1 points against quality competition (16 games).
#24: Wofford (17-8)
Facing #364 Gardner-Webb, #204 Wofford took care of business, winning 83-57. With a projected spread of 8, the result was 18 points past expectations. The model had Wofford winning by 3 against #159 Elon. Instead, they lost 73-52.
Bully Metrics: Exceeded projections by 18.2 total points against weak opponents (1 games); underperformed by 104.0 points against quality competition (7 games).
#25: Kansas State (10-13)
#107 Kansas State was projected to beat #365 Mississippi Valley State by 32. They cruised to a 108-49 victory, 27 points better than projected. Against #125 Bowling Green, Kansas State lost 82-66. They were projected to win by 9.
Bully Metrics: Exceeded projections by 72.6 total points against weak opponents (3 games); underperformed by 159.5 points against quality competition (18 games).
The “Bully” Teams: Separating Fact from Fiction
In college basketball, some teams consistently dominate weaker opponents while underperforming against stronger competition.
When pitted against weaker teams like Drake versus weaker competition, these “bully” teams are formidable forces to be reckoned with. Their ability to cover large spreads is a testament to their work ethic and dominance. When facing weak opponents, it’s generally safe to bet on these teams as they consistently bring the intensity for 40 minutes regardless of the score.
However, things change dramatically when these teams face quality opponents versus stronger competition. Their inflated efficiency metrics often lead to them being overvalued favorites. As a result, it’s essential to exercise extreme caution when backing these teams versus stronger competition. The data suggests that their inability to adapt and adjust to more formidable opponents leads to underperformance.
Actionable Advice
To navigate the “bully” team conundrum:
- When facing weak teams like Drake versus weaker competition, consider backing these teams as safe bets, given their consistent performance.
- However, when they face stronger competition, be cautious of their inflated metrics and potential overvaluation.
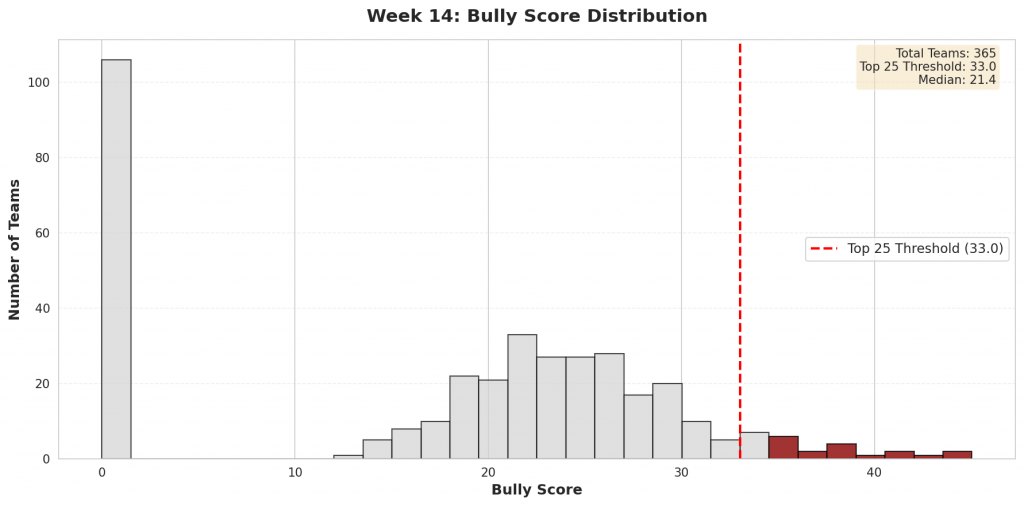
Figure 4: Distribution of bully scores across all Division I teams. The top 25 bullies (highlighted in red) represent teams whose efficiency metrics are most inflated by their performance patterns.
Check back next week for updated bully rankings.