Missouri Valley Update: Week 15
February 16, 2026Strongest Offensive Trends
As we reach the midpoint of conference play, several teams are exhibiting notable shifts in their offensive performances. Here are the top trends to watch:
• Evansville’s Shooting Continues to Excel vs Weaker Teams: Their team has shown a consistent ability to make shots.
• Bradley’s Rebounding Effort is a Struggle: The team’s worsening rebounding efficiency has hindered their overall scoring potential, especially against stronger competition.
• Illinois State’s Off Reb Pct is an Area of Improvement vs Stronger Teams: The team has shown a notable increase in rebounding efficiency, indicating a more well-rounded offense versus weaker teams.
• Drake’s Defense Continues to Excel vs Weaker Competition: Against stronger teams, Drake’s defense has been giving up fewer possessions per game.
Strongest Defensive Trends
Missouri Valley Conference Defensive Trends
The latest defensive trends in the Missouri Valley Conference reveal some notable developments for teams in Week 15.
• Evansville’s Opponent Shooting Struggle: The Purple Aces’ defense has struggled to contain opponents, allowing them to shoot with decreased effectiveness versus weaker competition.
• Drake’s Turnover Forcing Ability Issue (versus stronger competition): Drake’s struggles to force turnovers have hindered their defensive efforts, making it easier for opponents to score against stronger teams.
• Bradley’s Defensive Rebounding is a Bright Spot: The Braves’ defense has excelled at securing rebounds versus weaker competition.
• Illinois State’s Opponent Turnovers Struggle (versus stronger competition): Illinois State’s inability to force turnovers has led to a decline in defensive performance, making it easier for opponents to score against stronger teams.
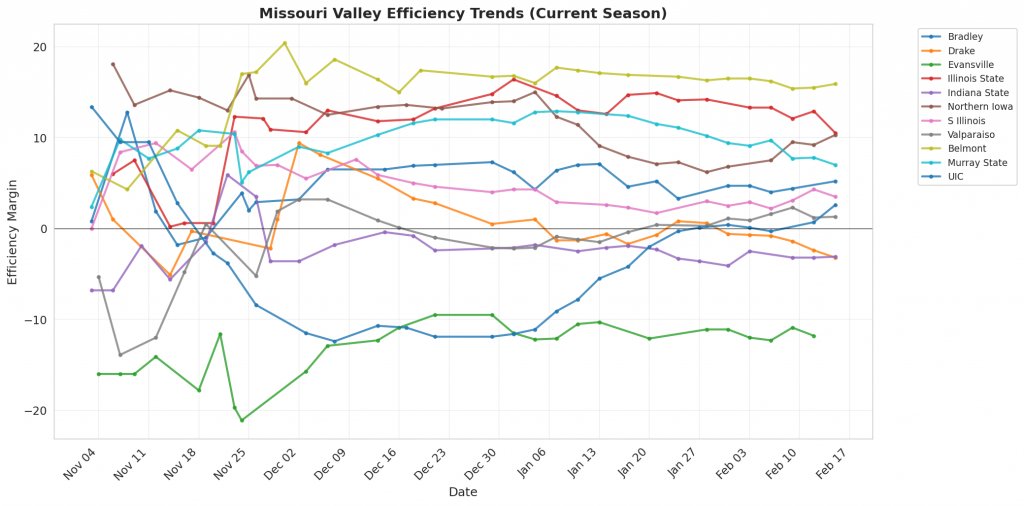
Figure 1: Efficiency margin trends for Missouri Valley teams throughout the season. Teams trending upward show improving performance, while downward trends indicate struggles.
Conference Snapshot
- Week Dates: February 09 – February 15, 2026
- Trending Up (Efficiency): Evansville, Indiana State, Northern Iowa, Valparaiso, Belmont
- Trending Down (Efficiency): Bradley, Drake, Illinois State, S Illinois, Murray State
Team-by-Team Analysis
Belmont
Record: 24-4 | Elo: 1697.7 (ranked 22 of 365) | Efficiency Margin: +15.94 (ranked 45 of 365)
Offensive Trends:
- Shooting (Shooting): Currently ranked 1 of 365 in D1. Trending up strongly 🟢.
- Off Reb Pct (Offensive Rebounding): Currently ranked 213 of 365 in D1. Trending down moderately 🔴.
Defensive Trends:
- Opp Shooting (Opp Shooting): Currently ranked 78 of 365 in D1. Trending up moderately 🔴.
- Opp Turnovers (Opp Turnovers): Currently ranked 138 of 365 in D1. Trending down weakly 🔴.
Bradley
Record: 18-9 | Elo: 1642.2 (ranked 47 of 365) | Efficiency Margin: +5.16 (ranked 113 of 365)
Offensive Trends:
- Off Reb Pct (Offensive Rebounding): Currently ranked 290 of 365 in D1. Trending down strongly 🔴.
- Shooting (Shooting): Currently ranked 208 of 365 in D1. Trending down moderately 🔴.
Defensive Trends:
- Opp Shooting (Opp Shooting): Currently ranked 226 of 365 in D1. Trending down moderately 🟢.
- Opp Turnovers (Opp Turnovers): Currently ranked 33 of 365 in D1. Trending down moderately 🔴.
Drake
Record: 10-16 | Elo: 1559.6 (ranked 105 of 365) | Efficiency Margin: -3.19 (ranked 192 of 365)
Offensive Trends:
- Shooting (Shooting): Currently ranked 160 of 365 in D1. Trending down moderately 🔴.
- Turnovers (Turnovers): Currently ranked 36 of 365 in D1. Trending down weakly 🟢.
Defensive Trends:
- Opp Shooting (Opp Shooting): Currently ranked 274 of 365 in D1. Trending up strongly 🔴.
- Opp Turnovers (Opp Turnovers): Currently ranked 307 of 365 in D1. Trending down strongly 🔴.
Evansville
Record: 6-20 | Elo: 1372.0 (ranked 329 of 365) | Efficiency Margin: -11.76 (ranked 269 of 365)
Offensive Trends:
- Shooting (Shooting): Currently ranked 280 of 365 in D1. Trending up strongly 🟢.
- Off Reb Pct (Offensive Rebounding): Currently ranked 348 of 365 in D1. Trending down strongly 🔴.
Defensive Trends:
- Opp Shooting (Opp Shooting): Currently ranked 306 of 365 in D1. Trending up strongly 🔴.
- Opp Turnovers (Opp Turnovers): Currently ranked 226 of 365 in D1. Trending down strongly 🔴.
Illinois State
Record: 17-10 | Elo: 1555.0 (ranked 113 of 365) | Efficiency Margin: +10.47 (ranked 79 of 365)
Offensive Trends:
- Shooting (Shooting): Currently ranked 75 of 365 in D1. Trending down strongly 🔴.
- Off Reb Pct (Offensive Rebounding): Currently ranked 228 of 365 in D1. Trending down strongly 🔴.
Defensive Trends:
- Opp Shooting (Opp Shooting): Currently ranked 79 of 365 in D1. Trending up moderately 🔴.
- Opp Turnovers (Opp Turnovers): Currently ranked 197 of 365 in D1. Trending down moderately 🔴.
Indiana State
Record: 10-17 | Elo: 1449.7 (ranked 252 of 365) | Efficiency Margin: -3.10 (ranked 189 of 365)
Offensive Trends:
- Shooting (Shooting): Currently ranked 107 of 365 in D1. Trending up weakly 🟢.
- Turnovers (Turnovers): Currently ranked 300 of 365 in D1. Trending down weakly 🟢.
Defensive Trends:
- Def Reb Pct (Defensive Rebounding): Currently ranked 280 of 365 in D1. Trending down strongly 🔴.
- Opp Shooting (Opp Shooting): Currently ranked 126 of 365 in D1. Trending up weakly 🔴.
Murray State
Record: 19-9 | Elo: 1567.9 (ranked 91 of 365) | Efficiency Margin: +6.96 (ranked 99 of 365)
Offensive Trends:
- Turnovers (Turnovers): Currently ranked 207 of 365 in D1. Trending up strongly 🔴.
- Shooting (Shooting): Currently ranked 61 of 365 in D1. Trending down weakly 🔴.
Defensive Trends:
- Opp Shooting (Opp Shooting): Currently ranked 186 of 365 in D1. Trending up strongly 🔴.
- Opp Turnovers (Opp Turnovers): Currently ranked 245 of 365 in D1. Trending down weakly 🔴.
Northern Iowa
Record: 17-10 | Elo: 1577.9 (ranked 84 of 365) | Efficiency Margin: +10.27 (ranked 81 of 365)
Offensive Trends:
- Shooting (Shooting): Currently ranked 134 of 365 in D1. Trending up strongly 🟢.
- Turnovers (Turnovers): Currently ranked 38 of 365 in D1. Trending down moderately 🟢.
Defensive Trends:
- Def Reb Pct (Defensive Rebounding): Currently ranked 9 of 365 in D1. Trending up strongly 🟢.
- Opp Shooting (Opp Shooting): Currently ranked 26 of 365 in D1. Trending up moderately 🔴.
S Illinois
Record: 12-15 | Elo: 1485.4 (ranked 201 of 365) | Efficiency Margin: +3.52 (ranked 125 of 365)
Offensive Trends:
- Shooting (Shooting): Currently ranked 251 of 365 in D1. Trending down strongly 🔴.
- Turnovers (Turnovers): Currently ranked 236 of 365 in D1. Trending down strongly 🟢.
Defensive Trends:
- Def Reb Pct (Defensive Rebounding): Currently ranked 37 of 365 in D1. Trending up strongly 🟢.
- Opp Turnovers (Opp Turnovers): Currently ranked 85 of 365 in D1. Trending up moderately 🟢.
UIC
Record: 15-12 | Elo: 1528.2 (ranked 142 of 365) | Efficiency Margin: +2.59 (ranked 134 of 365)
Offensive Trends:
- Turnovers (Turnovers): Currently ranked 201 of 365 in D1. Trending down moderately 🟢.
- Shooting (Shooting): Currently ranked 301 of 365 in D1. Trending up weakly 🟢.
Defensive Trends:
- Opp Turnovers (Opp Turnovers): Currently ranked 27 of 365 in D1. Trending up strongly 🟢.
- Def Reb Pct (Defensive Rebounding): Currently ranked 319 of 365 in D1. Trending up strongly 🟢.
Valparaiso
Record: 14-13 | Elo: 1483.3 (ranked 207 of 365) | Efficiency Margin: +1.30 (ranked 148 of 365)
Offensive Trends:
- Shooting (Shooting): Currently ranked 323 of 365 in D1. Trending up moderately 🟢.
- Off Reb Pct (Offensive Rebounding): Currently ranked 117 of 365 in D1. Trending up moderately 🟢.
Defensive Trends:
- Opp Turnovers (Opp Turnovers): Currently ranked 176 of 365 in D1. Trending down strongly 🔴.
- Opp Shooting (Opp Shooting): Currently ranked 117 of 365 in D1. Trending up moderately 🔴.
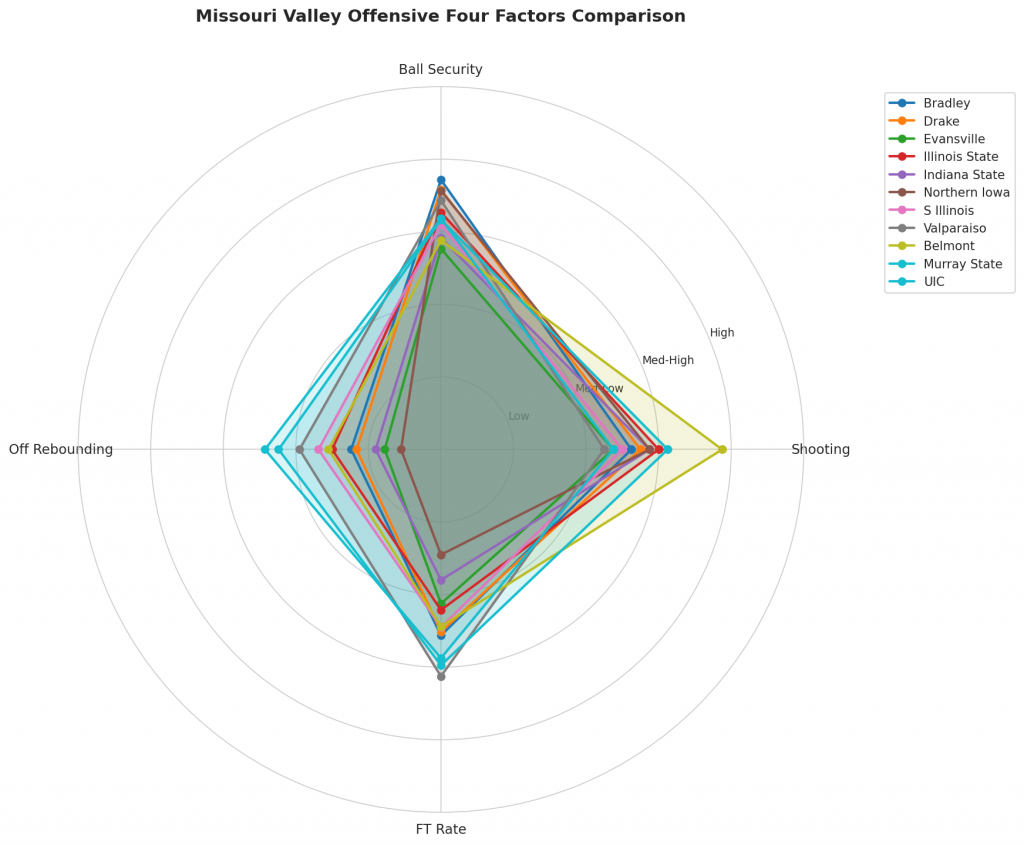
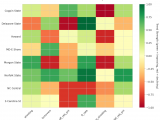
Figure 2: Offensive Four Factors comparison across Missouri Valley teams. The radar chart shows each team’s shooting efficiency (eFG%), ball security (TOV%), offensive rebounding (OREB%), and free throw generation (FT Rate).
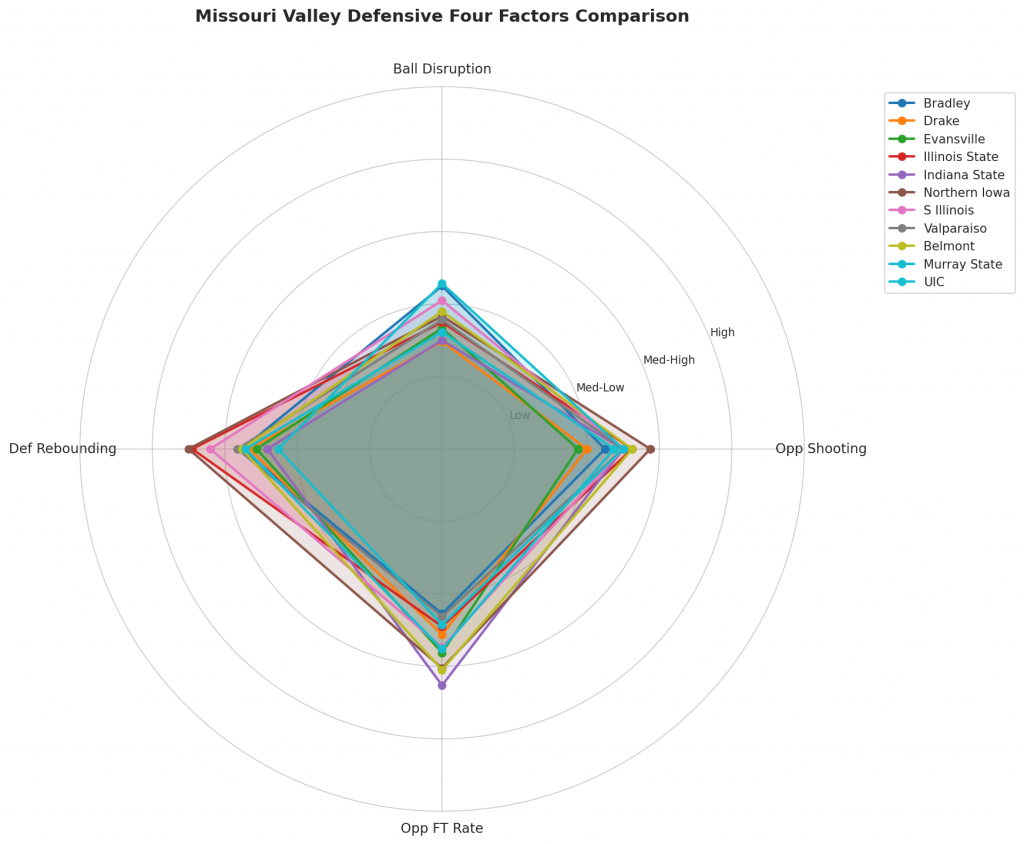
Figure 3: Defensive Four Factors comparison across Missouri Valley teams. The radar chart shows each team’s opponent shooting defense (Opp eFG%), ball disruption (forcing TOV%), defensive rebounding (DREB%), and opponent free throw prevention (Opp FT Rate).
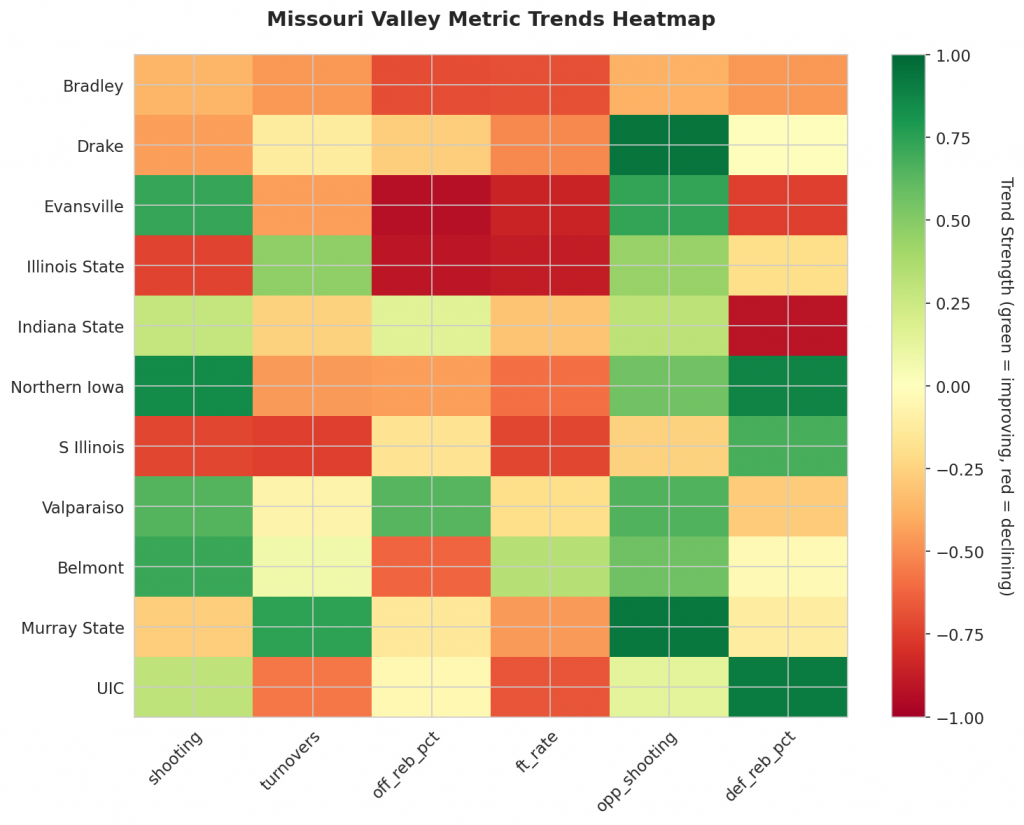
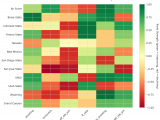
Figure 4: MACD trends heatmap showing which metrics are improving (green) or declining (red) for each team. Stronger colors indicate more pronounced trends.
Looking Ahead
Missouri Valley Teams Face Momentum Shifts in Week 15 Analysis
As the Missouri Valley Conference nears its midpoint, key trends emerge from the data-driven analysis of Week 15. This article highlights the most significant shifts in team performance, prioritizing trends that indicate genuine improvement or unsustainable momentum.
Key Offensive Trends:
Bradley’s shooting has struggled versus stronger competition with a season average of 0.48 versus weaker teams. A closer examination reveals that they have been unable to replicate their early-season numbers when facing tougher opponents. This inconsistency may hinder Bradley’s chances in upcoming matches.
Evansville’s shooting has shown an upward trend, with a season average of 0.49 versus weaker teams. Evansville’s ability to adapt its offense and capitalize on opportunities against weaker competition is likely the primary driver behind this surge in scoring.
Key Defensive Trends:
Drake’s opponents’ shooting percentages have increased, indicating a struggle versus stronger competition with an upward trend and a season average of 0.54 versus weaker teams. Despite this trend, Drake’s overall defense remains solid, but they will need to find ways to slow down high-powered offenses as the conference heats up.
Evansville’s turnover-forcing ability has decreased, resulting in fewer turnovers compared to its season average of 0.14 versus stronger competition. This shift may be a concern for Evansville, which relies heavily on its defensive prowess to fuel its offense.
Momentum Indicators:
The MACD indicator reveals that some teams are experiencing significant shifts in momentum. The magnitude indicator provides a valuable tool for analysts and coaches alike to track the ebbs and flows of each team’s performance. While the exact formula used by the MACD is not publicly disclosed, it offers essential insights into team performance trends.
This analysis sets the stage for Week 16, where teams must adapt to these shifting momentum indicators and performance trends. Check back next week for updated analysis on how these teams respond to these changes.
Metrics Glossary
Four Factors (Dean Oliver’s framework for basketball success):
- eFG% (Effective Field Goal %): Field goal percentage adjusted for 3-pointers being worth more (FGM + 0.5×3PM) / FGA. Higher is better offensively, lower is better defensively.
- TOV% (Turnover Rate): Turnovers per 100 possessions. Lower is better offensively (taking care of the ball), higher is better defensively (forcing turnovers).
- OREB% / DREB% (Offensive/Defensive Rebound Rate): Percentage of available rebounds grabbed. Offensive rebounds create second-chance points; defensive rebounds end opponent possessions.
- FTR (Free Throw Rate): Free throws made per field goal attempt (FTM/FGA). Measures ability to get to the line AND convert. Higher is better offensively, lower is better defensively.
Other Metrics:
- Elo Rating: Chess-style rating system that updates based on game results and opponent strength. Higher Elo indicates stronger team.
- Efficiency Margin: Point differential per 100 possessions (Offensive Efficiency – Defensive Efficiency). Accounts for pace of play.
- MACD (Moving Average Convergence Divergence): Trend indicator comparing 12-game and 26-game exponential moving averages. Positive MACD = improving trend, Negative MACD = declining trend.
Analysis powered by HoopSci’s advanced metrics and MACD trending indicators.