Ohio Valley Update: Week 15
February 16, 2026Strongest Offensive Trends
Top Offensive Trends in the Ohio Valley Conference
After analyzing Week 15 data, we’ve identified key trends that are shaping the conference’s top offenses:
- Morehead State’s shooting accuracy from beyond the arc has improved noticeably versus weaker competition, where they have achieved an impressive mark.
- SIUE’s turnover problem is plaguing the team, putting pressure on their defense and limiting scoring opportunities versus stronger competition.
- SE Missouri St is struggling to contain opponents’ scoring surges due to their inability to secure rebounds versus stronger competition.
- Tennessee St’s shooting accuracy from beyond the arc has improved noticeably.
Strongest Defensive Trends
Ohio Valley Conference Defensive Trends Report
As we reach Week 15 in the Ohio Valley Conference, several teams are showing promising defensive trends that could impact their standings.
Here are the top defensive trends to note:
- SE Missouri St’s Opponent Turnovers are Struggling: This trend indicates a problem for SE Missouri St’s defense versus weaker competition.
- Morehead State: Opp Shooting is Improving versus stronger competition.
- Tennessee St’s Opponent Turnovers are Worsening: The team is struggling to contain opponent scoring threats, particularly against stronger teams.
- UT Martin’s Opponent Shooting is Worsening: This trend suggests a problem for UT Martin’s defense in containing opponent scoring threats.
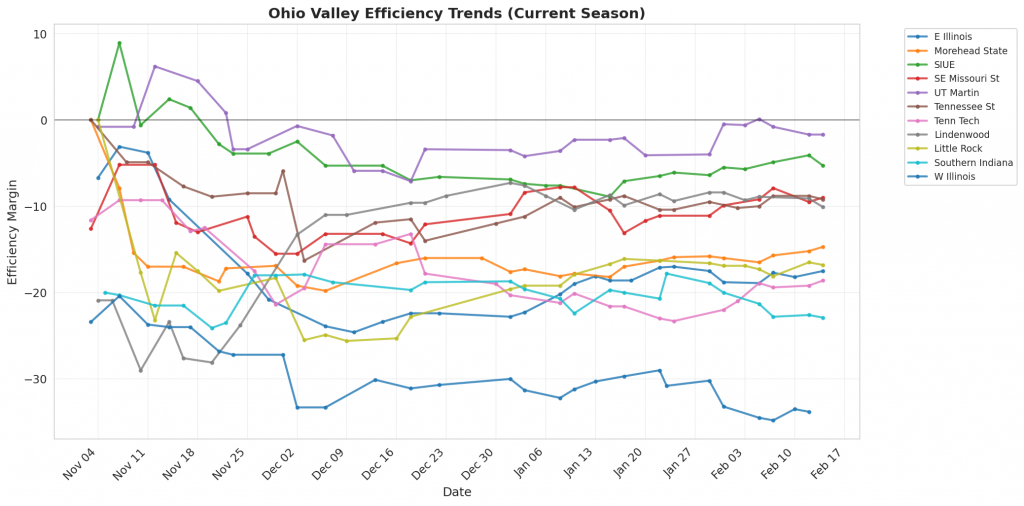
Figure 1: Efficiency margin trends for Ohio Valley teams throughout the season. Teams trending upward show improving performance, while downward trends indicate struggles.
Conference Snapshot
- Week Dates: February 09 – February 15, 2026
- Trending Up (Efficiency): E Illinois, Morehead State, SIUE, UT Martin, Tenn Tech
- Trending Down (Efficiency): SE Missouri St, Tennessee St, Little Rock, Southern Indiana, W Illinois
Team-by-Team Analysis
E Illinois
Record: 10-16 | Elo: 1381.8 (ranked 321 of 365) | Efficiency Margin: -17.49 (ranked 310 of 365)
Offensive Trends:
- Turnovers (Turnovers): Currently ranked 256 of 365 in D1. Trending down moderately 🟢.
- Off Reb Pct (Offensive Rebounding): Currently ranked 302 of 365 in D1. Trending up moderately 🟢.
Defensive Trends:
- Opp Turnovers (Opp Turnovers): Currently ranked 45 of 365 in D1. Trending down moderately 🔴.
- Opp Shooting (Opp Shooting): Currently ranked 129 of 365 in D1. Trending down weakly 🟢.
Lindenwood
Record: 16-11 | Elo: 1454.5 (ranked 245 of 365) | Efficiency Margin: -10.07 (ranked 254 of 365)
Offensive Trends:
- Turnovers (Turnovers): Currently ranked 315 of 365 in D1. Trending up moderately 🔴.
- Off Reb Pct (Offensive Rebounding): Currently ranked 133 of 365 in D1. Trending down moderately 🔴.
Defensive Trends:
- Opp Shooting (Opp Shooting): Currently ranked 99 of 365 in D1. Trending up weakly 🔴.
- Opp Turnovers (Opp Turnovers): Currently ranked 97 of 365 in D1. Trending up weakly 🟢.
Little Rock
Record: 9-17 | Elo: 1425.0 (ranked 284 of 365) | Efficiency Margin: -16.78 (ranked 307 of 365)
Offensive Trends:
- Turnovers (Turnovers): Currently ranked 309 of 365 in D1. Trending down strongly 🟢.
- Shooting (Shooting): Currently ranked 263 of 365 in D1. Trending down moderately 🔴.
Defensive Trends:
- Opp Shooting (Opp Shooting): Currently ranked 282 of 365 in D1. Trending down strongly 🟢.
- Opp Turnovers (Opp Turnovers): Currently ranked 49 of 365 in D1. Trending down strongly 🔴.
Morehead State
Record: 15-12 | Elo: 1487.1 (ranked 198 of 365) | Efficiency Margin: -14.74 (ranked 292 of 365)
Offensive Trends:
- Shooting (Shooting): Currently ranked 265 of 365 in D1. Trending up strongly 🟢.
- Off Reb Pct (Offensive Rebounding): Currently ranked 28 of 365 in D1. Trending down moderately 🔴.
Defensive Trends:
- Opp Shooting (Opp Shooting): Currently ranked 129 of 365 in D1. Trending down strongly 🟢.
- Def Reb Pct (Defensive Rebounding): Currently ranked 342 of 365 in D1. Trending down strongly 🔴.
SE Missouri St
Record: 16-11 | Elo: 1505.2 (ranked 175 of 365) | Efficiency Margin: -8.97 (ranked 246 of 365)
Offensive Trends:
- Off Reb Pct (Offensive Rebounding): Currently ranked 179 of 365 in D1. Trending down strongly 🔴.
- Shooting (Shooting): Currently ranked 186 of 365 in D1. Trending down moderately 🔴.
Defensive Trends:
- Opp Turnovers (Opp Turnovers): Currently ranked 91 of 365 in D1. Trending down strongly 🔴.
- Opp Shooting (Opp Shooting): Currently ranked 167 of 365 in D1. Trending down moderately 🟢.
SIUE
Record: 17-10 | Elo: 1520.4 (ranked 152 of 365) | Efficiency Margin: -5.33 (ranked 211 of 365)
Offensive Trends:
- Shooting (Shooting): Currently ranked 264 of 365 in D1. Trending up strongly 🟢.
- Turnovers (Turnovers): Currently ranked 240 of 365 in D1. Trending up strongly 🔴.
Defensive Trends:
- Opp Shooting (Opp Shooting): Currently ranked 13 of 365 in D1. Trending down weakly 🟢.
- Opp Turnovers (Opp Turnovers): Currently ranked 182 of 365 in D1. Trending up weakly 🟢.
Southern Indiana
Record: 5-21 | Elo: 1267.2 (ranked 368 of 365) | Efficiency Margin: -22.86 (ranked 339 of 365)
Offensive Trends:
- Shooting (Shooting): Currently ranked 362 of 365 in D1. Trending down moderately 🔴.
- Turnovers (Turnovers): Currently ranked 165 of 365 in D1. Trending down moderately 🟢.
Defensive Trends:
- Def Reb Pct (Defensive Rebounding): Currently ranked 296 of 365 in D1. Trending down strongly 🔴.
- Opp Shooting (Opp Shooting): Currently ranked 74 of 365 in D1. Trending up weakly 🔴.
Tenn Tech
Record: 11-16 | Elo: 1382.5 (ranked 317 of 365) | Efficiency Margin: -18.64 (ranked 321 of 365)
Offensive Trends:
- Shooting (Shooting): Currently ranked 234 of 365 in D1. Trending up moderately 🟢.
- Turnovers (Turnovers): Currently ranked 318 of 365 in D1. Trending down moderately 🟢.
Defensive Trends:
- Opp Shooting (Opp Shooting): Currently ranked 221 of 365 in D1. Trending down moderately 🟢.
- Opp Turnovers (Opp Turnovers): Currently ranked 279 of 365 in D1. Trending down moderately 🔴.
Tennessee St
Record: 17-9 | Elo: 1512.5 (ranked 162 of 365) | Efficiency Margin: -9.24 (ranked 250 of 365)
Offensive Trends:
- Turnovers (Turnovers): Currently ranked 117 of 365 in D1. Trending down strongly 🟢.
- Shooting (Shooting): Currently ranked 276 of 365 in D1. Trending down moderately 🔴.
Defensive Trends:
- Opp Shooting (Opp Shooting): Currently ranked 257 of 365 in D1. Trending up strongly 🔴.
- Opp Turnovers (Opp Turnovers): Currently ranked 34 of 365 in D1. Trending down weakly 🔴.
UT Martin
Record: 20-7 | Elo: 1521.2 (ranked 151 of 365) | Efficiency Margin: -1.68 (ranked 176 of 365)
Offensive Trends:
- Shooting (Shooting): Currently ranked 197 of 365 in D1. Trending up moderately 🟢.
- Turnovers (Turnovers): Currently ranked 357 of 365 in D1. Trending up moderately 🔴.
Defensive Trends:
- Opp Turnovers (Opp Turnovers): Currently ranked 73 of 365 in D1. Trending up strongly 🟢.
- Def Reb Pct (Defensive Rebounding): Currently ranked 226 of 365 in D1. Trending down moderately 🔴.
W Illinois
Record: 5-22 | Elo: 1296.4 (ranked 362 of 365) | Efficiency Margin: -33.78 (ranked 362 of 365)
Offensive Trends:
- Off Reb Pct (Offensive Rebounding): Currently ranked 294 of 365 in D1. Trending down strongly 🔴.
- Shooting (Shooting): Currently ranked 361 of 365 in D1. Trending down moderately 🔴.
Defensive Trends:
- Opp Shooting (Opp Shooting): Currently ranked 295 of 365 in D1. Trending up moderately 🔴.
- Opp Turnovers (Opp Turnovers): Currently ranked 304 of 365 in D1. Trending down moderately 🔴.
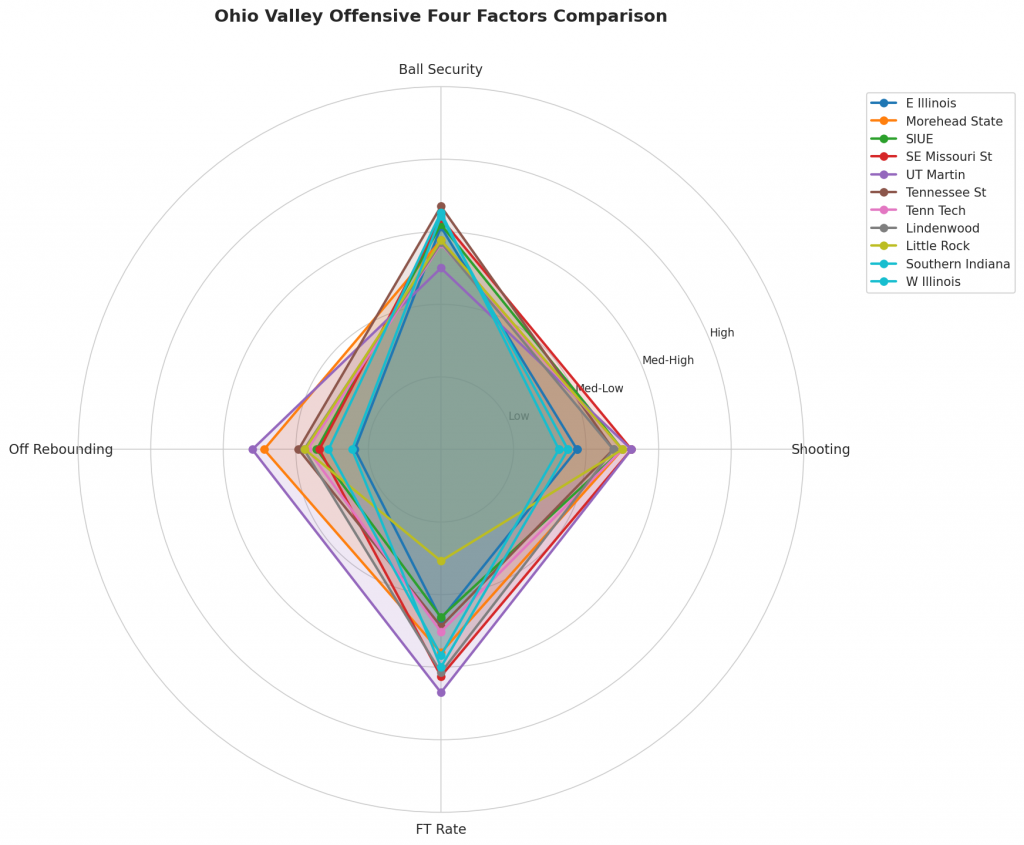
Figure 2: Offensive Four Factors comparison across Ohio Valley teams. The radar chart shows each team’s shooting efficiency (eFG%), ball security (TOV%), offensive rebounding (OREB%), and free throw generation (FT Rate).
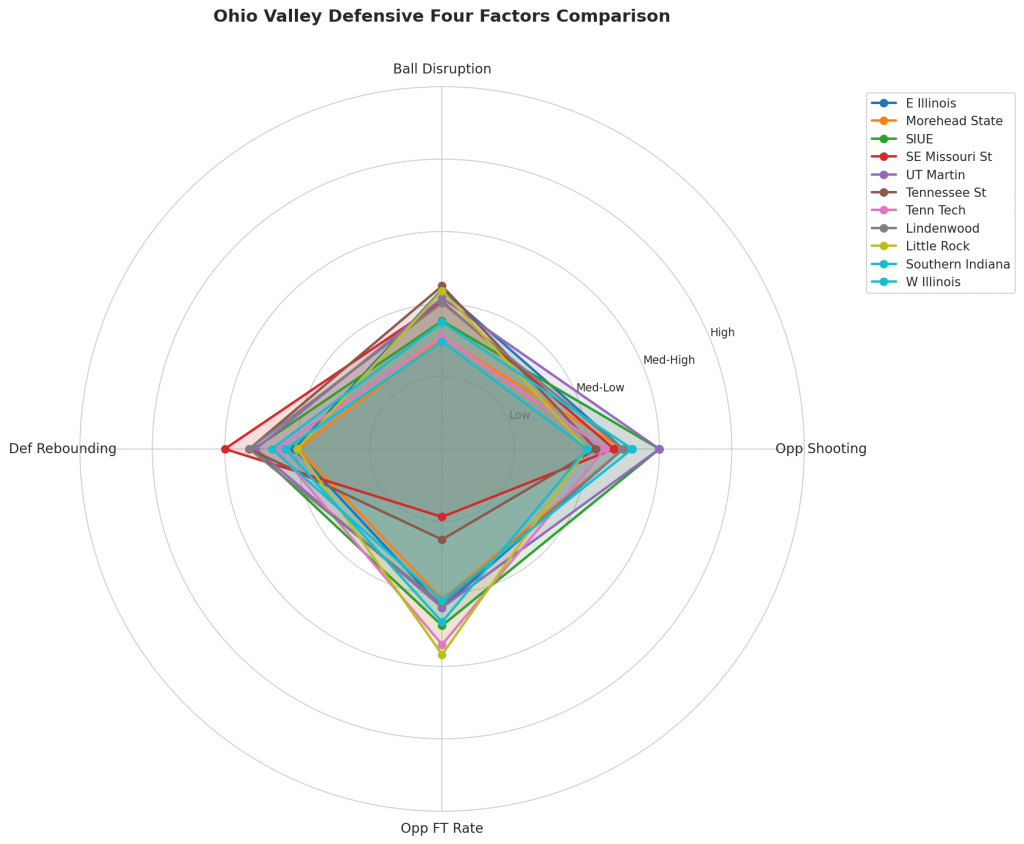
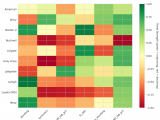
Figure 3: Defensive Four Factors comparison across Ohio Valley teams. The radar chart shows each team’s opponent shooting defense (Opp eFG%), ball disruption (forcing TOV%), defensive rebounding (DREB%), and opponent free throw prevention (Opp FT Rate).
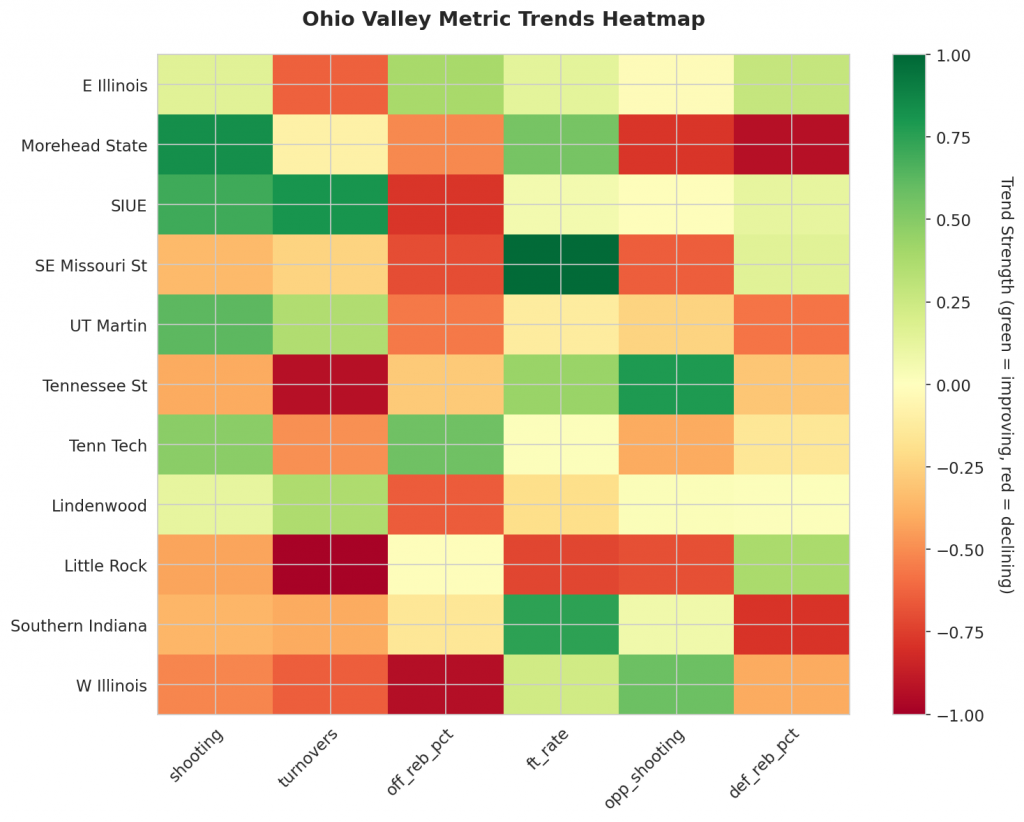
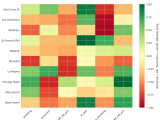
Figure 4: MACD trends heatmap showing which metrics are improving (green) or declining (red) for each team. Stronger colors indicate more pronounced trends.
Looking Ahead
Ohio Valley Teams Show Mixed Results in Key Metrics
As Week 15 comes to a close, we take a closer look at the trends that have emerged from the Ohio Valley teams’ performances.
Morehead State and SIUE are both seeing increases in shooting percentage versus weaker competition. This uptick in shooting accuracy has been accompanied by an improvement in these teams’ offenses, with Morehead State’s trend marked as Strongly trending up (Season Avg: 0.5) for this metric. However, SIUE is struggling with turnovers versus stronger competition, which has increased significantly and compromised their efficiency on offense.
Morehead State has also made strides in limiting its opponents’ scoring opportunities versus weaker competition. The Eagles’ defensive prowess is evident in their downward trending opponent shooting percentage versus weaker competition (trending down by 5% this season), a metric that accurately reflects the team’s performance. Additionally, Morehead State’s defensive rebounding percentage versus stronger competition has declined by 2%.
SE Missouri St and UT Martin have also shown improvements on defense versus weaker competition. However, SE Missouri St’s performance does not necessarily translate to stronger teams.
The MACD indicator is a momentum indicator that continues to be a crucial tool for tracking these shifts in performance. It measures the difference between a team’s current trend and its past trend, providing valuable insights into which teams are genuinely improving versus those riding unsustainable momentum.
As we continue to analyze the Ohio Valley teams’ progress, it’s essential to consider these trends and how they may impact future performances. Be sure to check back next week for updated analysis and further insights into the Ohio Valley teams’ progress.
Metrics Glossary
Four Factors (Dean Oliver’s framework for basketball success):
- eFG% (Effective Field Goal %): Field goal percentage adjusted for 3-pointers being worth more (FGM + 0.5×3PM) / FGA. Higher is better offensively, lower is better defensively.
- TOV% (Turnover Rate): Turnovers per 100 possessions. Lower is better offensively (taking care of the ball), higher is better defensively (forcing turnovers).
- OREB% / DREB% (Offensive/Defensive Rebound Rate): Percentage of available rebounds grabbed. Offensive rebounds create second-chance points; defensive rebounds end opponent possessions.
- FTR (Free Throw Rate): Free throws made per field goal attempt (FTM/FGA). Measures ability to get to the line AND convert. Higher is better offensively, lower is better defensively.
Other Metrics:
- Elo Rating: Chess-style rating system that updates based on game results and opponent strength. Higher Elo indicates stronger team.
- Efficiency Margin: Point differential per 100 possessions (Offensive Efficiency – Defensive Efficiency). Accounts for pace of play.
- MACD (Moving Average Convergence Divergence): Trend indicator comparing 12-game and 26-game exponential moving averages. Positive MACD = improving trend, Negative MACD = declining trend.
Analysis powered by HoopSci’s advanced metrics and MACD trending indicators.