Summit League Update: Week 15
February 16, 2026Strongest Offensive Trends
- North Dakota St struggles with defensive rebounding, particularly versus stronger competition, which worsens their chances of securing rebounds and maintaining possession.
- Omaha’s shooting performance has improved significantly versus weaker competition, driving their offense forward in recent games.
- Oral Roberts’ poor free throw shooting is a significant problem for the team, as they struggle to capitalize on scoring opportunities at the line, particularly versus stronger competition.
- South Dakota’s turnover issues have worsened versus stronger competition, negatively impacting their overall efficiency and ability to compete effectively.
Strongest Defensive Trends
• North Dakota’s Defensive Rebounding Percentage is worsening versus stronger competition, posing a problem as the team struggles to contain opponents’ rebounding efforts.
• Denver’s Opponent Turnovers are decreasing against weaker competition, which may be contributing to the team’s offense struggling to create scoring opportunities.
• North Dakota St’s Opponent Shooting Percentage is improving versus stronger competition.
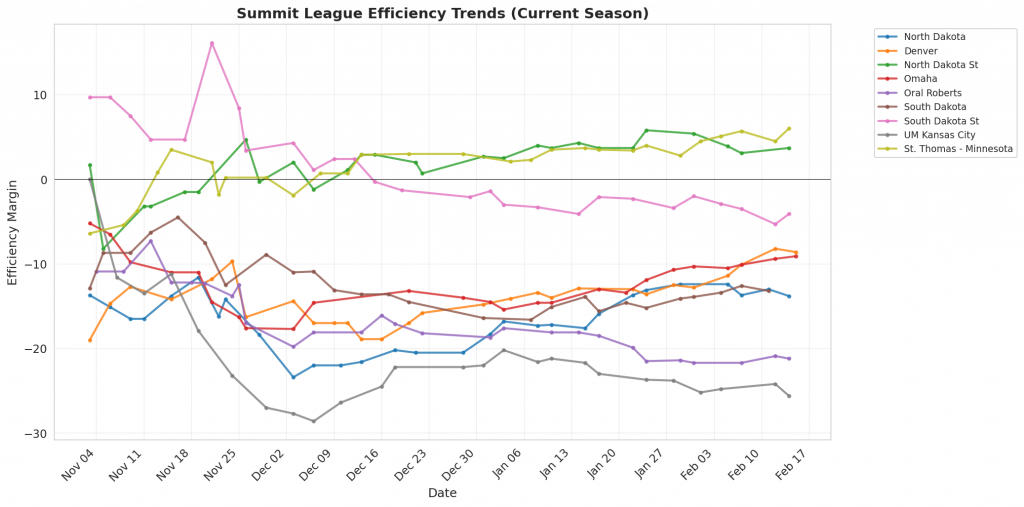
Figure 1: Efficiency margin trends for Summit League teams throughout the season. Teams trending upward show improving performance, while downward trends indicate struggles.
Conference Snapshot
- Week Dates: February 09 – February 15, 2026
- Trending Up (Efficiency): North Dakota, Denver, North Dakota St, Omaha, St. Thomas – Minnesota
- Trending Down (Efficiency): Oral Roberts, South Dakota, South Dakota St, UM Kansas City
Team-by-Team Analysis
Denver
Record: 13-15 | Elo: 1421.6 (ranked 288 of 365) | Efficiency Margin: -8.57 (ranked 241 of 365)
Offensive Trends:
- Turnovers (Turnovers): Currently ranked 39 of 365 in D1. Trending down moderately 🟢.
- Shooting (Shooting): Currently ranked 78 of 365 in D1. Trending up weakly 🟢.
Defensive Trends:
- Opp Shooting (Opp Shooting): Currently ranked 337 of 365 in D1. Trending down strongly 🟢.
- Opp Turnovers (Opp Turnovers): Currently ranked 357 of 365 in D1. Trending down strongly 🔴.
North Dakota
Record: 15-14 | Elo: 1453.7 (ranked 247 of 365) | Efficiency Margin: -13.77 (ranked 284 of 365)
Offensive Trends:
- Turnovers (Turnovers): Currently ranked 23 of 365 in D1. Trending down strongly 🟢.
- Off Reb Pct (Offensive Rebounding): Currently ranked 240 of 365 in D1. Trending down strongly 🔴.
Defensive Trends:
- Def Reb Pct (Defensive Rebounding): Currently ranked 279 of 365 in D1. Trending down strongly 🔴.
- Opp Shooting (Opp Shooting): Currently ranked 360 of 365 in D1. Trending up weakly 🔴.
North Dakota St
Record: 21-6 | Elo: 1606.7 (ranked 64 of 365) | Efficiency Margin: +3.67 (ranked 122 of 365)
Offensive Trends:
- Off Reb Pct (Offensive Rebounding): Currently ranked 67 of 365 in D1. Trending down strongly 🔴.
- Shooting (Shooting): Currently ranked 93 of 365 in D1. Trending up moderately 🟢.
Defensive Trends:
- Opp Shooting (Opp Shooting): Currently ranked 252 of 365 in D1. Trending up strongly 🔴.
- Def Reb Pct (Defensive Rebounding): Currently ranked 57 of 365 in D1. Trending up strongly 🟢.
Omaha
Record: 11-14 | Elo: 1491.0 (ranked 194 of 365) | Efficiency Margin: -9.12 (ranked 248 of 365)
Offensive Trends:
- Shooting (Shooting): Currently ranked 87 of 365 in D1. Trending up strongly 🟢.
- Off Reb Pct (Offensive Rebounding): Currently ranked 332 of 365 in D1. Trending down strongly 🔴.
Defensive Trends:
- Opp Shooting (Opp Shooting): Currently ranked 253 of 365 in D1. Trending up moderately 🔴.
- Opp Turnovers (Opp Turnovers): Currently ranked 318 of 365 in D1. Trending down moderately 🔴.
Oral Roberts
Record: 6-21 | Elo: 1301.8 (ranked 360 of 365) | Efficiency Margin: -21.24 (ranked 332 of 365)
Offensive Trends:
- Shooting (Shooting): Currently ranked 315 of 365 in D1. Trending down moderately 🔴.
- Turnovers (Turnovers): Currently ranked 304 of 365 in D1. Trending down weakly 🟢.
Defensive Trends:
- Opp Turnovers (Opp Turnovers): Currently ranked 304 of 365 in D1. Trending down strongly 🔴.
- Def Reb Pct (Defensive Rebounding): Currently ranked 305 of 365 in D1. Trending up strongly 🟢.
South Dakota
Record: 13-13 | Elo: 1455.8 (ranked 242 of 365) | Efficiency Margin: -13.22 (ranked 280 of 365)
Offensive Trends:
- Off Reb Pct (Offensive Rebounding): Currently ranked 211 of 365 in D1. Trending down strongly 🔴.
- Shooting (Shooting): Currently ranked 227 of 365 in D1. Trending down weakly 🔴.
Defensive Trends:
- Def Reb Pct (Defensive Rebounding): Currently ranked 225 of 365 in D1. Trending up strongly 🟢.
- Opp Shooting (Opp Shooting): Currently ranked 335 of 365 in D1. Trending down moderately 🟢.
South Dakota St
Record: 12-15 | Elo: 1480.0 (ranked 212 of 365) | Efficiency Margin: -4.05 (ranked 199 of 365)
Offensive Trends:
- Turnovers (Turnovers): Currently ranked 161 of 365 in D1. Trending down strongly 🟢.
- Off Reb Pct (Offensive Rebounding): Currently ranked 210 of 365 in D1. Trending down strongly 🔴.
Defensive Trends:
- Def Reb Pct (Defensive Rebounding): Currently ranked 75 of 365 in D1. Trending down moderately 🔴.
- Opp Shooting (Opp Shooting): Currently ranked 172 of 365 in D1. Trending up weakly 🔴.
St. Thomas – Minnesota
Record: 21-7 | Elo: 1592.2 (ranked 77 of 365) | Efficiency Margin: +5.98 (ranked 108 of 365)
Offensive Trends:
- Shooting (Shooting): Currently ranked 4 of 365 in D1. Trending up strongly 🟢.
- Off Reb Pct (Offensive Rebounding): Currently ranked 363 of 365 in D1. Trending down strongly 🔴.
Defensive Trends:
- Opp Turnovers (Opp Turnovers): Currently ranked 112 of 365 in D1. Trending down strongly 🔴.
- Opp Shooting (Opp Shooting): Currently ranked 215 of 365 in D1. Trending down moderately 🟢.
UM Kansas City
Record: 3-22 | Elo: 1292.5 (ranked 364 of 365) | Efficiency Margin: -25.57 (ranked 351 of 365)
Offensive Trends:
- Off Reb Pct (Offensive Rebounding): Currently ranked 257 of 365 in D1. Trending down strongly 🔴.
- Shooting (Shooting): Currently ranked 339 of 365 in D1. Trending down moderately 🔴.
Defensive Trends:
- Opp Turnovers (Opp Turnovers): Currently ranked 209 of 365 in D1. Trending down strongly 🔴.
- Opp Shooting (Opp Shooting): Currently ranked 336 of 365 in D1. Trending up moderately 🔴.
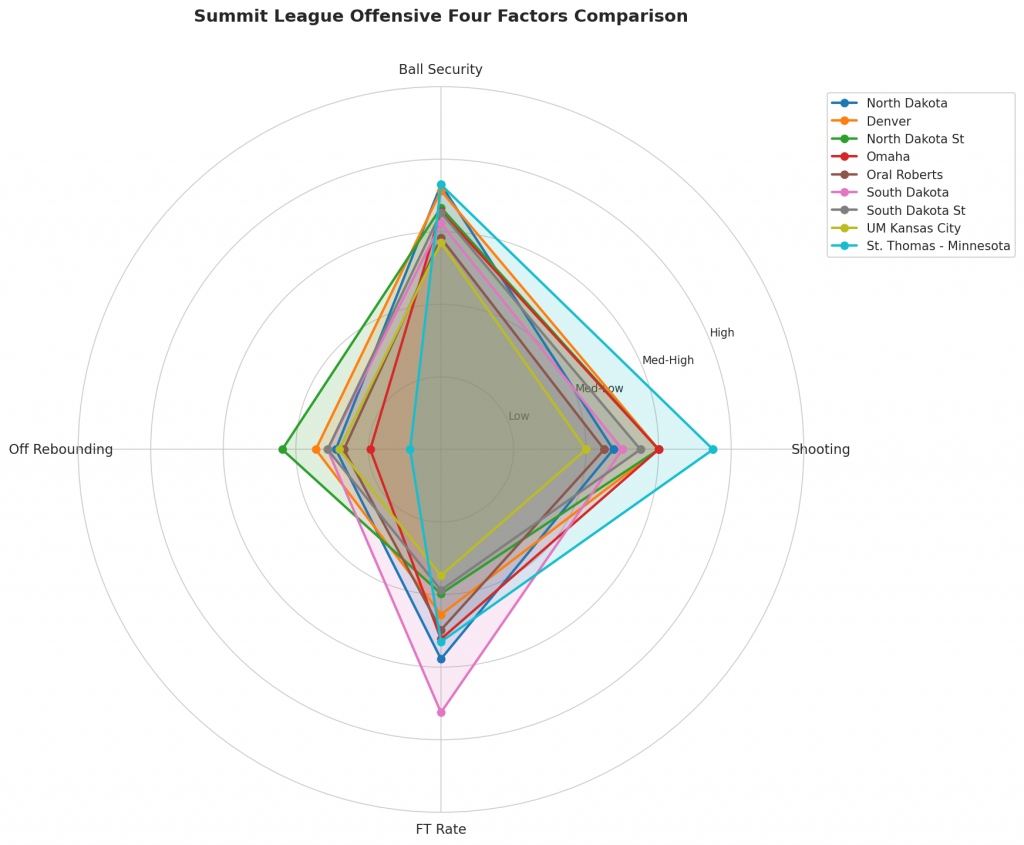
Figure 2: Offensive Four Factors comparison across Summit League teams. The radar chart shows each team’s shooting efficiency (eFG%), ball security (TOV%), offensive rebounding (OREB%), and free throw generation (FT Rate).
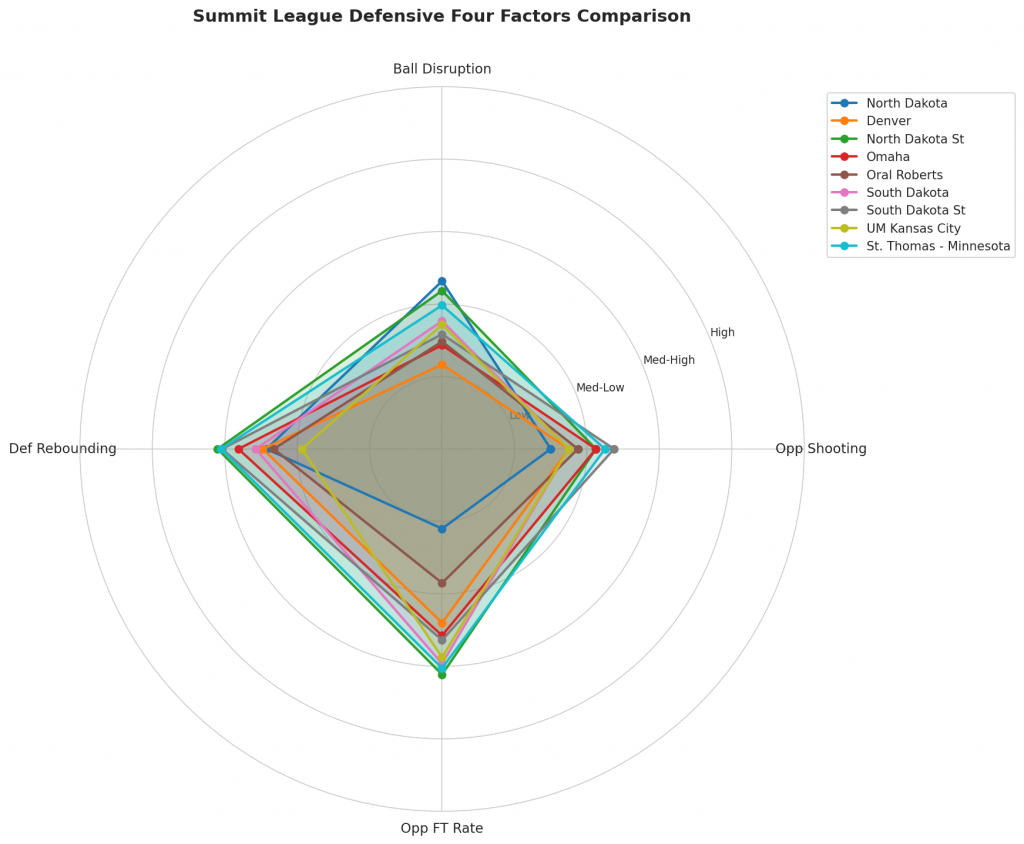
Figure 3: Defensive Four Factors comparison across Summit League teams. The radar chart shows each team’s opponent shooting defense (Opp eFG%), ball disruption (forcing TOV%), defensive rebounding (DREB%), and opponent free throw prevention (Opp FT Rate).
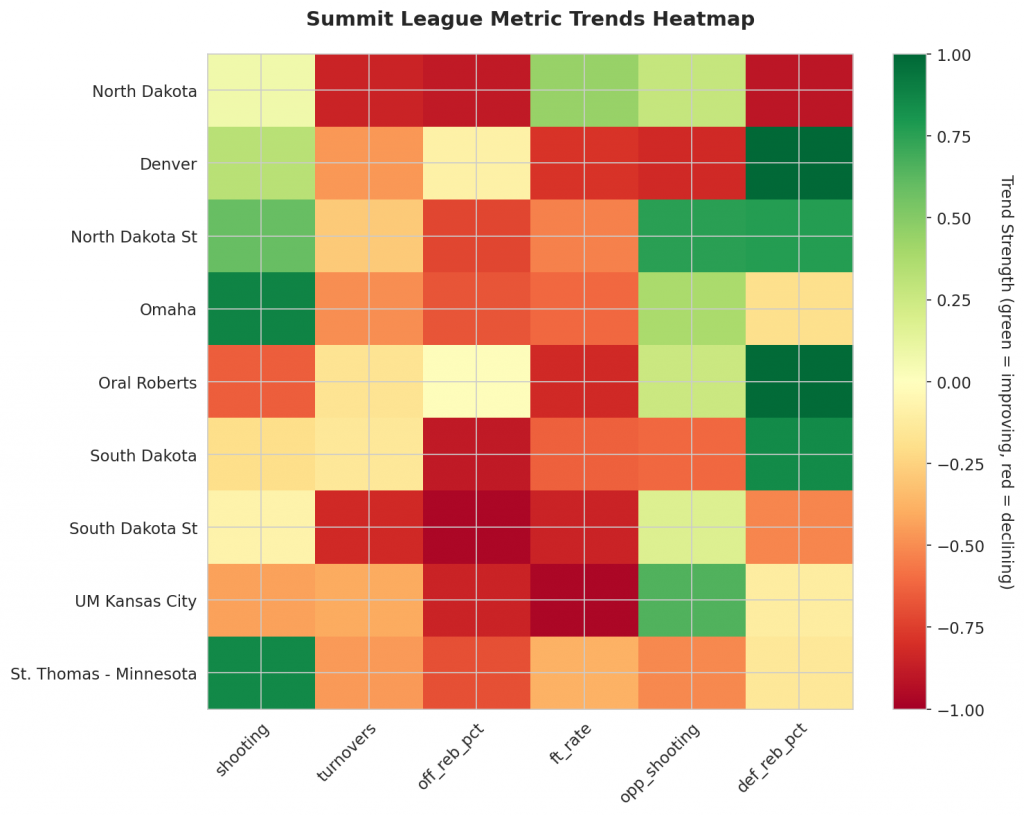
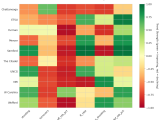
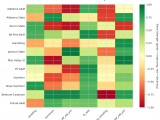
Figure 4: MACD trends heatmap showing which metrics are improving (green) or declining (red) for each team. Stronger colors indicate more pronounced trends.
Looking Ahead
Summit League Week 15 Review
As the Summit League season continues, we examine key trends in offense and defense to understand which teams are genuinely improving versus those riding unsustainable momentum.
Offensive Trends to Highlight
- North Dakota has made significant strides in reducing turnovers. With a downward trend, they have decreased their turnover rate versus stronger competition.
- However, the Fighting Hawks’ performance on the glass has worsened versus weaker competition. Their defensive rebound percentage has allowed more offensive boards, indicating difficulties in securing rebounds.
North Dakota State University
The Bison’s offense has struggled to secure rebounds versus weaker competition. Specifically, North Dakota St’s offensive rebound percentage has decreased versus weaker competition.
Omaha
In contrast, the Mavericks have shown improvement in shooting. Omaha’s shooting percentage has increased versus weaker competition.
Defensive Trends to Highlight
- North Dakota’s defense has been under scrutiny due to its decline in defensive rebound percentage versus weaker competition. This allows opponents more opportunities on the glass.
- Denver has struggled with allowing more opponent shots made, indicating a worsening trend in opponent shooting percentages versus stronger competition.
Metrics Glossary
Four Factors (Dean Oliver’s framework for basketball success):
- eFG% (Effective Field Goal %): Field goal percentage adjusted for 3-pointers being worth more (FGM + 0.5×3PM) / FGA. Higher is better offensively, lower is better defensively.
- TOV% (Turnover Rate): Turnovers per 100 possessions. Lower is better offensively (taking care of the ball), higher is better defensively (forcing turnovers).
- OREB% / DREB% (Offensive/Defensive Rebound Rate): Percentage of available rebounds grabbed. Offensive rebounds create second-chance points; defensive rebounds end opponent possessions.
- FTR (Free Throw Rate): Free throws made per field goal attempt (FTM/FGA). Measures ability to get to the line AND convert. Higher is better offensively, lower is better defensively.
Other Metrics:
- Elo Rating: Chess-style rating system that updates based on game results and opponent strength. Higher Elo indicates stronger team.
- Efficiency Margin: Point differential per 100 possessions (Offensive Efficiency – Defensive Efficiency). Accounts for pace of play.
- MACD (Moving Average Convergence Divergence): Trend indicator comparing 12-game and 26-game exponential moving averages. Positive MACD = improving trend, Negative MACD = declining trend.
Analysis powered by HoopSci’s advanced metrics and MACD trending indicators.