Week 15: 2026’s Biggest Bullies
February 16, 2026Bullies of the Court: Top 3 Teams Exposing Statistical Inconsistencies
The college basketball landscape often reveals teams that excel against weaker opponents, only to falter when faced with stiffer competition. Our latest rankings highlight which teams are experiencing uneven performances.
At the top of this week’s list are three teams struggling to maintain consistency across different levels of opposition.
1. Drake
The Bulldogs outperformed expectations by +28.6 points versus weaker competition, but underperformed by -325.4 points versus stronger competition.
Their disparity in performance is evident in their struggles against top-tier opponents.
They have a notable difference in performance metrics between the two types of competition.
2. Tenn Tech
Tenn Tech exceeded expectations by +50.7 points versus weaker competition, but underperformed by -73.1 points versus stronger competition.
The team’s tendency to struggle against top-tier opponents is underscored by their inconsistency across varying levels of competition.
They have a notable difference in performance metrics between the two types of competition.
3. Texas Southern
Texas Southern outperformed expectations by +43.9 points versus weaker competition, but underperformed by -126.8 points versus stronger competition.
The Tigers’ inconsistencies across varying levels of competition are highlighted by their struggles against top teams.
Their performance is marked by a significant difference in metrics between competing against weaker and stronger opponents.
These rankings provide a unique perspective on the college basketball landscape, highlighting teams that require closer examination to assess their true strengths and weaknesses.
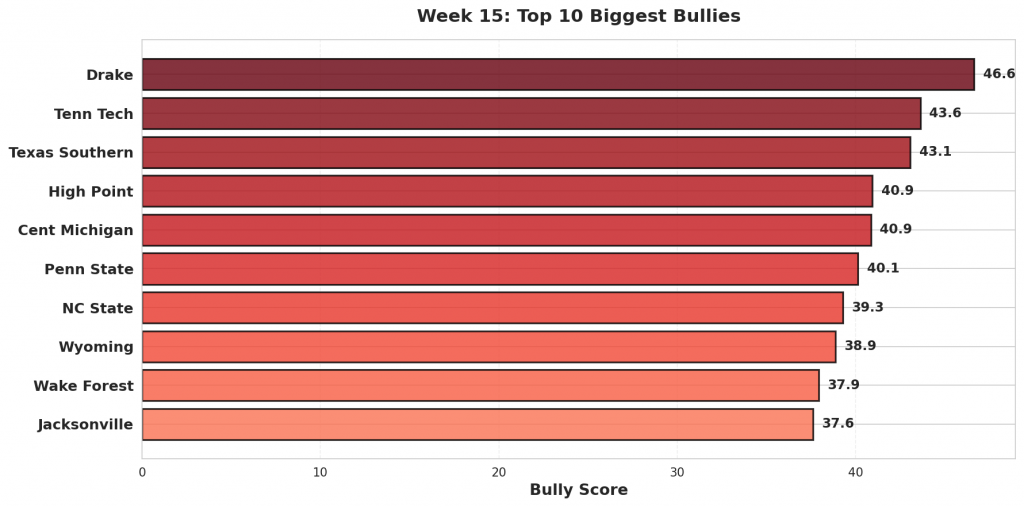
Figure 1: Top 10 teams with the highest bully scores in Week 15. Bully scores reflect the combination of overperformance against weak opponents and underperformance against quality competition.
#1: Drake (12-16)
#191 Drake was projected to beat #363 Western Illinois by 22. They cruised to a 108-57 victory, 29 points better than projected. Against #111 Bradley, Drake lost 93-66. They were projected to win by 5.
Bully Metrics: Exceeded projections by 28.6 total points against weak opponents (1 games); underperformed by 325.4 points against quality competition (18 games).
#2: Tenn Tech (11-16)
Against #319 West Georgia, #322 Tenn Tech pulled away for a 87-59 win. The model had them winning by 2; the actual margin was 28, outpacing the projection by 26. Facing #31 Kentucky, Tenn Tech came up short, losing 104-54 after being projected to lose by 25.
Bully Metrics: Exceeded projections by 50.7 total points against weak opponents (2 games); underperformed by 73.1 points against quality competition (4 games).
#3: Texas Southern (8-15)
#342 Texas Southern faced #326 Alabama State as 0-point favorites and won handily 96-64, 32 points above the spread. Texas Southern fell to #7 Gonzaga 98-43, missing the 27-point projection by 28.
Bully Metrics: Exceeded projections by 43.9 total points against weak opponents (2 games); underperformed by 126.8 points against quality competition (6 games).
#4: High Point (24-4)
Expected to win by 2 over #337 Bryant, #74 High Point coasted to a 93-47 win—beating the line by 44. The model had High Point winning by 9 against #173 Winthrop. Instead, they lost 92-75.
Bully Metrics: Exceeded projections by 135.8 total points against weak opponents (5 games); underperformed by 68.9 points against quality competition (5 games).
#5: Cent Michigan (8-17)
#235 Cent Michigan cruised to a 100-65 victory against #186 Eastern Michigan. Favored by 3, the 35-point margin was +32 versus projection. Against #19 Saint Louis, Cent Michigan lost 107-65. They were projected to lose by 6.
Bully Metrics: Exceeded projections by 62.9 total points against weak opponents (2 games); underperformed by 112.6 points against quality competition (12 games).
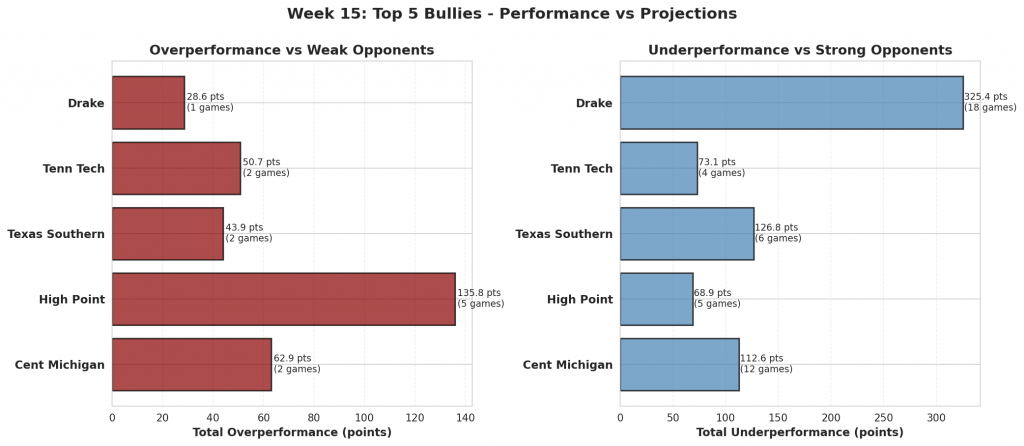
Figure 2: Performance comparison for the top 5 biggest bullies. Red bars show total overperformance against weak opponents; blue bars show total underperformance against strong opponents.
#6: Penn State (11-15)
The model gave #143 Penn State a 6-point edge over #323 New Haven. They rolled to a 44-point win, 87-43, finishing 38 beyond the expected margin. Facing #34 Indiana, Penn State came up short, losing 113-72 after being projected to lose by 1.
Bully Metrics: Exceeded projections by 58.9 total points against weak opponents (2 games); underperformed by 203.3 points against quality competition (19 games).
#7: NC State (18-8)
#23 NC State handled #308 UNC Greensboro, winning 110-64. That 46-point margin was a 45-point swing from the projection. NC State fell to #9 Louisville 118-77, missing the 9-point projection by 32.
Bully Metrics: Exceeded projections by 107.7 total points against weak opponents (3 games); underperformed by 74.2 points against quality competition (22 games).
#8: Wyoming (13-12)
Facing #233 Denver, #118 Wyoming coasted to a 101-59 win. With a projected spread of 4, the result was 38 points past expectations. The model had Wyoming losing by 15 against #24 Utah State. Instead, they lost 94-62.
Bully Metrics: Exceeded projections by 71.9 total points against weak opponents (2 games); underperformed by 43.7 points against quality competition (15 games).
#9: Wake Forest (13-12)
#59 Wake Forest was projected to beat #222 Campbell by 10. They cruised to a 99-51 victory, 38 points better than projected. Against #15 Vanderbilt, Wake Forest lost 98-67. They were projected to win by 2.
Bully Metrics: Exceeded projections by 91.5 total points against weak opponents (3 games); underperformed by 133.6 points against quality competition (18 games).
#10: Jacksonville (10-17)
Against #319 West Georgia, #325 Jacksonville rolled to a 32-point win, 75-43. The model had them winning by 10; the actual margin was 32, outpacing the projection by 22. Facing #42 Texas A&M, Jacksonville came up short, losing 112-75 after being projected to lose by 13.
Bully Metrics: Exceeded projections by 22.5 total points against weak opponents (1 games); underperformed by 106.0 points against quality competition (7 games).
#11: Marquette (9-17)
#88 Marquette faced #306 Little Rock as 16-point favorites and won handily 89-49, 24 points above the spread. Marquette fell to #34 Indiana 100-77, missing the 6-point projection by 29.
Bully Metrics: Exceeded projections by 24.0 total points against weak opponents (1 games); underperformed by 298.1 points against quality competition (22 games).
#12: Jackson State (8-17)
Expected to win by 6 over #350 Florida A&M, #360 Jackson State took care of business, winning 80-60—beating the line by 14. The model had Jackson State losing by 9 against #49 TCU. Instead, they lost 115-64.
Bully Metrics: Exceeded projections by 13.7 total points against weak opponents (1 games); underperformed by 211.3 points against quality competition (9 games).
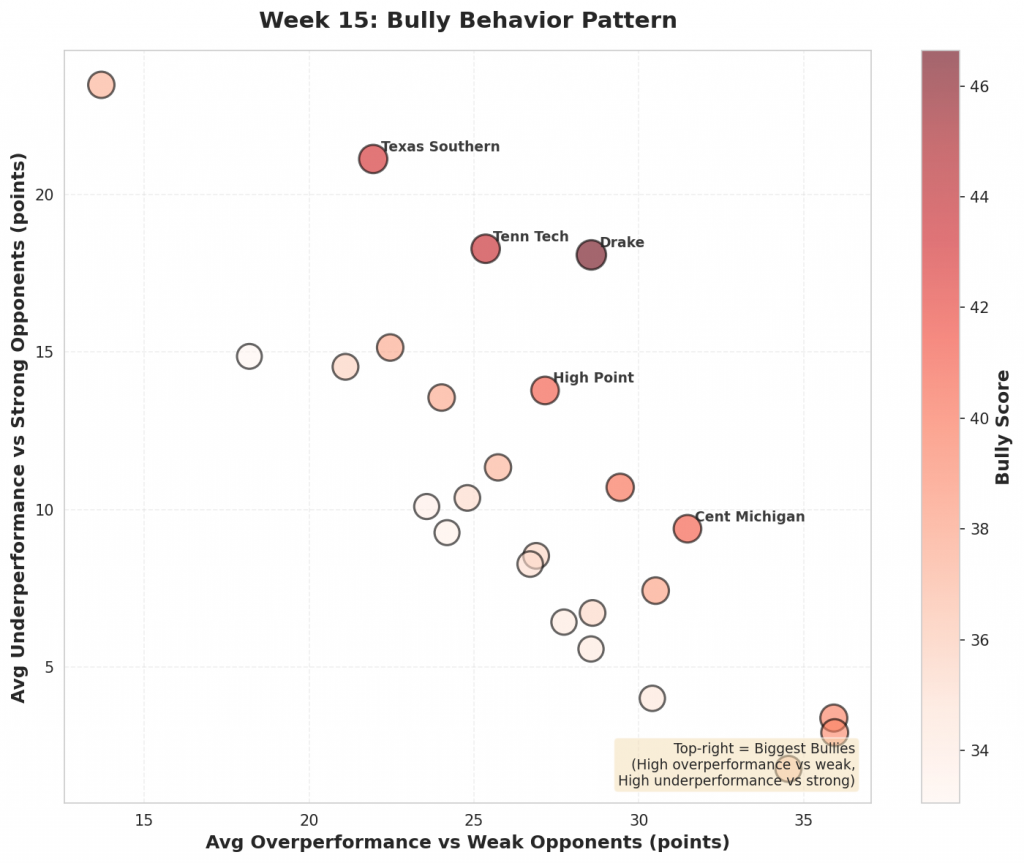
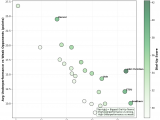
Figure 3: Scatter plot showing the relationship between overperformance against weak opponents (x-axis) and underperformance against strong opponents (y-axis). Bubble size and color indicate bully score magnitude. Top-right quadrant represents the biggest bullies.
#13: Pitt (9-17)
#105 Pitt cruised to a 103-63 victory against #346 Binghamton. Favored by 14, the 40-point margin was +26 versus projection. Against #9 Louisville, Pitt lost 100-59. They were projected to lose by 4.
Bully Metrics: Exceeded projections by 51.5 total points against weak opponents (2 games); underperformed by 249.3 points against quality competition (22 games).
#14: TCU (16-9)
The model gave #49 TCU a 9-point edge over #360 Jackson State. They rolled to a 51-point win, 115-64, finishing 42 beyond the expected margin. Facing #91 Colorado, TCU came up short, losing 87-61 after being projected to lose by 0.
Bully Metrics: Exceeded projections by 103.6 total points against weak opponents (3 games); underperformed by 30.0 points against quality competition (17 games).
#15: Queens University (15-12)
#210 Queens University handled #364 Gardner-Webb, winning 107-74. That 33-point margin was a 28-point swing from the projection. Queens University fell to #59 Wake Forest 111-73, missing the 9-point projection by 29.
Bully Metrics: Exceeded projections by 105.5 total points against weak opponents (5 games); underperformed by 116.2 points against quality competition (8 games).
#16: Northwestern (10-16)
Facing #279 Cleveland State, #81 Northwestern coasted to a 110-63 win. With a projected spread of 4, the result was 43 points past expectations. The model had Northwestern losing by 6 against #10 Illinois. Instead, they lost 84-44.
Bully Metrics: Exceeded projections by 80.7 total points against weak opponents (3 games); underperformed by 179.0 points against quality competition (21 games).
#17: Baylor (13-12)
#63 Baylor was projected to beat #359 Alcorn State by 20. They cruised to a 113-56 victory, 37 points better than projected. Against #16 Kansas, Baylor lost 80-62. They were projected to lose by 1.
Bully Metrics: Exceeded projections by 85.8 total points against weak opponents (3 games); underperformed by 127.5 points against quality competition (19 games).
#18: American (14-13)
Against #254 Longwood, #234 American pulled away for a 92-66 win. The model had them winning by 1; the actual margin was 26, outpacing the projection by 25. Facing #12 Virginia, American came up short, losing 95-51 after being projected to lose by 4.
Bully Metrics: Exceeded projections by 24.8 total points against weak opponents (1 games); underperformed by 114.0 points against quality competition (11 games).
#19: Presbyterian (13-14)
#270 Presbyterian faced #364 Gardner-Webb as 1-point favorites and won handily 92-55, 36 points above the spread. Presbyterian fell to #41 UCLA 86-46, missing the 19-point projection by 21.
Bully Metrics: Exceeded projections by 53.4 total points against weak opponents (2 games); underperformed by 57.8 points against quality competition (7 games).
#20: St John’s (20-5)
Expected to win by 18 over #314 Bucknell, #17 St John’s coasted to a 97-49 win—beating the line by 30. The model had St John’s winning by 14 against #54 Providence. Instead, they lost 77-71.
Bully Metrics: Exceeded projections by 30.4 total points against weak opponents (1 games); underperformed by 92.0 points against quality competition (23 games).
#21: Tulane (15-10)
#190 Tulane cruised to a 85-52 victory against #347 UTSA. Favored by 5, the 33-point margin was +28 versus projection. Against #62 South Florida, Tulane lost 97-83. They were projected to win by 3.
Bully Metrics: Exceeded projections by 27.7 total points against weak opponents (1 games); underperformed by 89.9 points against quality competition (14 games).
#22: Columbia (15-9)
The model gave #177 Columbia a 0-point edge over #224 Fairfield. They pulled away for a 106-77 win, finishing 29 beyond the expected margin. Facing #141 Harvard, Columbia came up short, losing 79-54 after being projected to lose by 3.
Bully Metrics: Exceeded projections by 28.5 total points against weak opponents (1 games); underperformed by 50.1 points against quality competition (9 games).
#23: South Dakota St (12-15)
#199 South Dakota St handled #282 Georgia State, winning 105-58. That 47-point margin was a 38-point swing from the projection. South Dakota St fell to #118 Wyoming 87-72, missing the 8-point projection by 23.
Bully Metrics: Exceeded projections by 70.7 total points against weak opponents (3 games); underperformed by 100.9 points against quality competition (10 games).
#24: Kansas State (10-15)
Facing #365 Mississippi Valley State, #116 Kansas State coasted to a 108-49 win. With a projected spread of 32, the result was 27 points past expectations. The model had Kansas State losing by 3 against #64 Cincinnati. Instead, they lost 91-62.
Bully Metrics: Exceeded projections by 72.6 total points against weak opponents (3 games); underperformed by 185.3 points against quality competition (20 games).
#25: Wofford (17-10)
#223 Wofford was projected to beat #364 Gardner-Webb by 8. They won comfortably 83-57, 18 points better than projected. Against #172 Elon, Wofford lost 73-52. They were projected to win by 3.
Bully Metrics: Exceeded projections by 18.2 total points against weak opponents (1 games); underperformed by 104.0 points against quality competition (7 games).
The “Bully” Conundrum: What College Basketball Fans Need to Know
College basketball teams like Drake, Tennessee Tech, and Texas Southern present a unique challenge for bettors and analysts. These “bully” teams excel in situations where their margin of victory is large versus weaker competition.
What the Data Says
Research suggests that bully teams’ efficiency metrics are artificially inflated by their dominance over weaker foes . However, when faced with stronger competition, these teams frequently struggle. This paradoxical nature can make it difficult for fans and analysts to determine their true value.
Actionable Advice
To make informed decisions about bully teams, consider the following:
- Against Weak Teams: Bully teams are often safe bets to cover large spreads against inferior opponents . They tend to play hard for 40 minutes regardless of the score, making them a reliable choice in these situations.
- Versus Stronger Competition: Be cautious when backing bully teams as favorites versus stronger competition. Their inflated efficiency metrics can make them appear more formidable than they actually are. In these matchups, it’s essential to reassess their true value and consider fading them.
Key Takeaways
Bully teams offer a unique dynamic: they dominate weak opponents while struggling versus strong ones. By understanding this trend, fans and analysts can better navigate the complexities of college basketball and make more informed decisions about which teams to back.
For example, if a bully team consistently covers large spreads against inferior opponents but struggles versus top-ranked teams, it may be wise to fade them in high-profile matchups. Conversely, their strength against weaker foes makes them a reliable choice for those seeking safe bets.
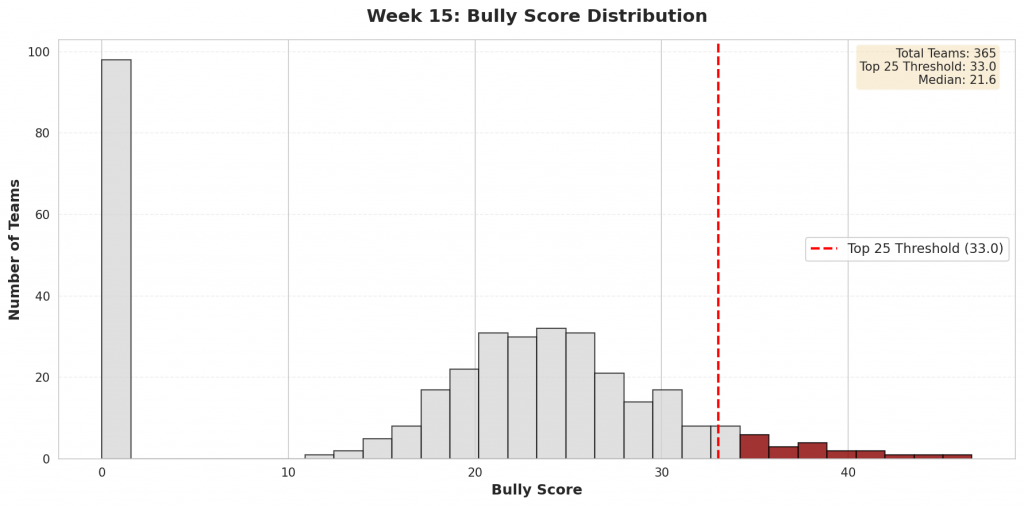
Figure 4: Distribution of bully scores across all Division I teams. The top 25 bullies (highlighted in red) represent teams whose efficiency metrics are most inflated by their performance patterns.
Check back next week for updated bully rankings.