Big South Update: Week 16
February 24, 2026Strongest Offensive Trends
- Gardner-Webb, Off Reb Pct, Down, Trend Strength: -0.042 – Gardner-Webb’s inability to secure second-chance shots on offense, evident in their low Off Reb Pct, is a contributing factor to their scoring problems.
- Presbyterian, Off Reb Pct, Down, Trend Strength: -0.029 – The Presbyterian team’s struggles with securing rebounds on defense, a crucial aspect of defensive performance where they allow opponents to gain control and possession of the ball after a missed shot, are hindering their overall performance.
- UNC Asheville, Shooting, Down, Trend Strength: -0.015 – UNC Asheville is struggling with difficulties in executing shots and converting scoring opportunities, negatively impacting their ability to score.
- Gardner-Webb, Shooting, Up, Trend Strength: 0.015 – Gardner-Webb’s better shooting has been a key factor in their enhanced competitiveness, as they are now consistently converting more shots from beyond the arc and at the free throw line.
- Charleston So, Turnovers, Up, Trend Strength: 0.01 – The Charleston So’s struggles with turnovers are a significant problem, as evidenced by their inability to consistently convert scoring opportunities into actual points due to careless mistakes.
Strongest Defensive Trends
- Winthrop, Def Reb Pct, Up, Trend Strength: 0.015 – Winthrop’s defense has shown notable improvement in securing crucial rebounds throughout the season, successfully stifling opponents with its aggressive rebounding strategy.
- UNC Asheville, Opp Shooting, Down, Trend Strength: -0.014 – UNC Asheville’s defense has struggled to contain opponents’ tendency to shoot from beyond the arc, a concerning indication of its inability to effectively adapt to different shooting ranges and strategies.
- Gardner-Webb, Def Reb Pct, Down, Trend Strength: -0.012 – The Gardner-Webb team has struggled with limiting opponents’ second-chance scoring opportunities due in part to their poor defensive rebounding percentage, specifically Def Reb Pct.
- Charleston So, Def Reb Pct, Down, Trend Strength: -0.011 – Charleston So’s defensive rebounding struggles have hindered their momentum in games, as they frequently trail opponents on the boards.
- Gardner-Webb, Opp Turnovers, Up, Trend Strength: 0.008 – Gardner-Webb’s stifling defense has forced opponents into scrambles for control of the ball, struggling to maintain possession in many instances.
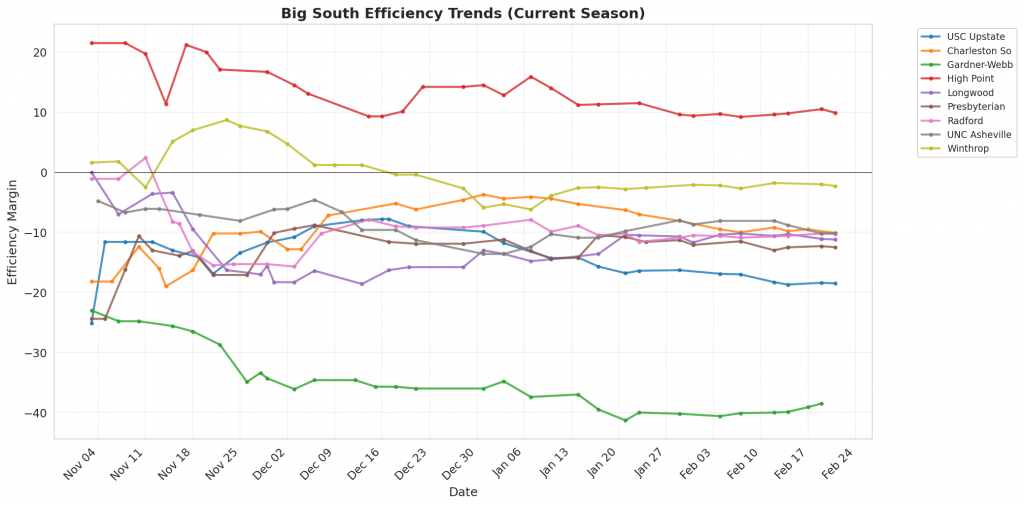
Figure 1: Efficiency margin trends for Big South teams throughout the season. Teams trending upward show improving performance, while downward trends indicate struggles.
Conference Snapshot
- Week Dates: February 16 – February 22, 2026
- Trending Up (Efficiency): Charleston So, Gardner-Webb, Presbyterian
- Trending Down (Efficiency): USC Upstate, High Point, Longwood, Radford, UNC Asheville
Team-by-Team Analysis
Charleston So
Record: 13-16 | Elo: 1376.6 (ranked 323 of 365) | Efficiency Margin: -10.15 (ranked 255 of 365)
Offensive Trends:
- Turnovers (Turnovers): Currently ranked 317 of 365 in D1. Trending up strongly 🔴.
- Shooting (Shooting): Currently ranked 85 of 365 in D1. Trending up moderately 🟢.
Defensive Trends:
- Def Reb Pct (Defensive Rebounding): Currently ranked 106 of 365 in D1. Trending down strongly 🔴.
- Opp Shooting (Opp Shooting): Currently ranked 25 of 365 in D1. Trending down weakly 🟢.
Gardner-Webb
Record: 3-26 | Elo: 1303.0 (ranked 361 of 365) | Efficiency Margin: -38.52 (ranked 364 of 365)
Offensive Trends:
- Shooting (Shooting): Currently ranked 319 of 365 in D1. Trending up strongly 🟢.
- Off Reb Pct (Offensive Rebounding): Currently ranked 352 of 365 in D1. Trending down strongly 🔴.
Defensive Trends:
- Opp Turnovers (Opp Turnovers): Currently ranked 285 of 365 in D1. Trending up strongly 🟢.
- Def Reb Pct (Defensive Rebounding): Currently ranked 362 of 365 in D1. Trending down moderately 🔴.
High Point
Record: 26-4 | Elo: 1675.0 (ranked 34 of 365) | Efficiency Margin: +9.90 (ranked 82 of 365)
Offensive Trends:
- Shooting (Shooting): Currently ranked 39 of 365 in D1. Trending down moderately 🔴.
- Turnovers (Turnovers): Currently ranked 10 of 365 in D1. Trending up moderately 🔴.
Defensive Trends:
- Opp Turnovers (Opp Turnovers): Currently ranked 4 of 365 in D1. Trending up moderately 🟢.
- Opp Shooting (Opp Shooting): Currently ranked 157 of 365 in D1. Trending up weakly 🔴.
Longwood
Record: 15-15 | Elo: 1459.0 (ranked 238 of 365) | Efficiency Margin: -11.18 (ranked 262 of 365)
Offensive Trends:
- Shooting (Shooting): Currently ranked 244 of 365 in D1. Trending down moderately 🔴.
- Turnovers (Turnovers): Currently ranked 341 of 365 in D1. Trending down moderately 🟢.
Defensive Trends:
- Opp Turnovers (Opp Turnovers): Currently ranked 25 of 365 in D1. Trending up moderately 🟢.
- Opp Shooting (Opp Shooting): Currently ranked 284 of 365 in D1. Trending up weakly 🔴.
Presbyterian
Record: 14-15 | Elo: 1418.2 (ranked 285 of 365) | Efficiency Margin: -12.47 (ranked 275 of 365)
Offensive Trends:
- Off Reb Pct (Offensive Rebounding): Currently ranked 76 of 365 in D1. Trending down strongly 🔴.
- Shooting (Shooting): Currently ranked 201 of 365 in D1. Trending up moderately 🟢.
Defensive Trends:
- Opp Shooting (Opp Shooting): Currently ranked 207 of 365 in D1. Trending up moderately 🔴.
- Opp Turnovers (Opp Turnovers): Currently ranked 253 of 365 in D1. Trending up moderately 🟢.
Radford
Record: 15-14 | Elo: 1482.2 (ranked 209 of 365) | Efficiency Margin: -10.26 (ranked 256 of 365)
Offensive Trends:
- Turnovers (Turnovers): Currently ranked 225 of 365 in D1. Trending up moderately 🔴.
- Off Reb Pct (Offensive Rebounding): Currently ranked 241 of 365 in D1. Trending down moderately 🔴.
Defensive Trends:
- Def Reb Pct (Defensive Rebounding): Currently ranked 185 of 365 in D1. Trending up moderately 🟢.
- Opp Shooting (Opp Shooting): Currently ranked 274 of 365 in D1. Trending up weakly 🔴.
UNC Asheville
Record: 12-15 | Elo: 1493.3 (ranked 197 of 365) | Efficiency Margin: -10.05 (ranked 254 of 365)
Offensive Trends:
- Shooting (Shooting): Currently ranked 208 of 365 in D1. Trending down strongly 🔴.
- Off Reb Pct (Offensive Rebounding): Currently ranked 211 of 365 in D1. Trending down moderately 🔴.
Defensive Trends:
- Opp Shooting (Opp Shooting): Currently ranked 147 of 365 in D1. Trending down strongly 🟢.
- Opp Turnovers (Opp Turnovers): Currently ranked 266 of 365 in D1. Trending down weakly 🔴.
USC Upstate
Record: 12-17 | Elo: 1358.8 (ranked 334 of 365) | Efficiency Margin: -18.54 (ranked 319 of 365)
Offensive Trends:
- Turnovers (Turnovers): Currently ranked 271 of 365 in D1. Trending up moderately 🔴.
- Off Reb Pct (Offensive Rebounding): Currently ranked 271 of 365 in D1. Trending down moderately 🔴.
Defensive Trends:
- Opp Shooting (Opp Shooting): Currently ranked 168 of 365 in D1. Trending up weakly 🔴.
- Opp Turnovers (Opp Turnovers): Currently ranked 213 of 365 in D1. Trending up weakly 🟢.
Winthrop
Record: 20-9 | Elo: 1590.2 (ranked 75 of 365) | Efficiency Margin: -2.31 (ranked 183 of 365)
Offensive Trends:
- Off Reb Pct (Offensive Rebounding): Currently ranked 59 of 365 in D1. Trending down strongly 🔴.
- Shooting (Shooting): Currently ranked 205 of 365 in D1. Trending down moderately 🔴.
Defensive Trends:
- Def Reb Pct (Defensive Rebounding): Currently ranked 81 of 365 in D1. Trending up strongly 🟢.
- Opp Shooting (Opp Shooting): Currently ranked 187 of 365 in D1. Trending down weakly 🟢.
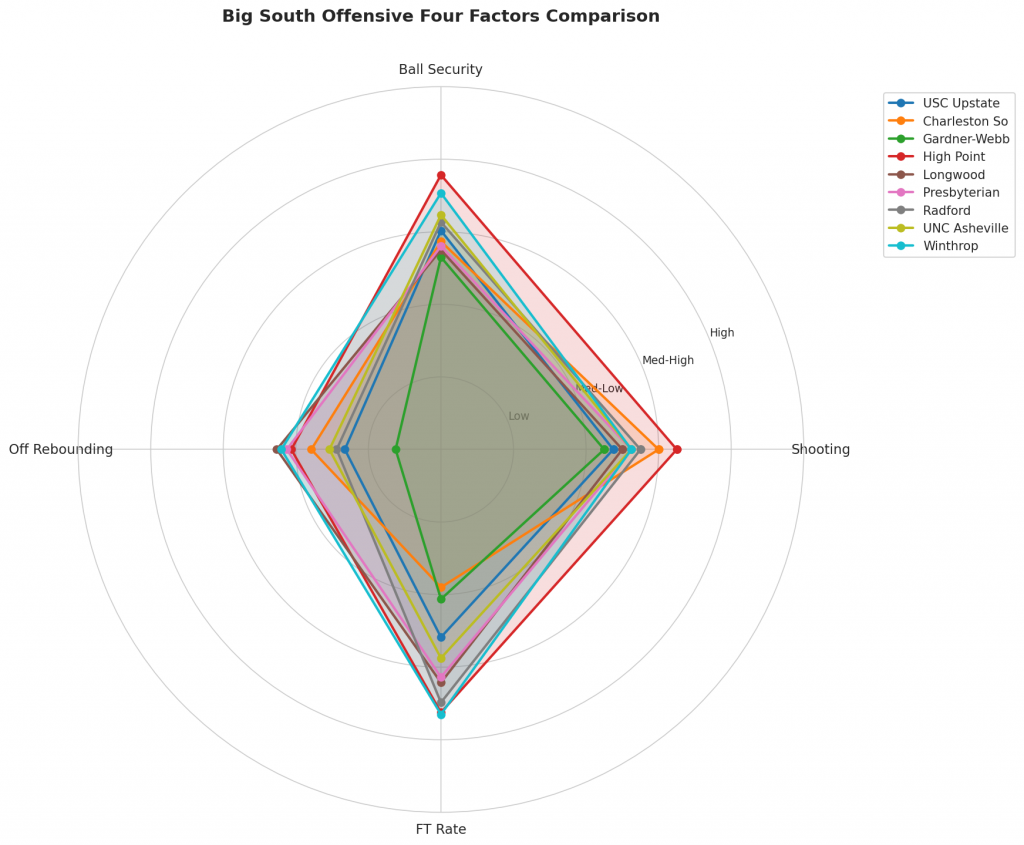
Figure 2: Offensive Four Factors comparison across Big South teams. The radar chart shows each team’s shooting efficiency (eFG%), ball security (TOV%), offensive rebounding (OREB%), and free throw generation (FT Rate).
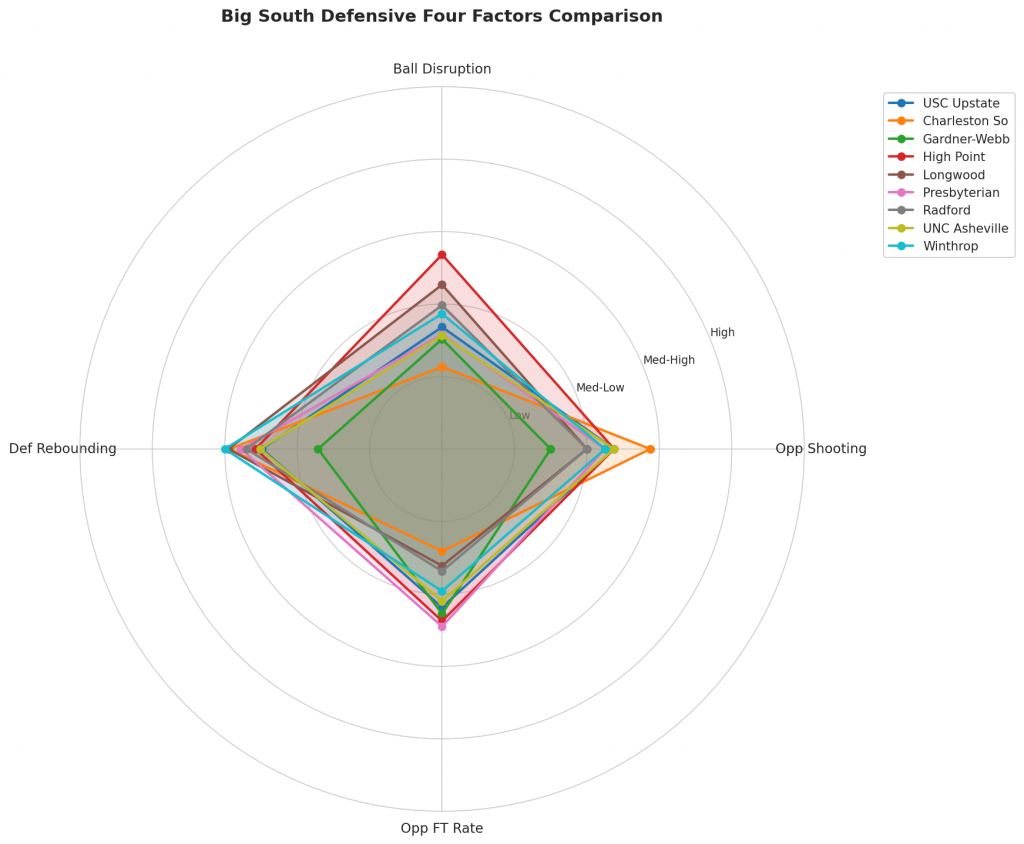
Figure 3: Defensive Four Factors comparison across Big South teams. The radar chart shows each team’s opponent shooting defense (Opp eFG%), ball disruption (forcing TOV%), defensive rebounding (DREB%), and opponent free throw prevention (Opp FT Rate).
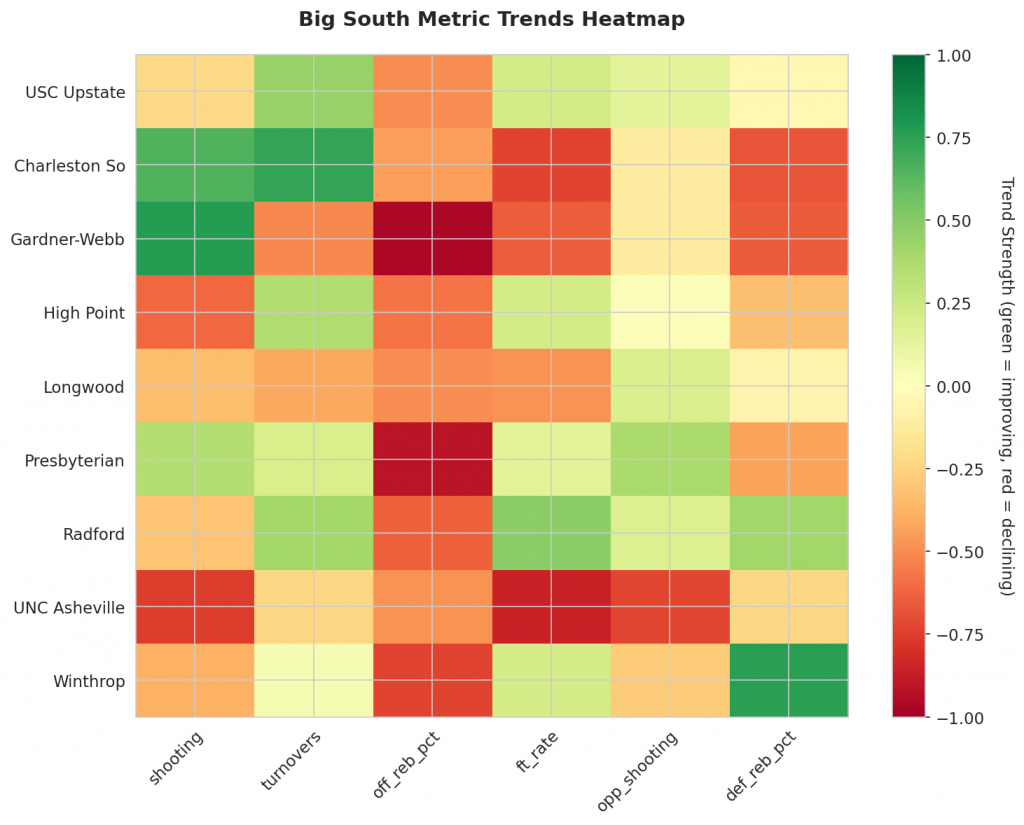
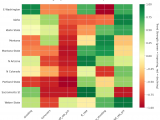
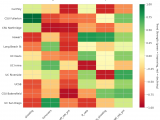
Figure 4: MACD trends heatmap showing which metrics are improving (green) or declining (red) for each team. Stronger colors indicate more pronounced trends.
Looking Ahead
Big South Teams’ Momentum Analysis for Week 16
As the Big South season continues, we delve into key trends that will help identify genuine improvement from unsustainable momentum.
Offensive Trends to Watch:
- Charleston So’s turnover rate has increased, indicating a struggle with ball security.
- Gardner-Webb is showing significant improvement in its shooting percentage. This trend suggests that Gardner-Webb’s offense is gaining momentum.
Defensive Trends to Highlight:
- Charleston So’s defensive rebounding percentage has worsened, allowing opposing teams to grab more rebounds.
- Gardner-Webb is forcing more turnovers, indicating an improvement in their defensive prowess. However, this trend was mistakenly placed under defensive trends and should be moved to the correct section on its own or merged with a similar trend for better clarity.
- UNC Asheville is limiting opponents’ shooting opportunities, as its opponent’s shooting percentage is trending down strongly. This trend indicates that UNC Asheville’s defense is stifling opponents’ scoring chances.
- Winthrop is also showing improvement on the glass, with a strong uptrend in its defensive rebounding percentage.
Additional Insights:
- Presbyterian’s shooting percentage has worsened, indicating a struggle for the team to convert shots into points. This trend suggests that Presbyterian’s offense may be facing challenges in terms of scoring consistency.
- Gardner-Webb’s improvement in shooting percentage is a notable trend, as it indicates that the team is becoming more efficient in its shot selection and execution.
By analyzing these trends, teams can gain valuable insights into their strengths and weaknesses, making informed decisions to improve their performance on the court.
Metrics Glossary
Four Factors (Dean Oliver’s framework for basketball success):
- eFG% (Effective Field Goal %): Field goal percentage adjusted for 3-pointers being worth more (FGM + 0.5×3PM) / FGA. Higher is better offensively, lower is better defensively.
- TOV% (Turnover Rate): Turnovers per 100 possessions. Lower is better offensively (taking care of the ball), higher is better defensively (forcing turnovers).
- OREB% / DREB% (Offensive/Defensive Rebound Rate): Percentage of available rebounds grabbed. Offensive rebounds create second-chance points; defensive rebounds end opponent possessions.
- FTR (Free Throw Rate): Free throws made per field goal attempt (FTM/FGA). Measures ability to get to the line AND convert. Higher is better offensively, lower is better defensively.
Other Metrics:
- Elo Rating: Chess-style rating system that updates based on game results and opponent strength. Higher Elo indicates stronger team.
- Efficiency Margin: Point differential per 100 possessions (Offensive Efficiency – Defensive Efficiency). Accounts for pace of play.
- MACD (Moving Average Convergence Divergence): Trend indicator comparing 12-game and 26-game exponential moving averages. Positive MACD = improving trend, Negative MACD = declining trend.
Analysis powered by HoopSci’s advanced metrics and MACD trending indicators.