Southern Update: Week 16
February 24, 2026Strongest Offensive Trends
- Furman, Off Reb Pct, Down, Trend Strength: -0.037 – Furman’s offense is struggling with its rebounding, as evidenced by a negative trend in off-rebound percentage, which may be contributing to their performance issues this season.
- Mercer, Off Reb Pct, Down, Trend Strength: -0.03 – Mercer’s poor defensive rebounding has become a significant issue, contributing to turnovers and hindering their ability to possess the ball, ultimately affecting their overall success on the court as a NEGATIVE trend.
- Chattanooga, Shooting, Up, Trend Strength: 0.021 – Chattanooga’s struggles with shooting persist throughout their recent games, contributing to their stagnant offense and resulting in a trend of poor performance on the field.
- Mercer, Shooting, Up, Trend Strength: 0.017 – Consistent shooting from beyond the arc is at the heart of Mercer’s offense, with their improved mark continuing to yield dividends in terms of overall effectiveness.
- ETSU, Off Reb Pct, Down, Trend Strength: -0.017 – ETSU is struggling with rebounding on their own defensive end, which is a major problem for the team’s overall performance.
Strongest Defensive Trends
- Samford, Def Reb Pct, Up, Trend Strength: 0.024 – Samford’s dominance on defensive rebounds poses a struggle for opposing teams, as its ability to secure rebounds has become a significant challenge to overcome.
- The Citadel, Opp Shooting, Up, Trend Strength: 0.018 – The Citadel’s defense has struggled to contain opponents’ shooting, particularly over the past five games, as they have seen a significant decline in Opp Shooting against them.
- Mercer, Opp Turnovers, Down, Trend Strength: -0.011 – Mercer’s stifling defense poses a challenge to its ability to generate defensive turnovers, highlighting an area of concern for the team.
- Chattanooga, Opp Turnovers, Down, Trend Strength: -0.01 – Chattanooga struggles with opponents gaining control of the ball after turnovers, a significant problem that has worsened over time and may impact their defensive strategy.
- Furman, Opp Turnovers, Down, Trend Strength: -0.007 – Furman’s defense has struggled to generate turnovers against its opponents, including an average of 14.5 opponent possessions per game without a turnover, indicating a difficulty in exerting pressure on opposing offenses by limiting scoring opportunities and maintaining possession.
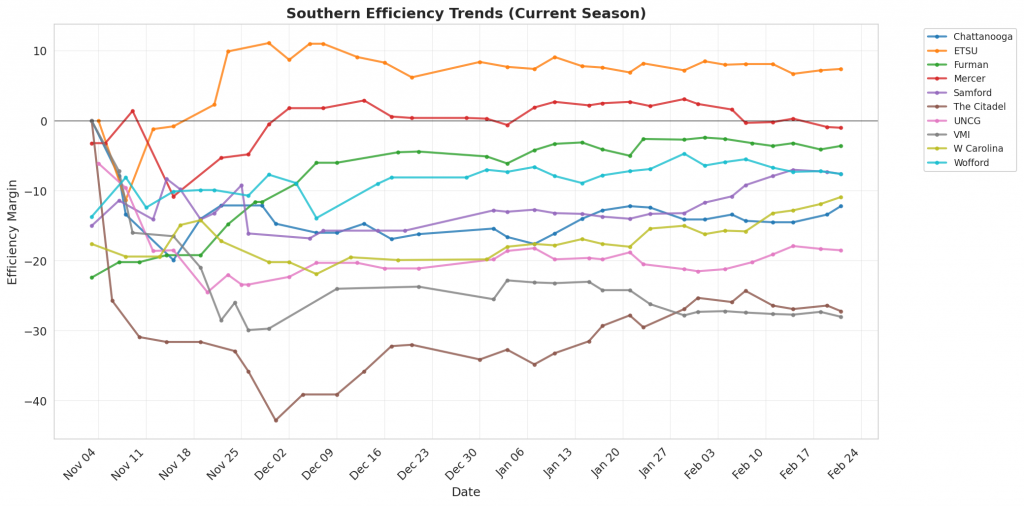
Figure 1: Efficiency margin trends for Southern teams throughout the season. Teams trending upward show improving performance, while downward trends indicate struggles.
Conference Snapshot
- Week Dates: February 16 – February 22, 2026
- Trending Up (Efficiency): Chattanooga, ETSU, Mercer, Samford, UNCG
- Trending Down (Efficiency): Furman, The Citadel
Team-by-Team Analysis
Chattanooga
Record: 12-17 | Elo: 1520.8 (ranked 151 of 365) | Efficiency Margin: -12.21 (ranked 268 of 365)
Offensive Trends:
- Shooting (Shooting): Currently ranked 80 of 365 in D1. Trending up strongly 🟢.
- Turnovers (Turnovers): Currently ranked 75 of 365 in D1. Trending up moderately 🔴.
Defensive Trends:
- Opp Turnovers (Opp Turnovers): Currently ranked 342 of 365 in D1. Trending down strongly 🔴.
- Opp Shooting (Opp Shooting): Currently ranked 182 of 365 in D1. Trending down moderately 🟢.
ETSU
Record: 21-8 | Elo: 1588.7 (ranked 76 of 365) | Efficiency Margin: +7.43 (ranked 97 of 365)
Offensive Trends:
- Off Reb Pct (Offensive Rebounding): Currently ranked 217 of 365 in D1. Trending down strongly 🔴.
- Shooting (Shooting): Currently ranked 43 of 365 in D1. Trending up moderately 🟢.
Defensive Trends:
- Opp Turnovers (Opp Turnovers): Currently ranked 55 of 365 in D1. Trending down moderately 🔴.
- Opp Shooting (Opp Shooting): Currently ranked 132 of 365 in D1. Trending up weakly 🔴.
Furman
Record: 18-11 | Elo: 1566.2 (ranked 98 of 365) | Efficiency Margin: -3.57 (ranked 197 of 365)
Offensive Trends:
- Off Reb Pct (Offensive Rebounding): Currently ranked 165 of 365 in D1. Trending down strongly 🔴.
- Shooting (Shooting): Currently ranked 59 of 365 in D1. Trending down moderately 🔴.
Defensive Trends:
- Opp Turnovers (Opp Turnovers): Currently ranked 345 of 365 in D1. Trending down strongly 🔴.
- Opp Shooting (Opp Shooting): Currently ranked 74 of 365 in D1. Trending down weakly 🟢.
Mercer
Record: 18-11 | Elo: 1514.2 (ranked 162 of 365) | Efficiency Margin: -0.98 (ranked 167 of 365)
Offensive Trends:
- Shooting (Shooting): Currently ranked 94 of 365 in D1. Trending up strongly 🟢.
- Off Reb Pct (Offensive Rebounding): Currently ranked 88 of 365 in D1. Trending down strongly 🔴.
Defensive Trends:
- Opp Turnovers (Opp Turnovers): Currently ranked 165 of 365 in D1. Trending down strongly 🔴.
- Opp Shooting (Opp Shooting): Currently ranked 258 of 365 in D1. Trending up moderately 🔴.
Samford
Record: 16-13 | Elo: 1566.2 (ranked 99 of 365) | Efficiency Margin: -7.57 (ranked 232 of 365)
Offensive Trends:
- Off Reb Pct (Offensive Rebounding): Currently ranked 341 of 365 in D1. Trending down strongly 🔴.
- Shooting (Shooting): Currently ranked 138 of 365 in D1. Trending up moderately 🟢.
Defensive Trends:
- Def Reb Pct (Defensive Rebounding): Currently ranked 22 of 365 in D1. Trending up strongly 🟢.
- Opp Turnovers (Opp Turnovers): Currently ranked 352 of 365 in D1. Trending down moderately 🔴.
The Citadel
Record: 9-20 | Elo: 1295.3 (ranked 363 of 365) | Efficiency Margin: -27.16 (ranked 355 of 365)
Offensive Trends:
- Shooting (Shooting): Currently ranked 318 of 365 in D1. Trending down strongly 🔴.
- Off Reb Pct (Offensive Rebounding): Currently ranked 237 of 365 in D1. Trending down strongly 🔴.
Defensive Trends:
- Opp Shooting (Opp Shooting): Currently ranked 358 of 365 in D1. Trending up strongly 🔴.
- Opp Turnovers (Opp Turnovers): Currently ranked 325 of 365 in D1. Trending up strongly 🟢.
UNCG
Record: 12-17 | Elo: 1470.9 (ranked 228 of 365) | Efficiency Margin: -18.53 (ranked 318 of 365)
Offensive Trends:
- Shooting (Shooting): Currently ranked 171 of 365 in D1. Trending up strongly 🟢.
- Off Reb Pct (Offensive Rebounding): Currently ranked 277 of 365 in D1. Trending down strongly 🔴.
Defensive Trends:
- Opp Shooting (Opp Shooting): Currently ranked 349 of 365 in D1. Trending up strongly 🔴.
- Opp Turnovers (Opp Turnovers): Currently ranked 343 of 365 in D1. Trending up moderately 🟢.
VMI
Record: 4-23 | Elo: 1283.8 (ranked 366 of 365) | Efficiency Margin: -27.97 (ranked 357 of 365)
Offensive Trends:
- Turnovers (Turnovers): Currently ranked 86 of 365 in D1. Trending down strongly 🟢.
- Off Reb Pct (Offensive Rebounding): Currently ranked 332 of 365 in D1. Trending down strongly 🔴.
Defensive Trends:
- Opp Turnovers (Opp Turnovers): Currently ranked 212 of 365 in D1. Trending down strongly 🔴.
- Opp Shooting (Opp Shooting): Currently ranked 355 of 365 in D1. Trending up moderately 🔴.
W Carolina
Record: 12-15 | Elo: 1445.2 (ranked 253 of 365) | Efficiency Margin: -10.93 (ranked 258 of 365)
Offensive Trends:
- Shooting (Shooting): Currently ranked 213 of 365 in D1. Trending up strongly 🟢.
- Turnovers (Turnovers): Currently ranked 146 of 365 in D1. Trending down strongly 🟢.
Defensive Trends:
- Def Reb Pct (Defensive Rebounding): Currently ranked 27 of 365 in D1. Trending up strongly 🟢.
- Opp Shooting (Opp Shooting): Currently ranked 324 of 365 in D1. Trending down weakly 🟢.
Wofford
Record: 18-11 | Elo: 1541.0 (ranked 132 of 365) | Efficiency Margin: -7.60 (ranked 233 of 365)
Offensive Trends:
- Off Reb Pct (Offensive Rebounding): Currently ranked 199 of 365 in D1. Trending down strongly 🔴.
- Turnovers (Turnovers): Currently ranked 13 of 365 in D1. Trending down moderately 🟢.
Defensive Trends:
- Opp Shooting (Opp Shooting): Currently ranked 282 of 365 in D1. Trending up strongly 🔴.
- Def Reb Pct (Defensive Rebounding): Currently ranked 118 of 365 in D1. Trending up strongly 🟢.
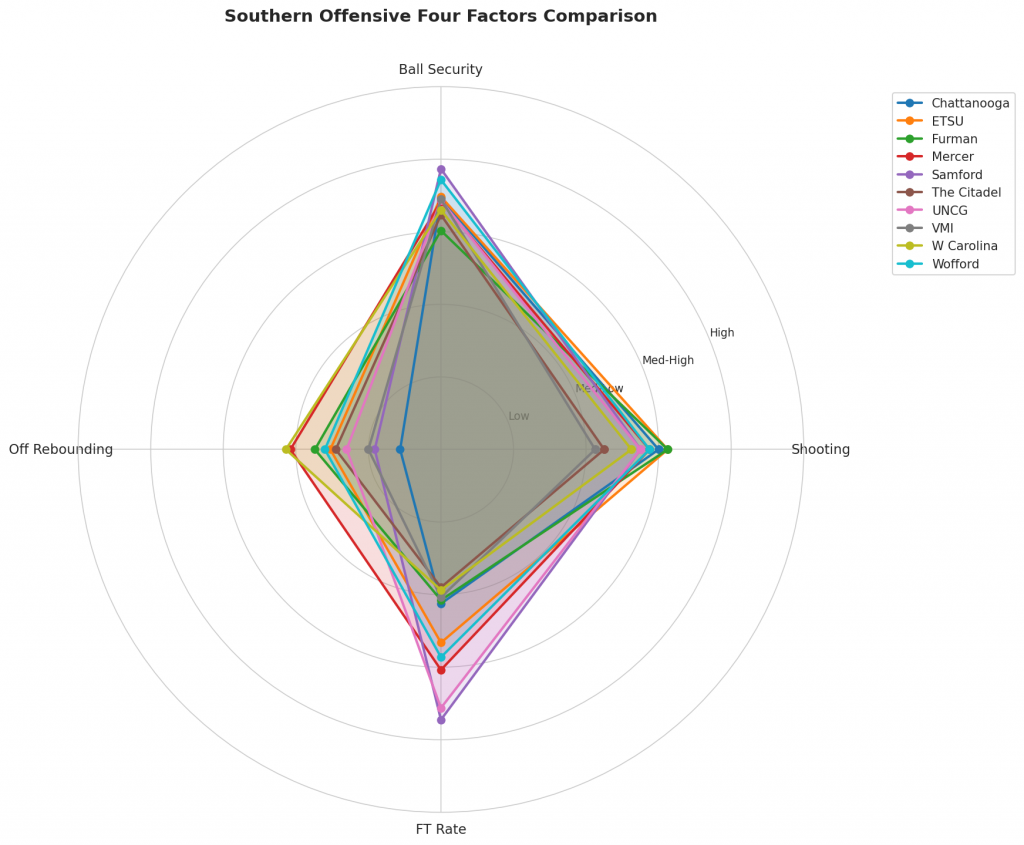
Figure 2: Offensive Four Factors comparison across Southern teams. The radar chart shows each team’s shooting efficiency (eFG%), ball security (TOV%), offensive rebounding (OREB%), and free throw generation (FT Rate).
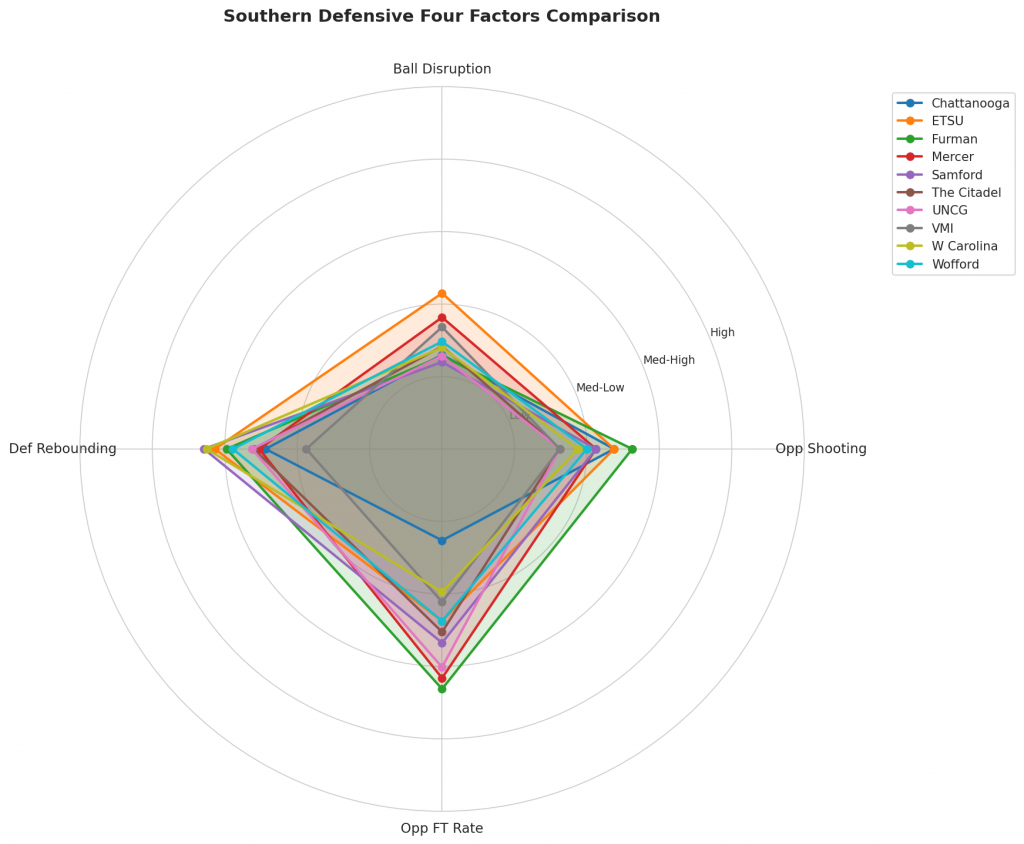
Figure 3: Defensive Four Factors comparison across Southern teams. The radar chart shows each team’s opponent shooting defense (Opp eFG%), ball disruption (forcing TOV%), defensive rebounding (DREB%), and opponent free throw prevention (Opp FT Rate).
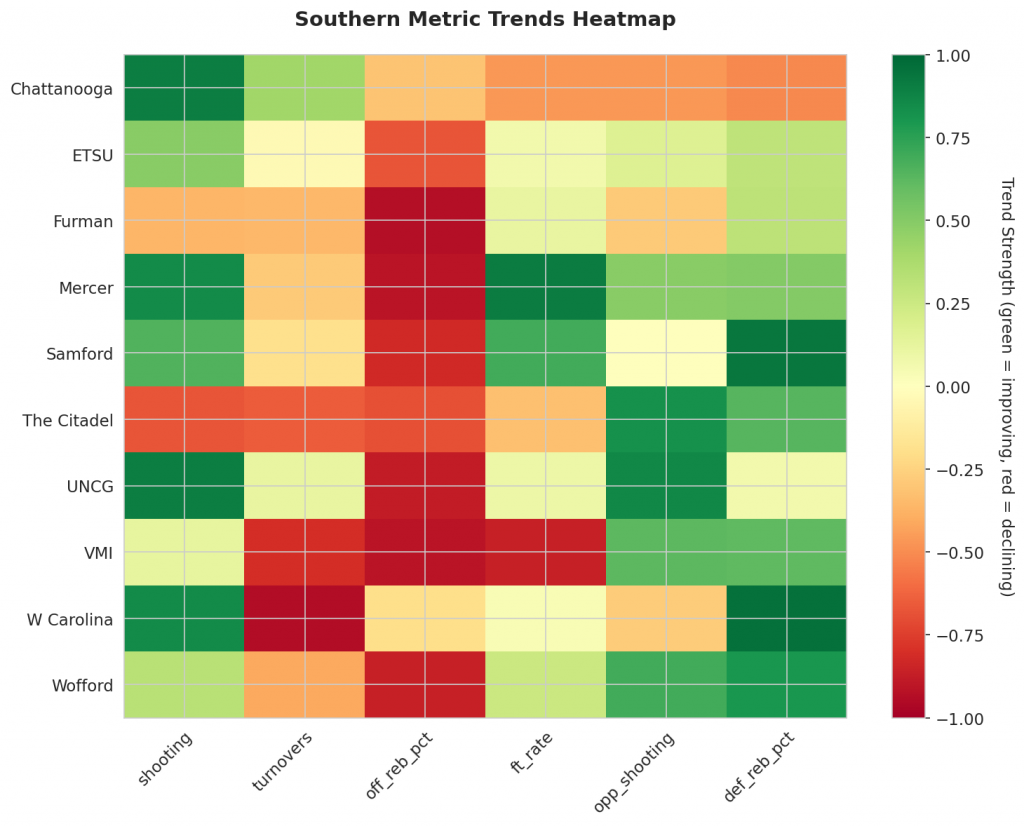
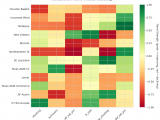
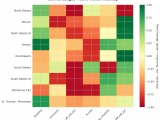
Figure 4: MACD trends heatmap showing which metrics are improving (green) or declining (red) for each team. Stronger colors indicate more pronounced trends.
Looking Ahead
Southern Conference Teams Show Signs of Improvement
As we conclude our analysis of Week 16 in the Southern Conference, trends in key offensive and defensive categories reveal which teams are gaining momentum and which are experiencing a decline. By examining these indicators, we gain insight into the genuine improvements versus unsustainable success.
Offensive Trends to Note:
Chattanooga’s shooting percentage is trending up strongly, averaging .54 on the season. Mercer’s shooting percentage is also noteworthy, averaging .53 on the season.
Defensive Trends:
Furman’s offensive rebounding percentage is struggling, with a downward trend. ETSU and Chattanooga are both experiencing difficulties in forcing turnovers against opponents, each averaging .128 on the season.
Metrics Glossary
Four Factors (Dean Oliver’s framework for basketball success):
- eFG% (Effective Field Goal %): Field goal percentage adjusted for 3-pointers being worth more (FGM + 0.5×3PM) / FGA. Higher is better offensively, lower is better defensively.
- TOV% (Turnover Rate): Turnovers per 100 possessions. Lower is better offensively (taking care of the ball), higher is better defensively (forcing turnovers).
- OREB% / DREB% (Offensive/Defensive Rebound Rate): Percentage of available rebounds grabbed. Offensive rebounds create second-chance points; defensive rebounds end opponent possessions.
- FTR (Free Throw Rate): Free throws made per field goal attempt (FTM/FGA). Measures ability to get to the line AND convert. Higher is better offensively, lower is better defensively.
Other Metrics:
- Elo Rating: Chess-style rating system that updates based on game results and opponent strength. Higher Elo indicates stronger team.
- Efficiency Margin: Point differential per 100 possessions (Offensive Efficiency – Defensive Efficiency). Accounts for pace of play.
- MACD (Moving Average Convergence Divergence): Trend indicator comparing 12-game and 26-game exponential moving averages. Positive MACD = improving trend, Negative MACD = declining trend.
Analysis powered by HoopSci’s advanced metrics and MACD trending indicators.