Summit League Update: Week 16
February 24, 2026Strongest Offensive Trends
- South Dakota, Off Reb Pct, Down, Trend Strength: -0.042 – South Dakota has been experiencing difficulties in securing rebounds on offense, hindering their ability to maintain possession and create scoring opportunities.
- North Dakota, Off Reb Pct, Down, Trend Strength: -0.036 – North Dakota’s struggle on the boards has contributed to their difficulties in securing rebounds and gaining possession, hindering their scoring opportunities.
- Omaha, Shooting, Up, Trend Strength: 0.021 – Omaha’s improvement in three-point shooting has been a notable aspect of their recent performance, with more efficient shot selection and execution on the court contributing to their cohesive unit.
- North Dakota St, Off Reb Pct, Down, Trend Strength: -0.021 – North Dakota St’s inability to capitalize on their scoring opportunities has been a persistent problem, limiting their ability to sustain momentum and maintain possession in conference play.
- Denver, Turnovers, Down, Trend Strength: -0.014 – Denver’s decrease in turnovers, from 14.1 per game to 12.5, has directly contributed to their success on the court, allowing them to capitalize on more scoring opportunities and maintain a competitive edge through reduced possessions ended by opponent takeovers.
Strongest Defensive Trends
- Denver, Def Reb Pct, Up, Trend Strength: 0.029 – Denver’s defensive rebounding has enabled them to better capitalize on their opponents’ second-chance opportunities, as evidenced by enhanced positioning and reduced concessions.
- North Dakota St, Def Reb Pct, Up, Trend Strength: 0.026 – North Dakota St has been struggling with securing key defensive rebounds, allowing opponents to capitalize on second-chance scoring opportunities and maintain momentum in games.
- North Dakota, Def Reb Pct, Down, Trend Strength: -0.02 – North Dakota’s struggle to secure rebounds has stifled opponents on crucial possessions, allowing them to capitalize on second-chance opportunities.
- Omaha, Opp Shooting, Up, Trend Strength: 0.011 – Omaha’s struggles to contain opposing offenses are reflected in their overall team performance, which has declined after losing two consecutive games and holding a subpar record compared to previous seasons in the Summit League.
- Denver, Opp Turnovers, Down, Trend Strength: -0.009 – Denver’s defense has struggled to force turnovers on opposing teams, which has stifled their own ability to create takeaways and ultimately limited their capacity for offense.
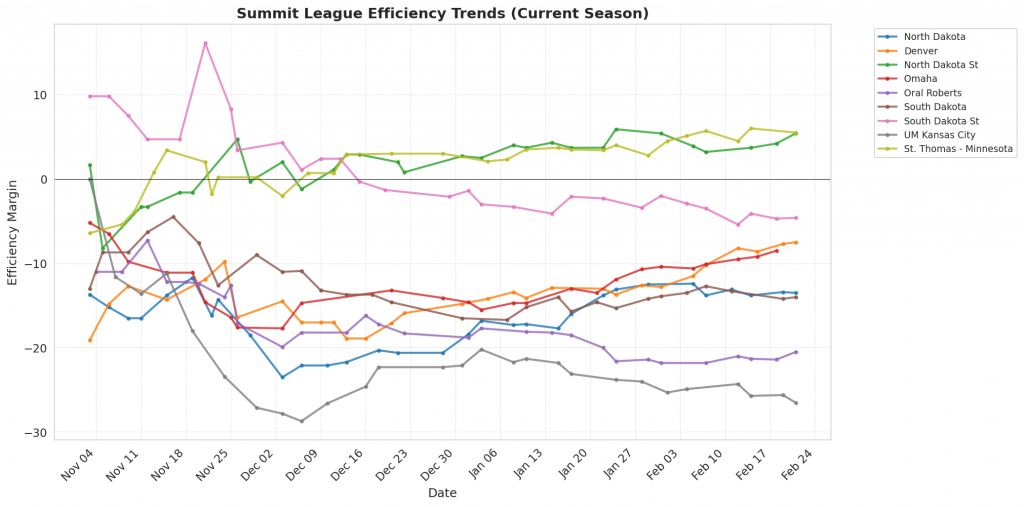
Figure 1: Efficiency margin trends for Summit League teams throughout the season. Teams trending upward show improving performance, while downward trends indicate struggles.
Conference Snapshot
- Week Dates: February 16 – February 22, 2026
- Trending Up (Efficiency): North Dakota, Denver, North Dakota St, Omaha, South Dakota St
- Trending Down (Efficiency): Oral Roberts, South Dakota, UM Kansas City
Team-by-Team Analysis
Denver
Record: 15-15 | Elo: 1441.5 (ranked 257 of 365) | Efficiency Margin: -7.55 (ranked 231 of 365)
Offensive Trends:
- Turnovers (Turnovers): Currently ranked 21 of 365 in D1. Trending down strongly 🟢.
- Off Reb Pct (Offensive Rebounding): Currently ranked 175 of 365 in D1. Trending down moderately 🔴.
Defensive Trends:
- Opp Turnovers (Opp Turnovers): Currently ranked 352 of 365 in D1. Trending down strongly 🔴.
- Def Reb Pct (Defensive Rebounding): Currently ranked 251 of 365 in D1. Trending up strongly 🟢.
North Dakota
Record: 16-15 | Elo: 1450.5 (ranked 244 of 365) | Efficiency Margin: -13.49 (ranked 283 of 365)
Offensive Trends:
- Off Reb Pct (Offensive Rebounding): Currently ranked 251 of 365 in D1. Trending down strongly 🔴.
- Shooting (Shooting): Currently ranked 280 of 365 in D1. Trending up moderately 🟢.
Defensive Trends:
- Def Reb Pct (Defensive Rebounding): Currently ranked 290 of 365 in D1. Trending down strongly 🔴.
- Opp Turnovers (Opp Turnovers): Currently ranked 28 of 365 in D1. Trending down moderately 🔴.
North Dakota St
Record: 23-6 | Elo: 1617.5 (ranked 62 of 365) | Efficiency Margin: +5.37 (ranked 112 of 365)
Offensive Trends:
- Off Reb Pct (Offensive Rebounding): Currently ranked 74 of 365 in D1. Trending down strongly 🔴.
- Shooting (Shooting): Currently ranked 83 of 365 in D1. Trending up moderately 🟢.
Defensive Trends:
- Def Reb Pct (Defensive Rebounding): Currently ranked 32 of 365 in D1. Trending up strongly 🟢.
- Opp Shooting (Opp Shooting): Currently ranked 231 of 365 in D1. Trending down weakly 🟢.
Omaha
Record: 12-14 | Elo: 1494.1 (ranked 196 of 365) | Efficiency Margin: -8.45 (ranked 242 of 365)
Offensive Trends:
- Shooting (Shooting): Currently ranked 76 of 365 in D1. Trending up strongly 🟢.
- Off Reb Pct (Offensive Rebounding): Currently ranked 329 of 365 in D1. Trending down moderately 🔴.
Defensive Trends:
- Opp Shooting (Opp Shooting): Currently ranked 263 of 365 in D1. Trending up strongly 🔴.
- Def Reb Pct (Defensive Rebounding): Currently ranked 120 of 365 in D1. Trending up moderately 🟢.
Oral Roberts
Record: 7-22 | Elo: 1310.0 (ranked 358 of 365) | Efficiency Margin: -20.53 (ranked 330 of 365)
Offensive Trends:
- Shooting (Shooting): Currently ranked 313 of 365 in D1. Trending down moderately 🔴.
- Off Reb Pct (Offensive Rebounding): Currently ranked 280 of 365 in D1. Trending down moderately 🔴.
Defensive Trends:
- Def Reb Pct (Defensive Rebounding): Currently ranked 289 of 365 in D1. Trending up strongly 🟢.
- Opp Shooting (Opp Shooting): Currently ranked 314 of 365 in D1. Trending down weakly 🟢.
South Dakota
Record: 13-15 | Elo: 1436.3 (ranked 266 of 365) | Efficiency Margin: -14.05 (ranked 286 of 365)
Offensive Trends:
- Off Reb Pct (Offensive Rebounding): Currently ranked 233 of 365 in D1. Trending down strongly 🔴.
- Shooting (Shooting): Currently ranked 236 of 365 in D1. Trending down moderately 🔴.
Defensive Trends:
- Opp Shooting (Opp Shooting): Currently ranked 321 of 365 in D1. Trending down strongly 🟢.
- Opp Turnovers (Opp Turnovers): Currently ranked 224 of 365 in D1. Trending down strongly 🔴.
South Dakota St
Record: 13-16 | Elo: 1477.6 (ranked 214 of 365) | Efficiency Margin: -4.59 (ranked 204 of 365)
Offensive Trends:
- Turnovers (Turnovers): Currently ranked 148 of 365 in D1. Trending down strongly 🟢.
- Off Reb Pct (Offensive Rebounding): Currently ranked 202 of 365 in D1. Trending down strongly 🔴.
Defensive Trends:
- Opp Shooting (Opp Shooting): Currently ranked 196 of 365 in D1. Trending up strongly 🔴.
- Opp Turnovers (Opp Turnovers): Currently ranked 288 of 365 in D1. Trending down moderately 🔴.
St. Thomas – Minnesota
Record: 21-8 | Elo: 1580.4 (ranked 82 of 365) | Efficiency Margin: +5.46 (ranked 109 of 365)
Offensive Trends:
- Shooting (Shooting): Currently ranked 6 of 365 in D1. Trending up strongly 🟢.
- Off Reb Pct (Offensive Rebounding): Currently ranked 360 of 365 in D1. Trending down moderately 🔴.
Defensive Trends:
- Opp Turnovers (Opp Turnovers): Currently ranked 113 of 365 in D1. Trending down strongly 🔴.
- Opp Shooting (Opp Shooting): Currently ranked 217 of 365 in D1. Trending down weakly 🟢.
UM Kansas City
Record: 3-24 | Elo: 1287.3 (ranked 365 of 365) | Efficiency Margin: -26.50 (ranked 353 of 365)
Offensive Trends:
- Off Reb Pct (Offensive Rebounding): Currently ranked 270 of 365 in D1. Trending down strongly 🔴.
- Shooting (Shooting): Currently ranked 345 of 365 in D1. Trending down moderately 🔴.
Defensive Trends:
- Opp Shooting (Opp Shooting): Currently ranked 336 of 365 in D1. Trending up moderately 🔴.
- Def Reb Pct (Defensive Rebounding): Currently ranked 349 of 365 in D1. Trending down moderately 🔴.
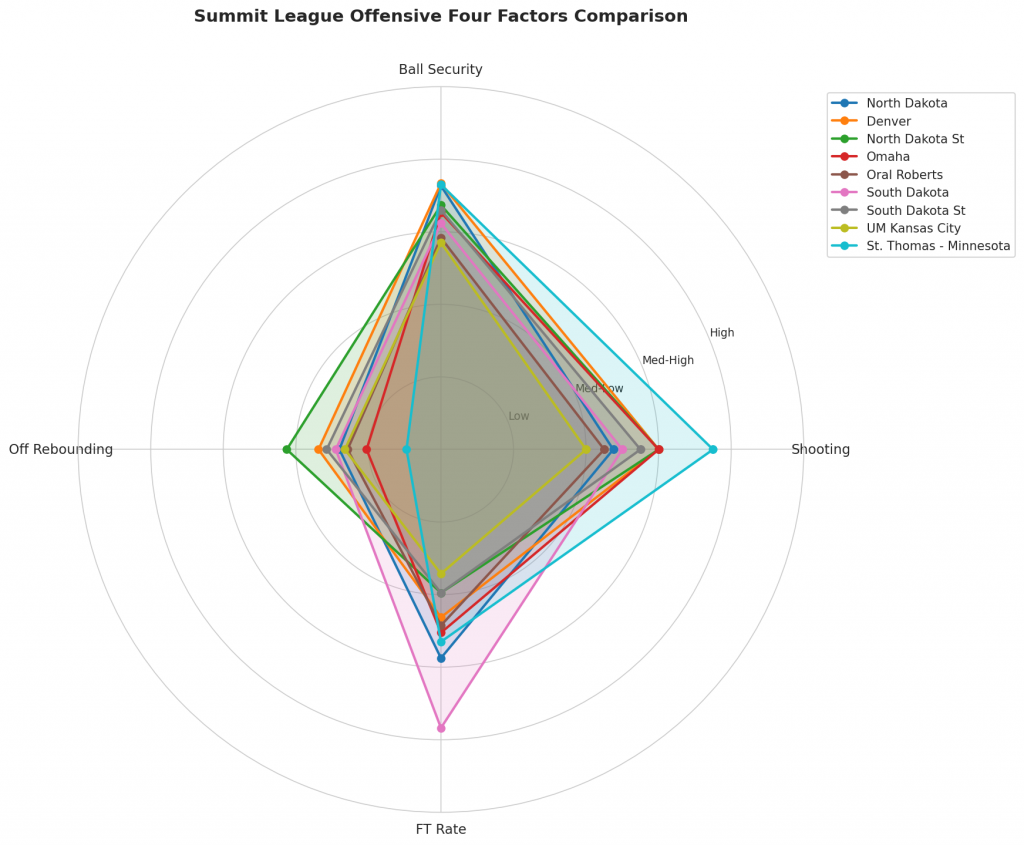
Figure 2: Offensive Four Factors comparison across Summit League teams. The radar chart shows each team’s shooting efficiency (eFG%), ball security (TOV%), offensive rebounding (OREB%), and free throw generation (FT Rate).
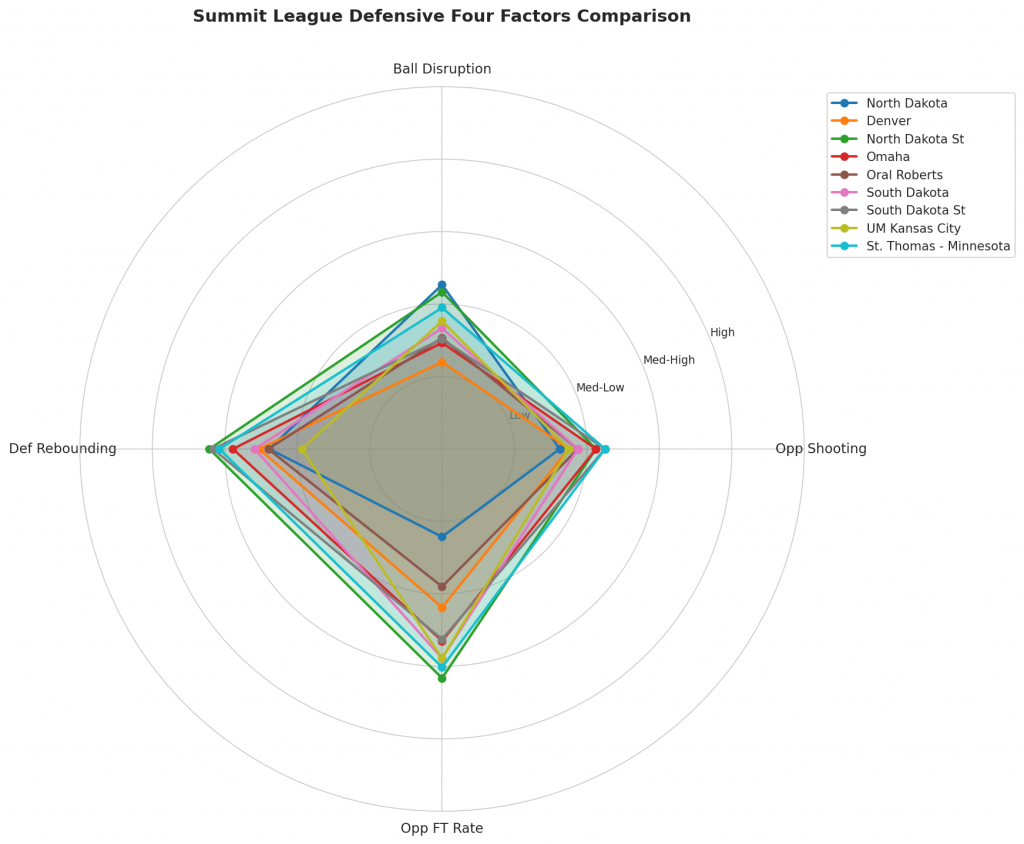
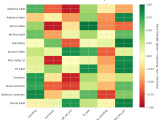
Figure 3: Defensive Four Factors comparison across Summit League teams. The radar chart shows each team’s opponent shooting defense (Opp eFG%), ball disruption (forcing TOV%), defensive rebounding (DREB%), and opponent free throw prevention (Opp FT Rate).
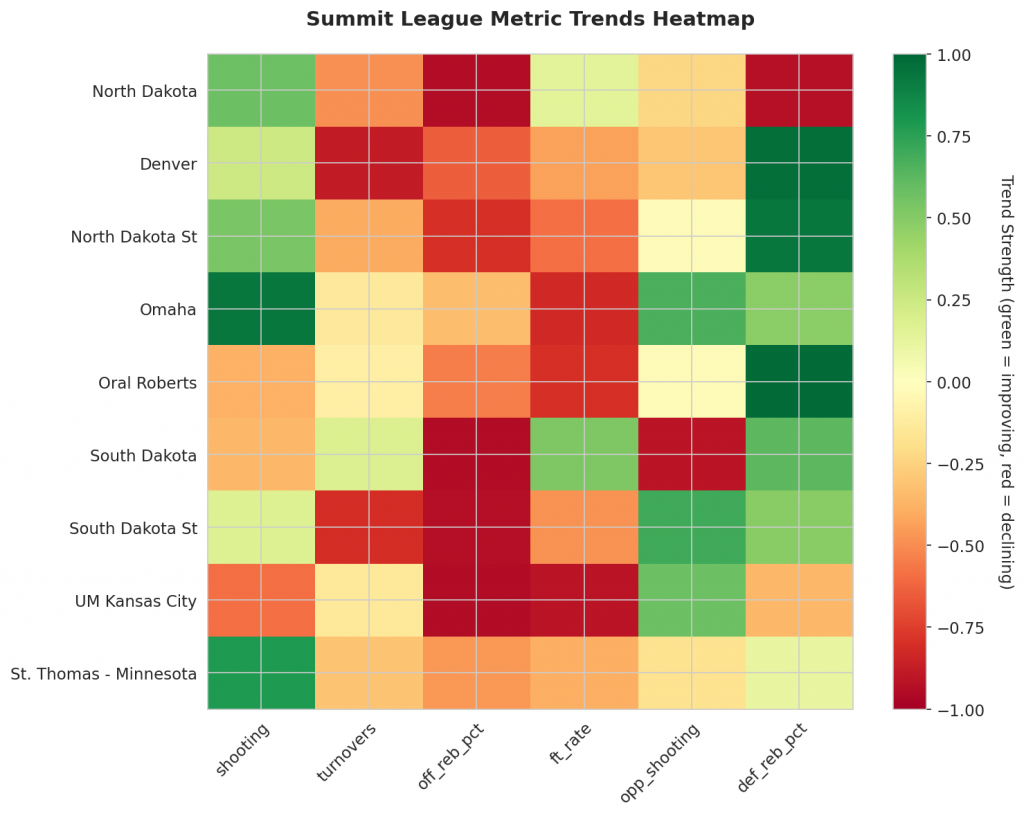
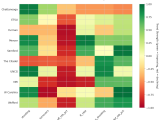
Figure 4: MACD trends heatmap showing which metrics are improving (green) or declining (red) for each team. Stronger colors indicate more pronounced trends.
Looking Ahead
Summit League Teams Display Varied Momentum Heading into Week 17
As the Summit League season continues, several teams are exhibiting notable trends in key offensive and defensive metrics. This analysis focuses on the most significant developments for each team.
Offensive Trends to Watch
North Dakota’s performance has been impacted by a decline in Offensive Rebound Percentage (ORP), with a Season Average of 0.262 indicating worsening struggles in securing rebounds on offense. In contrast, Denver has seen improvement in Turnovers, with a decrease in their Turnover rate (Season Avg: 0.13) suggesting enhanced ball control and increased shooting percentage. The Mavericks’ performance is noteworthy, as they have made strides in these key areas.
Omaha’s performance is another area of interest, as they have shown stability in various metrics. Conversely, North Dakota State and South Dakota are struggling to secure rebounds on offense, with both teams trending down in ORP.
Defensive Trends to Highlight
Denver’s Defensive Rebound Percentage (DRP) has seen a significant uptick, indicating that the team is now grabbing more defensive boards than ever before. This trend is strongly supported by the data. North Dakota State’s DRP also shows improvement.
The MACD momentum indicator measures a team’s momentum by analyzing their recent performance and comparing it to their overall trend. It highlights which teams are genuinely improving versus those experiencing unsustainable trends. In simple terms, it helps identify which teams’ recent successes may be short-lived or part of a larger upward trend. The indicator is calculated using the difference between the exponential moving averages of two time series.
In next week’s analysis, we’ll provide updated trends and continue our examination of the Summit League teams’ performance.
Oral Roberts joins this discussion as an additional team to monitor, showcasing stable metrics in various categories.
Metrics Glossary
Four Factors (Dean Oliver’s framework for basketball success):
- eFG% (Effective Field Goal %): Field goal percentage adjusted for 3-pointers being worth more (FGM + 0.5×3PM) / FGA. Higher is better offensively, lower is better defensively.
- TOV% (Turnover Rate): Turnovers per 100 possessions. Lower is better offensively (taking care of the ball), higher is better defensively (forcing turnovers).
- OREB% / DREB% (Offensive/Defensive Rebound Rate): Percentage of available rebounds grabbed. Offensive rebounds create second-chance points; defensive rebounds end opponent possessions.
- FTR (Free Throw Rate): Free throws made per field goal attempt (FTM/FGA). Measures ability to get to the line AND convert. Higher is better offensively, lower is better defensively.
Other Metrics:
- Elo Rating: Chess-style rating system that updates based on game results and opponent strength. Higher Elo indicates stronger team.
- Efficiency Margin: Point differential per 100 possessions (Offensive Efficiency – Defensive Efficiency). Accounts for pace of play.
- MACD (Moving Average Convergence Divergence): Trend indicator comparing 12-game and 26-game exponential moving averages. Positive MACD = improving trend, Negative MACD = declining trend.
Analysis powered by HoopSci’s advanced metrics and MACD trending indicators.