Missouri Valley Update: Week 17
March 2, 2026Strongest Offensive Trends
- Evansville, Off Reb Pct, Down, Trend Strength: -0.034 – Evansville’s struggling offense, which ranks last in the Missouri Valley conference in scoring average at 63 points per game, is partly due to its inability to capitalize on opponent turnovers, a trend that has emerged as a significant challenge for the team.
- Drake, Shooting, Down, Trend Strength: -0.016 – Drake’s inconsistent shooting is a problem, contributing to their struggle to capitalize on scoring opportunities due to poor shooting.
- Evansville, Turnovers, Down, Trend Strength: -0.01 – Evansville has notably reduced its average turnovers per game, directly contributing to their current winning streak by limiting opponents’ scoring opportunities and allowing them to maintain possession effectively.
- Indiana State, Turnovers, Up, Trend Strength: 0.01 – Indiana State’s struggles with turnovers are evident in their offense, hindering their performance.
- Drake, Turnovers, Up, Trend Strength: 0.009 – Drake’s offense has struggled to capitalize on scoring opportunities due to their turnover issue, which has been a problem throughout their games.
Strongest Defensive Trends
- Illinois State, Opp Shooting, Up, Trend Strength: 0.017 – Illinois State’s defense has been unable to effectively counter opponents’ frequent three-point attempts, allowing them to maintain a consistent threat from beyond the arc.
- Evansville, Opp Shooting, Up, Trend Strength: 0.017 – Evansville’s stifling defense has led to significant scoring difficulties for their opponents.
- Evansville, Opp Turnovers, Down, Trend Strength: -0.011 – Evansville’s defense has been stifled in its ability to force turnovers, a trend that opponents have adjusted their strategies against, making it increasingly difficult for the team.
- Drake, Opp Turnovers, Down, Trend Strength: -0.011 – The inability of Team Drake to limit possessions has caused significant defensive issues by hindering its ability to force turnovers.
- Bradley, Opp Turnovers, Down, Trend Strength: -0.01 – Bradley’s stifling defensive play has hit a snag, as their inability to capitalize on Opp Turnovers continues to struggle, resulting in fewer opportunities to create scoring chances compared to earlier in the season.
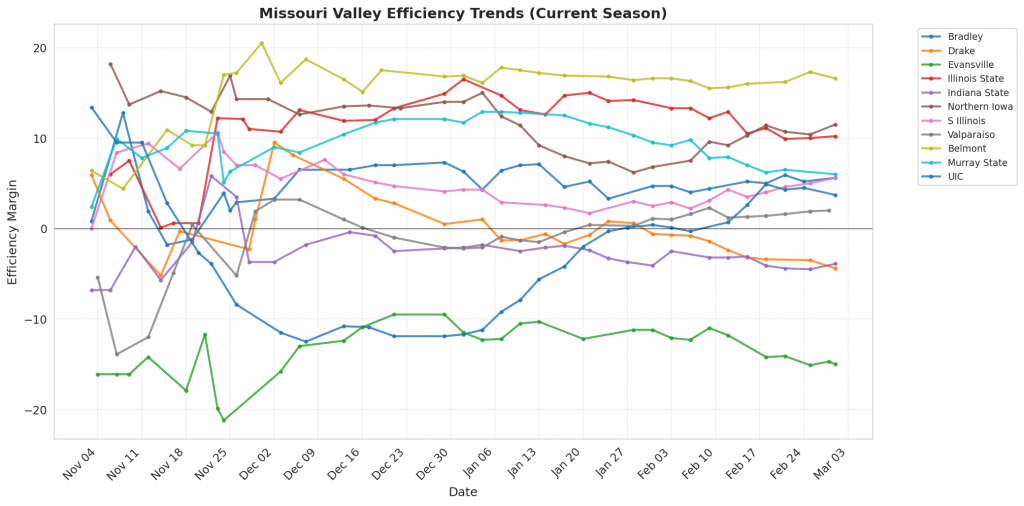
Figure 1: Efficiency margin trends for Missouri Valley teams throughout the season. Teams trending upward show improving performance, while downward trends indicate struggles.
Conference Snapshot
- Week Dates: February 23 – March 01, 2026
- Trending Up (Efficiency): Bradley, Evansville, Illinois State, Indiana State, Northern Iowa
- Trending Down (Efficiency): Drake, S Illinois, Murray State
Team-by-Team Analysis
Belmont
Record: 26-5 | Elo: 1690.5 (ranked 26 of 365) | Efficiency Margin: +16.57 (ranked 45 of 365)
Offensive Trends:
- Shooting (Shooting): Currently ranked 1 of 365 in D1. Trending up strongly 🟢.
- Turnovers (Turnovers): Currently ranked 296 of 365 in D1. Trending down strongly 🟢.
Defensive Trends:
- Opp Shooting (Opp Shooting): Currently ranked 84 of 365 in D1. Trending up strongly 🔴.
- Opp Turnovers (Opp Turnovers): Currently ranked 135 of 365 in D1. Trending down moderately 🔴.
Bradley
Record: 20-11 | Elo: 1631.3 (ranked 53 of 365) | Efficiency Margin: +5.56 (ranked 108 of 365)
Offensive Trends:
- Shooting (Shooting): Currently ranked 190 of 365 in D1. Trending up moderately 🟢.
- Off Reb Pct (Offensive Rebounding): Currently ranked 259 of 365 in D1. Trending up moderately 🟢.
Defensive Trends:
- Opp Turnovers (Opp Turnovers): Currently ranked 49 of 365 in D1. Trending down strongly 🔴.
- Opp Shooting (Opp Shooting): Currently ranked 236 of 365 in D1. Trending up weakly 🔴.
Drake
Record: 10-19 | Elo: 1524.6 (ranked 150 of 365) | Efficiency Margin: -4.42 (ranked 200 of 365)
Offensive Trends:
- Shooting (Shooting): Currently ranked 187 of 365 in D1. Trending down strongly 🔴.
- Turnovers (Turnovers): Currently ranked 66 of 365 in D1. Trending up strongly 🔴.
Defensive Trends:
- Opp Turnovers (Opp Turnovers): Currently ranked 306 of 365 in D1. Trending down strongly 🔴.
- Opp Shooting (Opp Shooting): Currently ranked 275 of 365 in D1. Trending up moderately 🔴.
Evansville
Record: 7-24 | Elo: 1362.1 (ranked 332 of 365) | Efficiency Margin: -15.00 (ranked 297 of 365)
Offensive Trends:
- Turnovers (Turnovers): Currently ranked 322 of 365 in D1. Trending down strongly 🟢.
- Off Reb Pct (Offensive Rebounding): Currently ranked 355 of 365 in D1. Trending down strongly 🔴.
Defensive Trends:
- Opp Shooting (Opp Shooting): Currently ranked 339 of 365 in D1. Trending up strongly 🔴.
- Opp Turnovers (Opp Turnovers): Currently ranked 250 of 365 in D1. Trending down strongly 🔴.
Illinois State
Record: 20-11 | Elo: 1581.1 (ranked 84 of 365) | Efficiency Margin: +10.24 (ranked 83 of 365)
Offensive Trends:
- Turnovers (Turnovers): Currently ranked 196 of 365 in D1. Trending up moderately 🔴.
- Shooting (Shooting): Currently ranked 66 of 365 in D1. Trending up weakly 🟢.
Defensive Trends:
- Opp Shooting (Opp Shooting): Currently ranked 101 of 365 in D1. Trending up strongly 🔴.
- Opp Turnovers (Opp Turnovers): Currently ranked 206 of 365 in D1. Trending down strongly 🔴.
Indiana State
Record: 11-20 | Elo: 1442.9 (ranked 254 of 365) | Efficiency Margin: -3.85 (ranked 197 of 365)
Offensive Trends:
- Turnovers (Turnovers): Currently ranked 335 of 365 in D1. Trending up strongly 🔴.
- Shooting (Shooting): Currently ranked 115 of 365 in D1. Trending up weakly 🟢.
Defensive Trends:
- Opp Shooting (Opp Shooting): Currently ranked 126 of 365 in D1. Trending down moderately 🟢.
- Def Reb Pct (Defensive Rebounding): Currently ranked 253 of 365 in D1. Trending down moderately 🔴.
Murray State
Record: 20-11 | Elo: 1557.8 (ranked 107 of 365) | Efficiency Margin: +6.03 (ranked 101 of 365)
Offensive Trends:
- Shooting (Shooting): Currently ranked 69 of 365 in D1. Trending down moderately 🔴.
- Turnovers (Turnovers): Currently ranked 193 of 365 in D1. Trending down moderately 🟢.
Defensive Trends:
- Opp Shooting (Opp Shooting): Currently ranked 219 of 365 in D1. Trending up strongly 🔴.
- Opp Turnovers (Opp Turnovers): Currently ranked 226 of 365 in D1. Trending up weakly 🟢.
Northern Iowa
Record: 19-12 | Elo: 1571.1 (ranked 93 of 365) | Efficiency Margin: +11.48 (ranked 76 of 365)
Offensive Trends:
- Shooting (Shooting): Currently ranked 104 of 365 in D1. Trending up strongly 🟢.
- Turnovers (Turnovers): Currently ranked 41 of 365 in D1. Trending down moderately 🟢.
Defensive Trends:
- Opp Turnovers (Opp Turnovers): Currently ranked 99 of 365 in D1. Trending up strongly 🟢.
- Def Reb Pct (Defensive Rebounding): Currently ranked 21 of 365 in D1. Trending down strongly 🔴.
S Illinois
Record: 16-15 | Elo: 1528.8 (ranked 145 of 365) | Efficiency Margin: +5.63 (ranked 105 of 365)
Offensive Trends:
- Turnovers (Turnovers): Currently ranked 233 of 365 in D1. Trending down strongly 🟢.
- Shooting (Shooting): Currently ranked 270 of 365 in D1. Trending down moderately 🔴.
Defensive Trends:
- Def Reb Pct (Defensive Rebounding): Currently ranked 27 of 365 in D1. Trending up strongly 🟢.
- Opp Shooting (Opp Shooting): Currently ranked 73 of 365 in D1. Trending down moderately 🟢.
UIC
Record: 17-14 | Elo: 1523.1 (ranked 153 of 365) | Efficiency Margin: +3.69 (ranked 125 of 365)
Offensive Trends:
- Shooting (Shooting): Currently ranked 278 of 365 in D1. Trending up moderately 🟢.
- Turnovers (Turnovers): Currently ranked 233 of 365 in D1. Trending up moderately 🔴.
Defensive Trends:
- Def Reb Pct (Defensive Rebounding): Currently ranked 305 of 365 in D1. Trending up strongly 🟢.
- Opp Shooting (Opp Shooting): Currently ranked 110 of 365 in D1. Trending up moderately 🔴.
Valparaiso
Record: 17-14 | Elo: 1505.4 (ranked 181 of 365) | Efficiency Margin: +1.96 (ranked 139 of 365)
Offensive Trends:
- Shooting (Shooting): Currently ranked 312 of 365 in D1. Trending up strongly 🟢.
- Turnovers (Turnovers): Currently ranked 70 of 365 in D1. Trending down moderately 🟢.
Defensive Trends:
- Opp Shooting (Opp Shooting): Currently ranked 133 of 365 in D1. Trending up strongly 🔴.
- Def Reb Pct (Defensive Rebounding): Currently ranked 122 of 365 in D1. Trending up strongly 🟢.
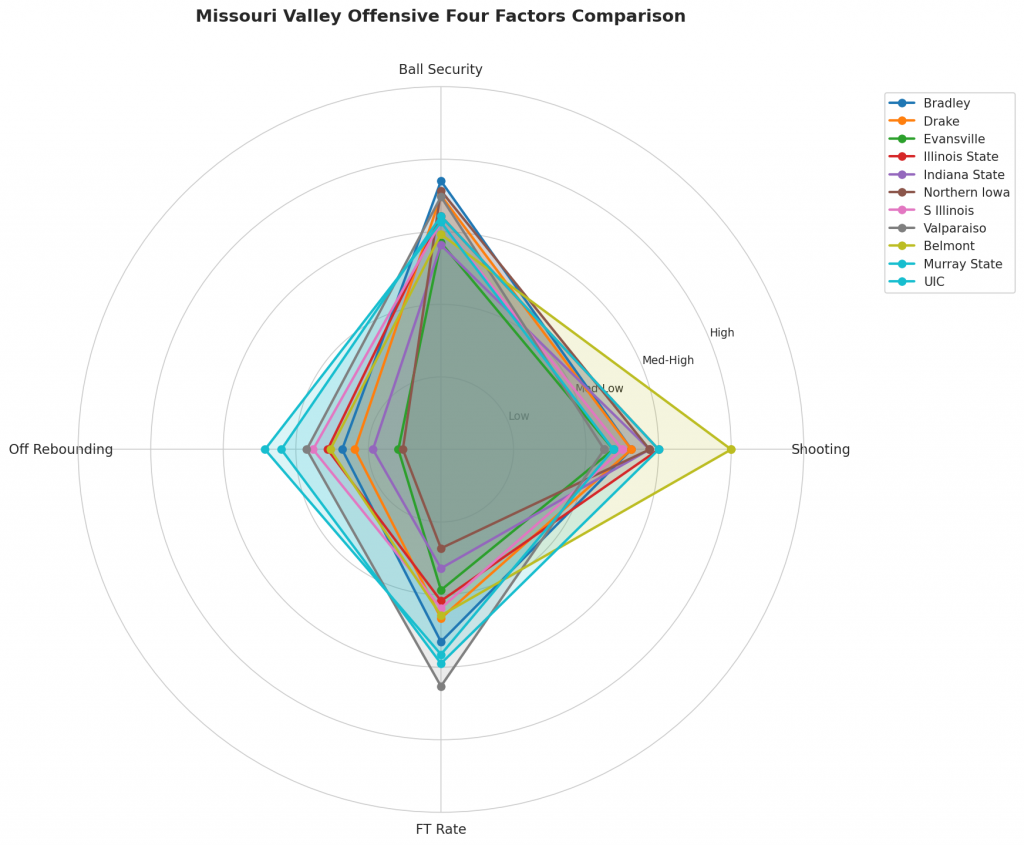
Figure 2: Offensive Four Factors comparison across Missouri Valley teams. The radar chart shows each team’s shooting efficiency (eFG%), ball security (TOV%), offensive rebounding (OREB%), and free throw generation (FT Rate).
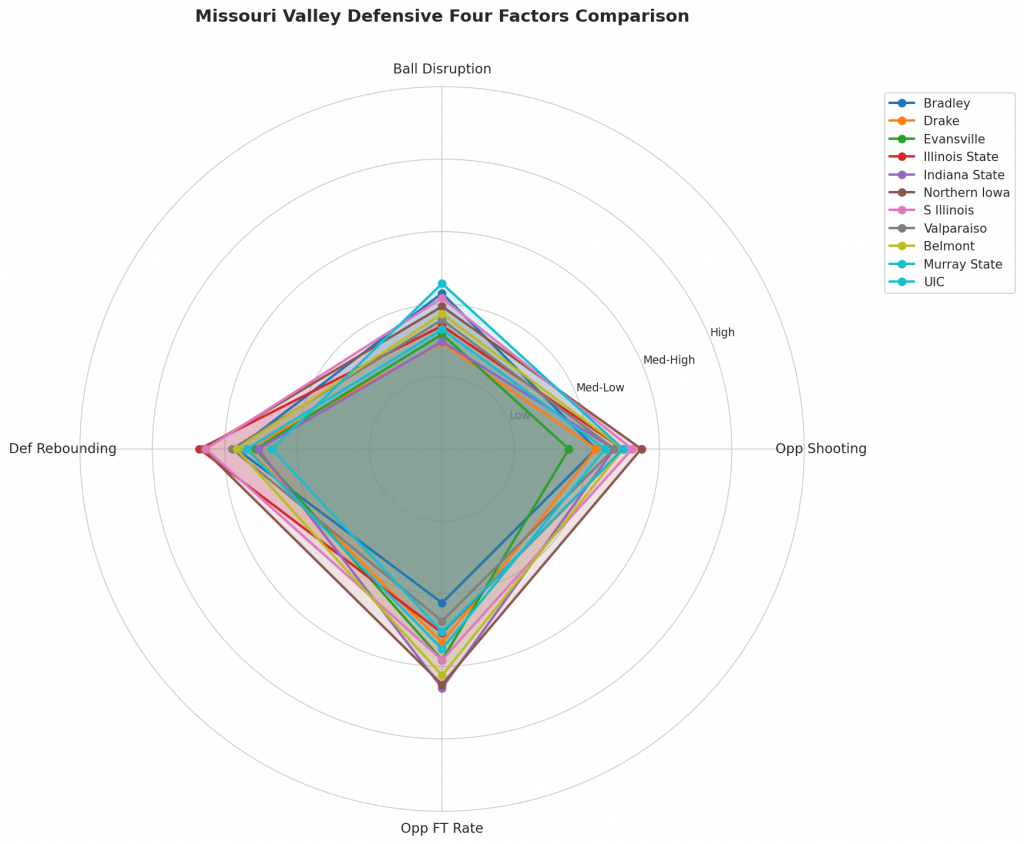
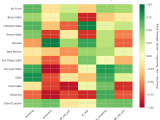
Figure 3: Defensive Four Factors comparison across Missouri Valley teams. The radar chart shows each team’s opponent shooting defense (Opp eFG%), ball disruption (forcing TOV%), defensive rebounding (DREB%), and opponent free throw prevention (Opp FT Rate).
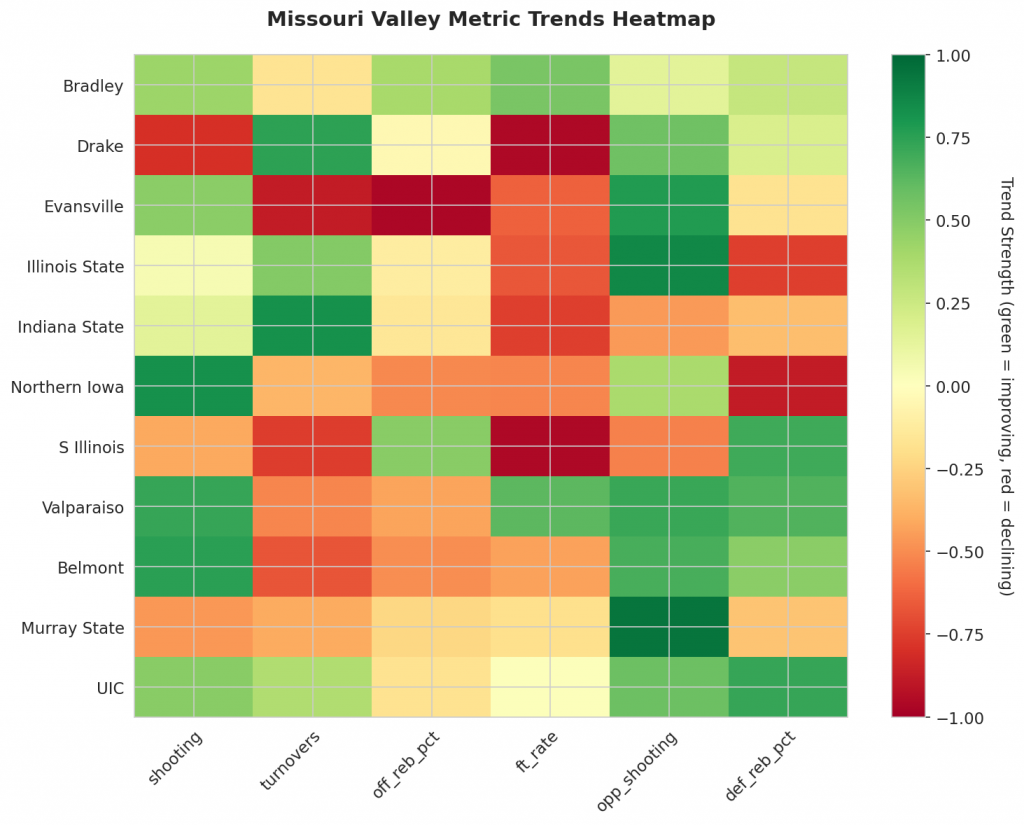
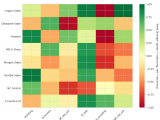
Figure 4: MACD trends heatmap showing which metrics are improving (green) or declining (red) for each team. Stronger colors indicate more pronounced trends.
Looking Ahead
Missouri Valley Teams’ Week 17 Analysis: Trends to Watch
As the Missouri Valley conference continues its season, several teams have notable trends emerging in their performances. In this article, we’ll examine key statistics that highlight areas of improvement or decline.
Offensive Trends to Highlight
- Drake’s shooting percentage has improved from a mean value of 0.45 to a current value of 0.51.
- Evansville is facing challenges with turnovers, averaging 0.145 turnovers per game, which could affect their chances of winning.
- Bradley’s efficiency in forcing turnovers has decreased, averaging 0.105 turnovers forced per game.
Defensive Trends to Highlight
- Illinois State’s defensive performance has improved, allowing a mean value of 1.02 points per possession compared to the current rate of 0.94.
- Northern Iowa is struggling on defense, allowing a significant increase in points per possession from a mean value of 0.95 to a current value of 1.08.
- Valparaiso’s defensive performance has worsened, allowing an average of 1.05 points per possession compared to the current rate of 1.14.
These trends provide valuable insights into the strengths and weaknesses of Missouri Valley teams heading into Week 17, showcasing areas where improvement is needed to secure wins.
Metrics Glossary
Four Factors (Dean Oliver’s framework for basketball success):
- eFG% (Effective Field Goal %): Field goal percentage adjusted for 3-pointers being worth more (FGM + 0.5×3PM) / FGA. Higher is better offensively, lower is better defensively.
- TOV% (Turnover Rate): Turnovers per 100 possessions. Lower is better offensively (taking care of the ball), higher is better defensively (forcing turnovers).
- OREB% / DREB% (Offensive/Defensive Rebound Rate): Percentage of available rebounds grabbed. Offensive rebounds create second-chance points; defensive rebounds end opponent possessions.
- FTR (Free Throw Rate): Free throws made per field goal attempt (FTM/FGA). Measures ability to get to the line AND convert. Higher is better offensively, lower is better defensively.
Other Metrics:
- Elo Rating: Chess-style rating system that updates based on game results and opponent strength. Higher Elo indicates stronger team.
- Efficiency Margin: Point differential per 100 possessions (Offensive Efficiency – Defensive Efficiency). Accounts for pace of play.
- MACD (Moving Average Convergence Divergence): Trend indicator comparing 12-game and 26-game exponential moving averages. Positive MACD = improving trend, Negative MACD = declining trend.
Analysis powered by HoopSci’s advanced metrics and MACD trending indicators.