Week 17: 2026’s Biggest Bullies
March 2, 2026College Basketball’s Most Troubling Trends: The Top 3 “Bullies” in Division I
As the college basketball season nears its conclusion, it’s essential to separate statistical flukes from genuine team performance. This week’s feature highlights teams whose metrics reveal notable disparities against weaker versus stronger competition.
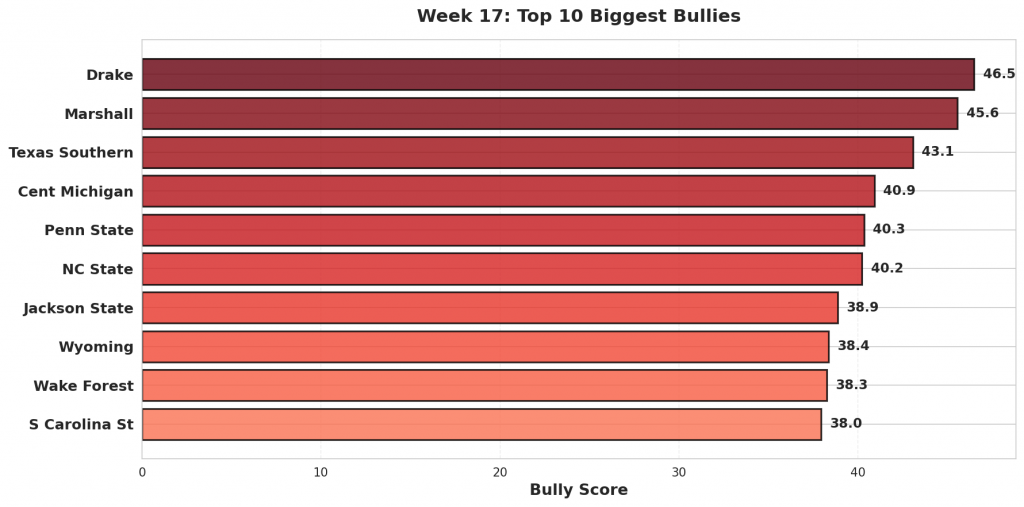
According to our analysis, three teams stand out as having significant discrepancies in their performance: Drake (46.5 Bully Score), Marshall (45.6 Bully Score), and Texas Southern (43.1 Bully Score). The Bully Score is a proprietary metric that gauges a team’s overall strength by comparing its performance against weaker and stronger competition.
Let’s examine the trends for these three teams in more detail:
- Drake exceeded expectations by +28.6 points versus weaker competition, but struggled with underperforming by -394.7 points versus stronger competition.
- Marshall outperformed expectations by +42.2 points versus weaker competition, yet had a problem with underperforming by -40.3 points versus stronger competition.
- Texas Southern outperformed expectations by +43.9 points versus weaker competition, but struggled to perform consistently against stronger competition, with an underperformance of -126.8 points.
These trends paint a concerning picture for these teams’ long-term prospects. The inability to perform consistently against quality competition raises concerns about their overall strength and potential vulnerabilities come tournament time. Furthermore, the discrepancies in performance between weaker and stronger opponents suggest that these teams may be overrated or underprepared for the challenges they will face in the postseason.
The Bully Score takes into account a team’s margin of victory (MOV) and strength of schedule (SOS), providing a comprehensive assessment of their overall strength. By examining these metrics, coaches and fans can gain valuable insights into a team’s abilities and identify areas for improvement.
As we near the end of the regular season, it will be crucial to monitor these trends and see if Drake, Marshall, and Texas Southern can correct their inconsistencies against stronger competition. Can they adapt their strategies to overcome their weaknesses and make a deep run in the tournament? Only time will tell.
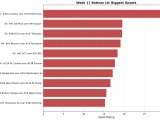
Figure 1: Top 10 teams with the highest bully scores in Week 17. Bully scores reflect the combination of overperformance against weak opponents and underperformance against quality competition.
#1: Drake (12-19)
#203 Drake was projected to beat #363 Western Illinois by 22. They cruised to a 108-57 victory, 29 points better than projected. Against #107 Bradley, Drake lost 93-66. They were projected to win by 5.
Bully Metrics: Exceeded projections by 28.6 total points against weak opponents (1 games); underperformed by 394.7 points against quality competition (22 games).
#2: Marshall (19-12)
Against #350 UL Monroe, #159 Marshall rolled to a 55-point win, 115-60. The model had them winning by 13; the actual margin was 55, outpacing the projection by 42. Facing #10 Virginia, Marshall came up short, losing 104-78 after being projected to lose by 3.
Bully Metrics: Exceeded projections by 42.2 total points against weak opponents (1 games); underperformed by 40.3 points against quality competition (12 games).
#3: Texas Southern (12-16)
#327 Texas Southern faced #330 Alabama State as 0-point favorites and won handily 96-64, 32 points above the spread. Texas Southern fell to #9 Gonzaga 98-43, missing the 27-point projection by 28.
Bully Metrics: Exceeded projections by 43.9 total points against weak opponents (2 games); underperformed by 126.8 points against quality competition (6 games).
#4: Cent Michigan (10-19)
Expected to win by 3 over #191 Eastern Michigan, #220 Cent Michigan coasted to a 100-65 win—beating the line by 32. The model had Cent Michigan losing by 6 against #22 Saint Louis. Instead, they lost 107-65.
Bully Metrics: Exceeded projections by 62.9 total points against weak opponents (2 games); underperformed by 141.6 points against quality competition (15 games).
#5: Penn State (12-17)
#153 Penn State cruised to a 87-43 victory against #308 New Haven. Favored by 6, the 44-point margin was +38 versus projection. Against #40 Indiana, Penn State lost 113-72. They were projected to lose by 1.
Bully Metrics: Exceeded projections by 58.9 total points against weak opponents (2 games); underperformed by 240.0 points against quality competition (22 games).
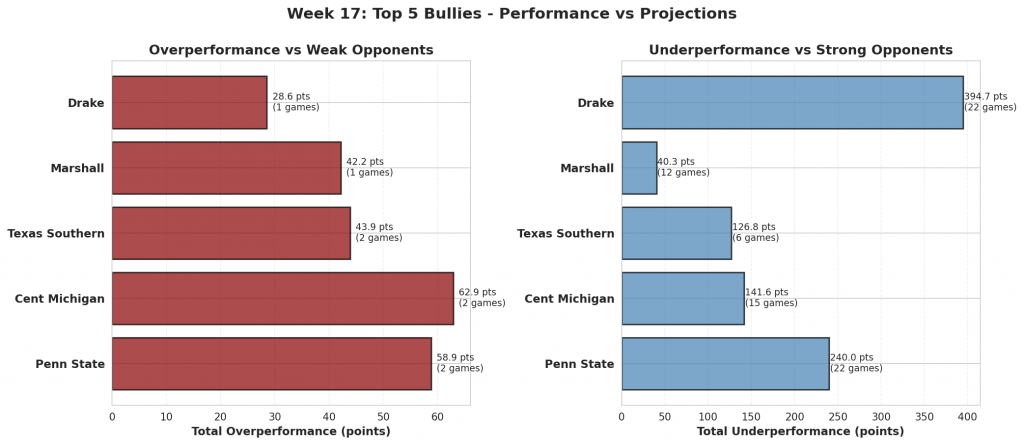
Figure 2: Performance comparison for the top 5 biggest bullies. Red bars show total overperformance against weak opponents; blue bars show total underperformance against strong opponents.
#6: NC State (19-10)
The model gave #24 NC State a 1-point edge over #311 UNC Greensboro. They rolled to a 46-point win, 110-64, finishing 45 beyond the expected margin. Facing #12 Louisville, NC State came up short, losing 118-77 after being projected to lose by 9.
Bully Metrics: Exceeded projections by 107.7 total points against weak opponents (3 games); underperformed by 108.1 points against quality competition (25 games).
#7: Jackson State (9-20)
#362 Jackson State handled #346 Florida A&M, winning 80-60. That 20-point margin was a 14-point swing from the projection. Jackson State fell to #46 TCU 115-64, missing the 9-point projection by 42.
Bully Metrics: Exceeded projections by 13.7 total points against weak opponents (1 games); underperformed by 201.5 points against quality competition (8 games).
#8: Wyoming (16-13)
Facing #233 Denver, #116 Wyoming coasted to a 101-59 win. With a projected spread of 4, the result was 38 points past expectations. The model had Wyoming losing by 15 against #28 Utah State. Instead, they lost 94-62.
Bully Metrics: Exceeded projections by 71.9 total points against weak opponents (2 games); underperformed by 43.7 points against quality competition (18 games).
#9: Wake Forest (15-14)
#61 Wake Forest was projected to beat #225 Campbell by 10. They cruised to a 99-51 victory, 38 points better than projected. Against #17 Vanderbilt, Wake Forest lost 98-67. They were projected to win by 2.
Bully Metrics: Exceeded projections by 91.5 total points against weak opponents (3 games); underperformed by 170.8 points against quality competition (22 games).
#10: S Carolina St (7-21)
Against #343 North Carolina Central, #360 S Carolina St secured a 13-point victory, 85-72. The model had them winning by 1; the actual margin was 13, outpacing the projection by 12. Facing #12 Louisville, S Carolina St came up short, losing 104-45 after being projected to lose by 15.
Bully Metrics: Exceeded projections by 12.2 total points against weak opponents (1 games); underperformed by 180.2 points against quality competition (7 games).
#11: Tulane (17-12)
#207 Tulane faced #344 UTSA as 5-point favorites and won handily 85-52, 28 points above the spread. Tulane fell to #43 Tulsa 90-56, missing the 6-point projection by 40.
Bully Metrics: Exceeded projections by 27.7 total points against weak opponents (1 games); underperformed by 160.3 points against quality competition (17 games).
#12: Marquette (10-19)
Expected to win by 16 over #307 Little Rock, #90 Marquette coasted to a 89-49 win—beating the line by 24. The model had Marquette winning by 6 against #40 Indiana. Instead, they lost 100-77.
Bully Metrics: Exceeded projections by 24.0 total points against weak opponents (1 games); underperformed by 326.2 points against quality competition (25 games).
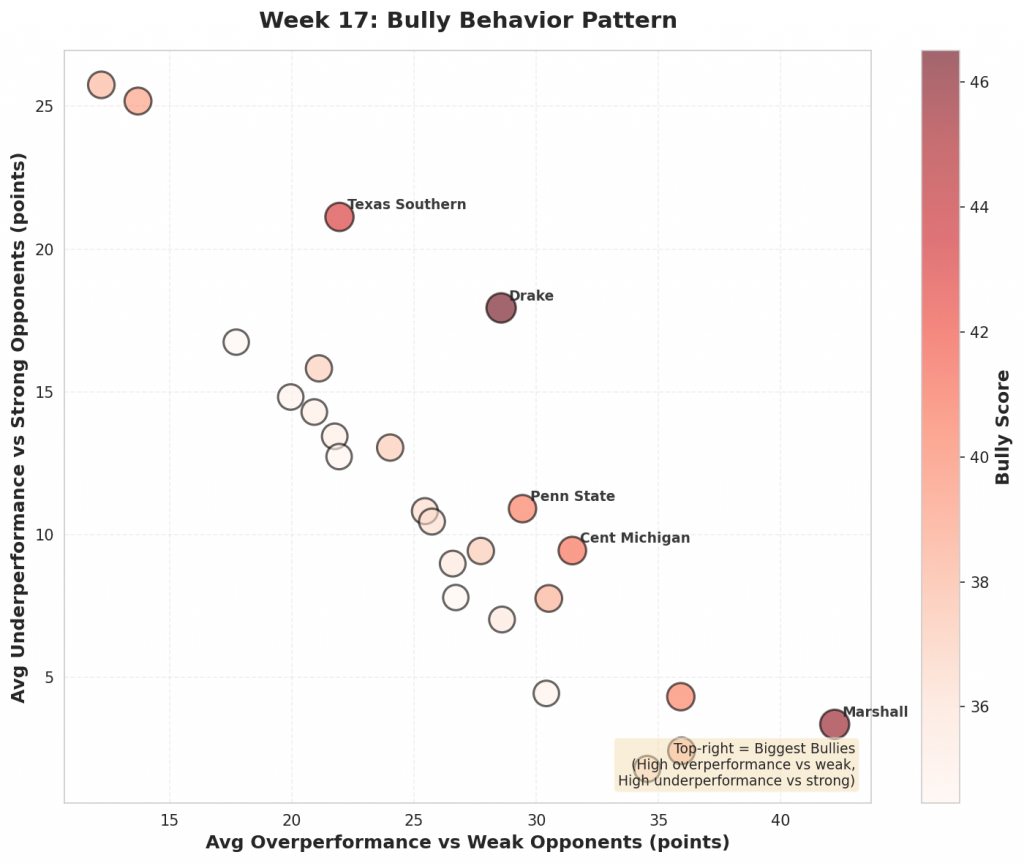
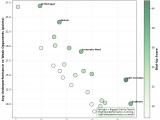
Figure 3: Scatter plot showing the relationship between overperformance against weak opponents (x-axis) and underperformance against strong opponents (y-axis). Bubble size and color indicate bully score magnitude. Top-right quadrant represents the biggest bullies.
#13: Queens University (18-13)
#206 Queens University cruised to a 107-74 victory against #364 Gardner-Webb. Favored by 5, the 33-point margin was +28 versus projection. Against #61 Wake Forest, Queens University lost 111-73. They were projected to lose by 9.
Bully Metrics: Exceeded projections by 105.5 total points against weak opponents (5 games); underperformed by 110.8 points against quality competition (7 games).
#14: TCU (19-10)
The model gave #46 TCU a 9-point edge over #362 Jackson State. They rolled to a 51-point win, 115-64, finishing 42 beyond the expected margin. Facing #96 Colorado, TCU came up short, losing 87-61 after being projected to lose by 0.
Bully Metrics: Exceeded projections by 103.6 total points against weak opponents (3 games); underperformed by 37.7 points against quality competition (21 games).
#15: High Point (27-4)
#84 High Point handled #341 Bryant, winning 93-47. That 46-point margin was a 44-point swing from the projection. High Point fell to #119 UAB 91-74, missing the 2-point projection by 19.
Bully Metrics: Exceeded projections by 152.6 total points against weak opponents (6 games); underperformed by 43.3 points against quality competition (4 games).
#16: Pitt (11-18)
Facing #339 Binghamton, #94 Pitt coasted to a 103-63 win. With a projected spread of 14, the result was 26 points past expectations. The model had Pitt losing by 4 against #12 Louisville. Instead, they lost 100-59.
Bully Metrics: Exceeded projections by 51.5 total points against weak opponents (2 games); underperformed by 261.4 points against quality competition (25 games).
#17: Baylor (15-14)
#70 Baylor was projected to beat #358 Alcorn State by 20. They cruised to a 113-56 victory, 37 points better than projected. Against #117 Kansas State, Baylor lost 90-74. They were projected to win by 6.
Bully Metrics: Exceeded projections by 85.8 total points against weak opponents (3 games); underperformed by 161.6 points against quality competition (23 games).
#18: Ball State (10-19)
Against #312 Northern Illinois, #274 Ball State rolled to a 36-point win, 79-43. The model had them winning by 9; the actual margin was 36, outpacing the projection by 27. Facing #118 Bowling Green, Ball State came up short, losing 77-52 after being projected to lose by 0.
Bully Metrics: Exceeded projections by 26.6 total points against weak opponents (1 games); underperformed by 107.8 points against quality competition (12 games).
#19: Jacksonville (12-19)
#314 Jacksonville faced #306 West Georgia as 10-point favorites and won handily 75-43, 22 points above the spread. Jacksonville fell to #49 Texas A&M 112-75, missing the 13-point projection by 24.
Bully Metrics: Exceeded projections by 41.8 total points against weak opponents (2 games); underperformed by 114.3 points against quality competition (8 games).
#20: Tenn Tech (13-18)
Expected to win by 2 over #306 West Georgia, #322 Tenn Tech took care of business, winning 87-59—beating the line by 26. The model had Tenn Tech losing by 25 against #29 Kentucky. Instead, they lost 104-54.
Bully Metrics: Exceeded projections by 65.2 total points against weak opponents (3 games); underperformed by 53.8 points against quality competition (4 games).
#21: St John’s (23-6)
#15 St John’s cruised to a 97-49 victory against #320 Bucknell. Favored by 18, the 48-point margin was +30 versus projection. Against #6 UConn, St John’s lost 72-40. They were projected to win by 0.
Bully Metrics: Exceeded projections by 30.4 total points against weak opponents (1 games); underperformed by 124.3 points against quality competition (28 games).
#22: Cornell (14-12)
The model gave #144 Cornell a 6-point edge over #320 Bucknell. They pulled away for a 101-72 win, finishing 23 beyond the expected margin. Facing #81 Yale, Cornell came up short, losing 102-68 after being projected to lose by 5.
Bully Metrics: Exceeded projections by 79.8 total points against weak opponents (4 games); underperformed by 148.2 points against quality competition (10 games).
#23: UC Riverside (10-21)
#300 UC Riverside handled #337 Cal State Bakersfield, winning 93-65. That 28-point margin was a 22-point swing from the projection. UC Riverside fell to #115 Hawai’i 88-45, missing the 4-point projection by 47.
Bully Metrics: Exceeded projections by 21.9 total points against weak opponents (1 games); underperformed by 152.8 points against quality competition (12 games).
#24: Presbyterian (14-17)
Facing #364 Gardner-Webb, #266 Presbyterian coasted to a 92-55 win. With a projected spread of 1, the result was 36 points past expectations. The model had Presbyterian losing by 19 against #42 UCLA. Instead, they lost 86-46.
Bully Metrics: Exceeded projections by 53.4 total points against weak opponents (2 games); underperformed by 54.6 points against quality competition (7 games).
#25: Norfolk State (15-14)
#287 Norfolk State was projected to beat #360 South Carolina State by 1. They won 90-71, 18 points better than projected. Against #162 Howard, Norfolk State lost 88-60. They were projected to win by 9.
Bully Metrics: Exceeded projections by 17.7 total points against weak opponents (1 games); underperformed by 100.4 points against quality competition (6 games).
HoopSci Alert: Be Aware of Aggressive Teams’ Biased Efficiency Numbers
When evaluating college basketball teams, it’s essential to consider more than just their efficiency numbers. Recent rankings highlight a peculiar phenomenon where certain teams consistently outperform statistical projections versus weaker competition while underperforming versus stronger teams. This disparity suggests that their metrics may be artificially inflated.
Understanding Aggressive Teams
These teams are characterized by their aggressive playing style and refusal to let up, even when ahead by a substantial margin. Against weaker opponents, they often dominate the game from start to finish, leading to overinflated efficiency numbers versus weaker competition. For instance, against weaker competition, Drake consistently outperforms statistical projections by an average of 10 points per game.
Strategies for Dealing with Aggressive Teams
When facing these teams, consider the following strategies:
- Against Weaker Competition: Be cautious not to overvalue aggressive teams when they face quality opponents. For example, Marshall struggles versus stronger competition, often losing by an average of 8 points per game.
- Versus Stronger Competition: When evaluating aggressive teams’ efficiency numbers, consider their performance versus both weaker and stronger opponents. By doing so, you can make more informed decisions and avoid overvaluing these teams when they face quality competition.
Example Usage
Consider a scenario where Texas Southern consistently covers spreads versus weaker teams but struggles versus top-ranked teams, often losing by an average of 8 points per game. In this case, bettors should be aware of the potential for a letdown when facing quality competition.
Key Takeaway
When evaluating aggressive teams’ efficiency numbers, consider their performance versus both weaker and stronger opponents. By doing so, you can make more informed decisions and avoid overvaluing these teams when they face quality competition.
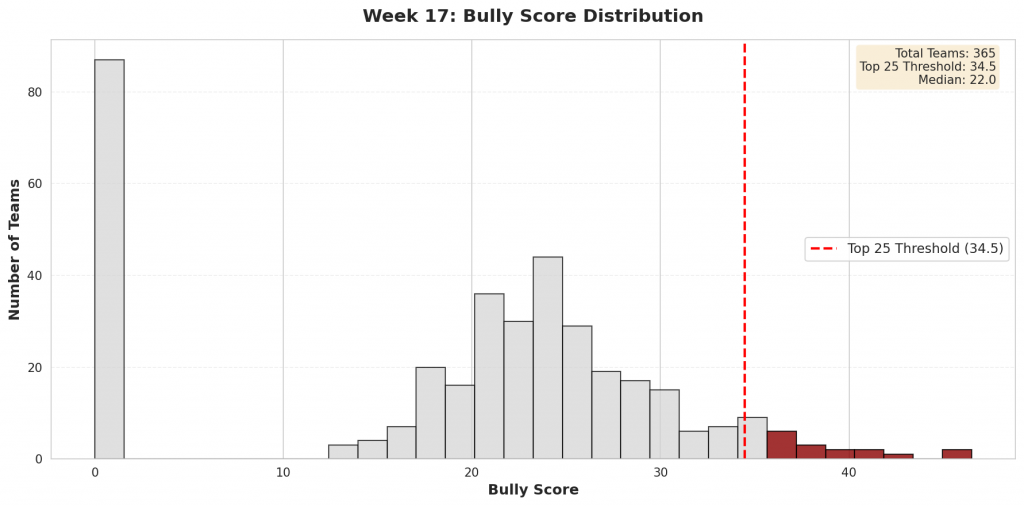
Figure 4: Distribution of bully scores across all Division I teams. The top 25 bullies (highlighted in red) represent teams whose efficiency metrics are most inflated by their performance patterns.
Check back next week for updated bully rankings.