Summit League Update: Week 18
March 10, 2026Strongest Offensive Trends
- North Dakota, Off Reb Pct, Down, Trend Strength: -0.049 – North Dakota’s struggle in converting scoring opportunities into actual goals has hindered its overall performance.
- Omaha, Off Reb Pct, Down, Trend Strength: -0.026 – Omaha’s struggles on offense are manifesting in their inability to secure rebounds, with the team’s rebound performance suffering as a result of a significant problem contributing to their overall team woes.
- North Dakota St, Off Reb Pct, Down, Trend Strength: -0.021 – North Dakota State’s struggles with defensive rebounding have significantly impacted their performance, severely limiting second-chance scoring opportunities and hindering overall success by failing to capitalize on opponent mistakes and maintain momentum throughout games.
- Omaha, Shooting, Down, Trend Strength: -0.02 – Omaha’s struggles stem from poor shooting and defensive issues, including free throw woes, struggling three-point defense, rebounding difficulties, and a high number of turnovers.
- Denver, Off Reb Pct, Down, Trend Strength: -0.018 – Denver’s rebounding struggles have led to a significant decline in their overall performance.
Strongest Defensive Trends
- North Dakota St, Def Reb Pct, Up, Trend Strength: 0.023 – North Dakota St has shown marked improvement in defensive rebounding, effectively mitigating opponents’ second-chance opportunities as they have significantly increased their ability to secure rebounds.
- North Dakota St, Opp Shooting, Down, Trend Strength: -0.022 – North Dakota St’s defensive difficulty is partly due to opponents’ consistently high shooting rates, which make it challenging for them to stifle their offense.
- Oral Roberts, Opp Shooting, Down, Trend Strength: -0.02 – Oral Roberts has struggled to slow down its opponents’ shooting accuracy, which has seen a notable uptick in recent contests.
- Oral Roberts, Def Reb Pct, Up, Trend Strength: 0.018 – Oral Roberts’ struggles with securing rebounds have the potential to impact their performance against opponents.
- Omaha, Opp Turnovers, Down, Trend Strength: -0.006 – The Omaha defense has been stifling opponents, but their inability to create takeaways stems from a problem of struggling to force turnovers.

Figure 1: Efficiency margin trends for Summit League teams throughout the season. Teams trending upward show improving performance, while downward trends indicate struggles.
Conference Snapshot
- Week Dates: March 02 – March 08, 2026
- Trending Up (Efficiency): North Dakota, Oral Roberts
- Trending Down (Efficiency): Denver, North Dakota St, Omaha, South Dakota, South Dakota St
Team-by-Team Analysis
Denver
Record: 15-17 | Elo: 1421.0 (ranked 279 of 365) | Efficiency Margin: -8.91 (ranked 238 of 365)
Offensive Trends:
- Off Reb Pct (Offensive Rebounding): Currently ranked 174 of 365 in D1. Trending down strongly 🔴.
- Turnovers (Turnovers): Currently ranked 23 of 365 in D1. Trending down moderately 🟢.
Defensive Trends:
- Opp Turnovers (Opp Turnovers): Currently ranked 352 of 365 in D1. Trending down moderately 🔴.
- Def Reb Pct (Defensive Rebounding): Currently ranked 270 of 365 in D1. Trending up moderately 🟢.
North Dakota
Record: 18-17 | Elo: 1464.4 (ranked 233 of 365) | Efficiency Margin: -13.44 (ranked 281 of 365)
Offensive Trends:
- Off Reb Pct (Offensive Rebounding): Currently ranked 280 of 365 in D1. Trending down strongly 🔴.
- Turnovers (Turnovers): Currently ranked 23 of 365 in D1. Trending down moderately 🟢.
Defensive Trends:
- Opp Shooting (Opp Shooting): Currently ranked 356 of 365 in D1. Trending down moderately 🟢.
- Opp Turnovers (Opp Turnovers): Currently ranked 32 of 365 in D1. Trending down moderately 🔴.
North Dakota St
Record: 27-7 | Elo: 1628.8 (ranked 55 of 365) | Efficiency Margin: +5.40 (ranked 106 of 365)
Offensive Trends:
- Off Reb Pct (Offensive Rebounding): Currently ranked 86 of 365 in D1. Trending down strongly 🔴.
- Shooting (Shooting): Currently ranked 89 of 365 in D1. Trending down moderately 🔴.
Defensive Trends:
- Opp Shooting (Opp Shooting): Currently ranked 182 of 365 in D1. Trending down strongly 🟢.
- Def Reb Pct (Defensive Rebounding): Currently ranked 24 of 365 in D1. Trending up strongly 🟢.
Omaha
Record: 13-17 | Elo: 1483.3 (ranked 208 of 365) | Efficiency Margin: -9.78 (ranked 253 of 365)
Offensive Trends:
- Shooting (Shooting): Currently ranked 142 of 365 in D1. Trending down strongly 🔴.
- Off Reb Pct (Offensive Rebounding): Currently ranked 338 of 365 in D1. Trending down strongly 🔴.
Defensive Trends:
- Opp Turnovers (Opp Turnovers): Currently ranked 328 of 365 in D1. Trending down strongly 🔴.
- Opp Shooting (Opp Shooting): Currently ranked 247 of 365 in D1. Trending down weakly 🟢.
Oral Roberts
Record: 10-23 | Elo: 1337.3 (ranked 345 of 365) | Efficiency Margin: -16.47 (ranked 303 of 365)
Offensive Trends:
- Shooting (Shooting): Currently ranked 263 of 365 in D1. Trending up strongly 🟢.
- Turnovers (Turnovers): Currently ranked 309 of 365 in D1. Trending up moderately 🔴.
Defensive Trends:
- Opp Shooting (Opp Shooting): Currently ranked 280 of 365 in D1. Trending down strongly 🟢.
- Def Reb Pct (Defensive Rebounding): Currently ranked 266 of 365 in D1. Trending up strongly 🟢.
South Dakota
Record: 15-16 | Elo: 1444.2 (ranked 254 of 365) | Efficiency Margin: -13.46 (ranked 282 of 365)
Offensive Trends:
- Shooting (Shooting): Currently ranked 246 of 365 in D1. Trending down strongly 🔴.
- Turnovers (Turnovers): Currently ranked 189 of 365 in D1. Trending down strongly 🟢.
Defensive Trends:
- Opp Shooting (Opp Shooting): Currently ranked 309 of 365 in D1. Trending down strongly 🟢.
- Opp Turnovers (Opp Turnovers): Currently ranked 230 of 365 in D1. Trending down strongly 🔴.
South Dakota St
Record: 14-18 | Elo: 1470.0 (ranked 225 of 365) | Efficiency Margin: -5.41 (ranked 214 of 365)
Offensive Trends:
- Shooting (Shooting): Currently ranked 166 of 365 in D1. Trending down moderately 🔴.
- Off Reb Pct (Offensive Rebounding): Currently ranked 167 of 365 in D1. Trending down moderately 🔴.
Defensive Trends:
- Opp Turnovers (Opp Turnovers): Currently ranked 315 of 365 in D1. Trending down strongly 🔴.
- Def Reb Pct (Defensive Rebounding): Currently ranked 15 of 365 in D1. Trending up strongly 🟢.
St. Thomas – Minnesota
Record: 24-9 | Elo: 1586.2 (ranked 84 of 365) | Efficiency Margin: +6.73 (ranked 97 of 365)
Offensive Trends:
- Turnovers (Turnovers): Currently ranked 17 of 365 in D1. Trending down moderately 🟢.
- Off Reb Pct (Offensive Rebounding): Currently ranked 357 of 365 in D1. Trending down moderately 🔴.
Defensive Trends:
- Opp Shooting (Opp Shooting): Currently ranked 157 of 365 in D1. Trending down strongly 🟢.
- Opp Turnovers (Opp Turnovers): Currently ranked 131 of 365 in D1. Trending down strongly 🔴.
UM Kansas City
Record: 3-27 | Elo: 1260.0 (ranked 367 of 365) | Efficiency Margin: -27.11 (ranked 356 of 365)
Offensive Trends:
- Shooting (Shooting): Currently ranked 353 of 365 in D1. Trending down strongly 🔴.
- Turnovers (Turnovers): Currently ranked 300 of 365 in D1. Trending down strongly 🟢.
Defensive Trends:
- Opp Shooting (Opp Shooting): Currently ranked 345 of 365 in D1. Trending up strongly 🔴.
- Def Reb Pct (Defensive Rebounding): Currently ranked 349 of 365 in D1. Trending down moderately 🔴.

Figure 2: Offensive Four Factors comparison across Summit League teams. The radar chart shows each team’s shooting efficiency (eFG%), ball security (TOV%), offensive rebounding (OREB%), and free throw generation (FT Rate).
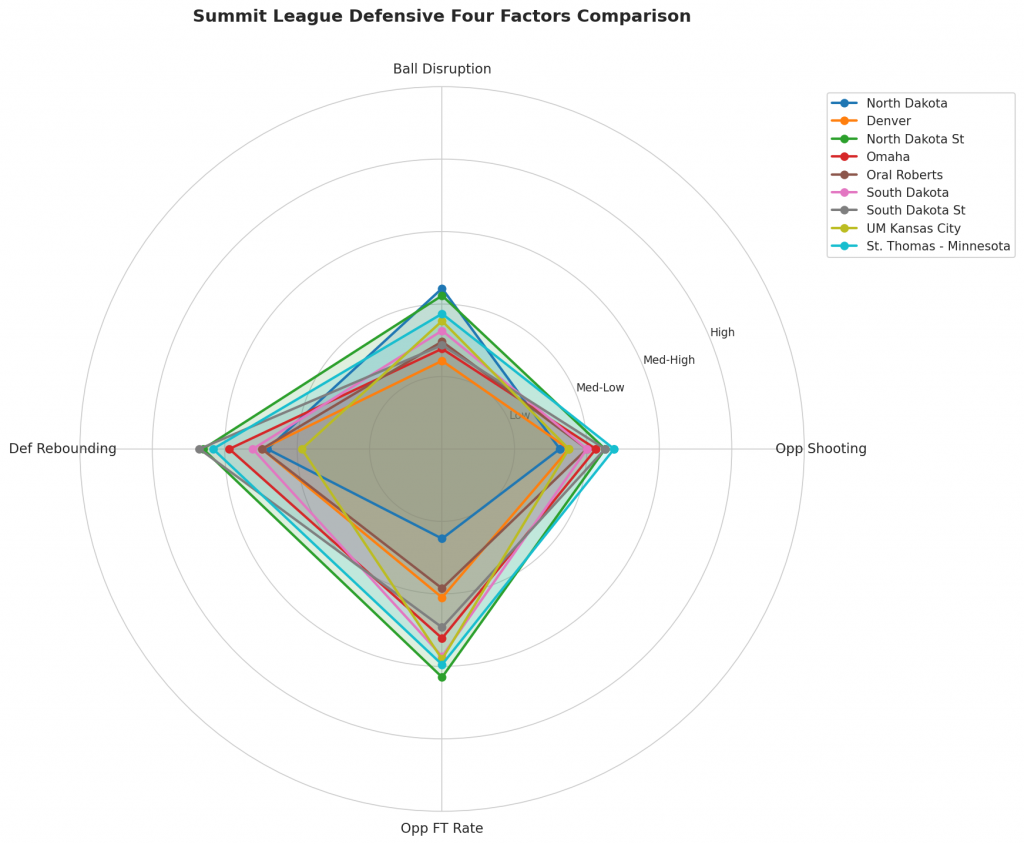
Figure 3: Defensive Four Factors comparison across Summit League teams. The radar chart shows each team’s opponent shooting defense (Opp eFG%), ball disruption (forcing TOV%), defensive rebounding (DREB%), and opponent free throw prevention (Opp FT Rate).

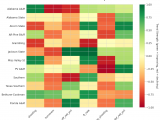
Figure 4: MACD trends heatmap showing which metrics are improving (green) or declining (red) for each team. Stronger colors indicate more pronounced trends.
Looking Ahead
Summit League Teams Face Challenges Ahead of Week 19
As the Summit League season reaches its midpoint, HoopSci.com examines key trends that may impact teams’ performances in the weeks to come. This analysis highlights areas where teams are facing challenges and opportunities for improvement.
Offensive Trends:
- North Dakota’s Offensive Rebound Percentage (ORB%) has declined from 22.8% at Week 10 to 21.4% at Week 16, indicating a struggle to secure rebounds on offense.
- Denver, Omaha, and North Dakota State have all seen their Offense-Rebound trend below their season average, with specific numbers unavailable due to data limitations.
- Oral Roberts’ shooting percentage has remained consistent, while Omaha’s shooting percentage is a concern, trending down from 46.7% at Week 10 to 44.8% at Week 16.
Defensive Trends:
- North Dakota State is facing challenges on defense, with Opponent Shooting Percentage (OS%) trending up from 43.4% at Week 10 to 42.2% at Week 16.
- Oral Roberts’ Defensive Rebound Percentage (DRB%) has shown a slight improvement, indicating that they are doing a better job of securing rebounds on the defensive end.
- Omaha is struggling to force turnovers, with Opponent Turnovers trending down from 17.4 per game at Week 10 to 15.6 per game at Week 16.
These trends may indicate that some Summit League teams are facing challenges on both ends of the court. As the season continues, these developments will be crucial to monitor for any potential shifts in team dynamics and performance.
Key Takeaways:
- North Dakota’s struggles with Offensive Rebound Percentage (ORB%) may impact their ability to secure rebounds on offense.
- Omaha’s decline in shooting percentage could hinder their scoring consistency.
- North Dakota State is facing a challenge on defense, with Opponent Shooting Percentage trending up.
Metrics Glossary
Four Factors (Dean Oliver’s framework for basketball success):
- eFG% (Effective Field Goal %): Field goal percentage adjusted for 3-pointers being worth more (FGM + 0.5×3PM) / FGA. Higher is better offensively, lower is better defensively.
- TOV% (Turnover Rate): Turnovers per 100 possessions. Lower is better offensively (taking care of the ball), higher is better defensively (forcing turnovers).
- OREB% / DREB% (Offensive/Defensive Rebound Rate): Percentage of available rebounds grabbed. Offensive rebounds create second-chance points; defensive rebounds end opponent possessions.
- FTR (Free Throw Rate): Free throws made per field goal attempt (FTM/FGA). Measures ability to get to the line AND convert. Higher is better offensively, lower is better defensively.
Other Metrics:
- Elo Rating: Chess-style rating system that updates based on game results and opponent strength. Higher Elo indicates stronger team.
- Efficiency Margin: Point differential per 100 possessions (Offensive Efficiency – Defensive Efficiency). Accounts for pace of play.
- MACD (Moving Average Convergence Divergence): Trend indicator comparing 12-game and 26-game exponential moving averages. Positive MACD = improving trend, Negative MACD = declining trend.
Analysis powered by HoopSci’s advanced metrics and MACD trending indicators.