Week 18: 2026’s Biggest Bullies
March 10, 2026The Performance of Marshall, Drake, and Texas Southern
As we approach the end of Week 18 in Division I basketball, several teams are standing out for reasons beyond their on-court performance. According to our analysis, Marshall, Drake, and Texas Southern have notable trends that warrant closer examination.
Marshall has significantly outperformed expectations by +42.2 points versus weaker competition. However, this trend reverses when facing stronger competition, with the team underperforming by -40.3 points, indicating a struggle in sustaining its level of play against top-notch opponents.
Drake outperformed expectations by +28.6 points versus weaker competition, but underperformed by -408.1 points versus stronger competition, suggesting that the team’s advantages disappear when facing quality opponents. This trend presents a notable problem for Drake as it attempts to close the gap between its numbers against weaker and stronger competition.
Texas Southern has also demonstrated an ability to dominate weaker teams, outperforming expectations by +43.9 points versus weaker competition. Yet, when facing top-notch opponents, the team consistently underperforms by -126.8 points versus stronger competition, which presents a notable problem in terms of closing the gap between its numbers versus weaker and stronger competition.
These trends raise questions about these teams’ true abilities and whether they can sustain a high level of play against quality competition. As the season winds down, we will continue to monitor their performance and see if they can close the gap between their numbers versus weaker and stronger competition.
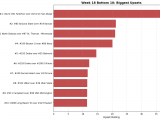
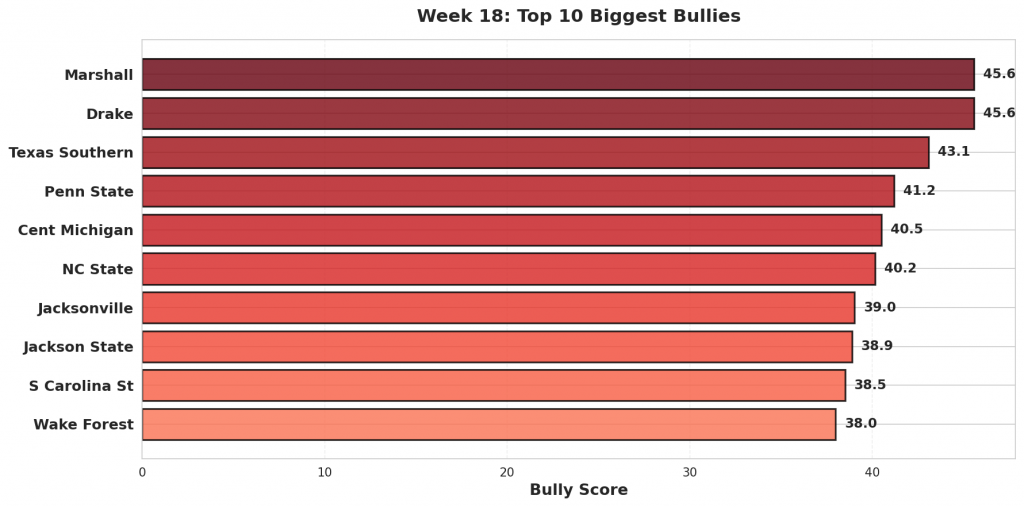
Figure 1: Top 10 teams with the highest bully scores in Week 18. Bully scores reflect the combination of overperformance against weak opponents and underperformance against quality competition.
#1: Marshall (19-13)
#160 Marshall was projected to beat #348 UL Monroe by 13. They cruised to a 115-60 victory, 42 points better than projected. Against #11 Virginia, Marshall lost 104-78. They were projected to lose by 3.
Bully Metrics: Exceeded projections by 42.2 total points against weak opponents (1 games); underperformed by 40.3 points against quality competition (12 games).
#2: Drake (14-20)
Against #363 Western Illinois, #196 Drake rolled to a 51-point win, 108-57. The model had them winning by 22; the actual margin was 51, outpacing the projection by 29. Facing #106 Bradley, Drake came up short, losing 93-66 after being projected to win by 5.
Bully Metrics: Exceeded projections by 28.6 total points against weak opponents (1 games); underperformed by 408.1 points against quality competition (24 games).
#3: Texas Southern (12-17)
#337 Texas Southern faced #334 Alabama State as 0-point favorites and won handily 96-64, 32 points above the spread. Texas Southern fell to #8 Gonzaga 98-43, missing the 27-point projection by 28.
Bully Metrics: Exceeded projections by 43.9 total points against weak opponents (2 games); underperformed by 126.8 points against quality competition (6 games).
#4: Penn State (12-19)
Expected to win by 6 over #310 New Haven, #166 Penn State coasted to a 87-43 win—beating the line by 38. The model had Penn State losing by 1 against #39 Indiana. Instead, they lost 113-72.
Bully Metrics: Exceeded projections by 58.9 total points against weak opponents (2 games); underperformed by 282.5 points against quality competition (24 games).
#5: Cent Michigan (10-21)
#235 Cent Michigan cruised to a 100-65 victory against #199 Eastern Michigan. Favored by 3, the 35-point margin was +32 versus projection. Against #25 Saint Louis, Cent Michigan lost 107-65. They were projected to lose by 6.
Bully Metrics: Exceeded projections by 62.9 total points against weak opponents (2 games); underperformed by 144.4 points against quality competition (16 games).
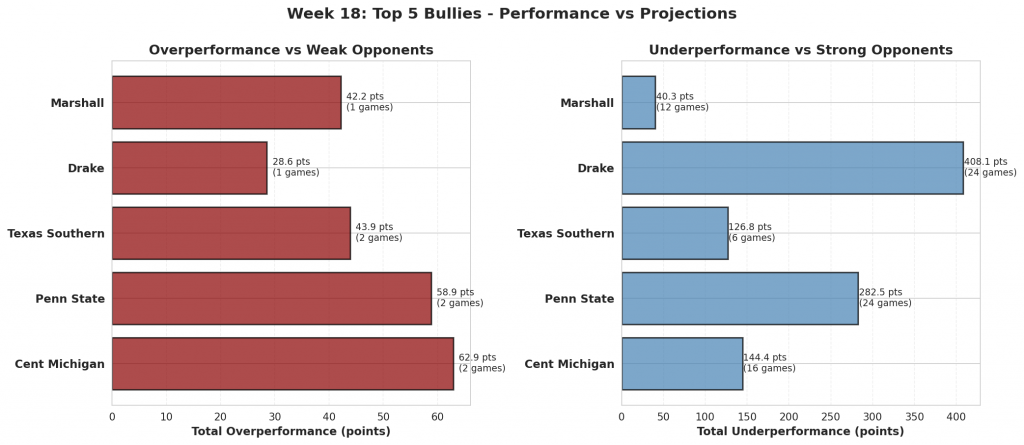
Figure 2: Performance comparison for the top 5 biggest bullies. Red bars show total overperformance against weak opponents; blue bars show total underperformance against strong opponents.
#6: NC State (19-12)
The model gave #26 NC State a 1-point edge over #299 UNC Greensboro. They rolled to a 46-point win, 110-64, finishing 45 beyond the expected margin. Facing #9 Louisville, NC State came up short, losing 118-77 after being projected to lose by 9.
Bully Metrics: Exceeded projections by 107.7 total points against weak opponents (3 games); underperformed by 114.8 points against quality competition (27 games).
#7: Jacksonville (12-20)
#316 Jacksonville handled #308 West Georgia, winning 75-43. That 32-point margin was a 22-point swing from the projection. Jacksonville fell to #183 Florida International 88-65, missing the 5-point projection by 28.
Bully Metrics: Exceeded projections by 41.8 total points against weak opponents (2 games); underperformed by 126.8 points against quality competition (7 games).
#8: Jackson State (11-20)
Facing #344 Florida A&M, #362 Jackson State took care of business, winning 80-60. With a projected spread of 6, the result was 14 points past expectations. The model had Jackson State losing by 9 against #44 TCU. Instead, they lost 115-64.
Bully Metrics: Exceeded projections by 13.7 total points against weak opponents (1 games); underperformed by 201.5 points against quality competition (8 games).
#9: S Carolina St (9-21)
#359 S Carolina St was projected to beat #345 North Carolina Central by 1. They won 85-72, 12 points better than projected. Against #9 Louisville, S Carolina St lost 104-45. They were projected to lose by 15.
Bully Metrics: Exceeded projections by 12.2 total points against weak opponents (1 games); underperformed by 157.9 points against quality competition (6 games).
#10: Wake Forest (16-15)
Against #211 Campbell, #59 Wake Forest rolled to a 48-point win, 99-51. The model had them winning by 10; the actual margin was 48, outpacing the projection by 38. Facing #17 Vanderbilt, Wake Forest came up short, losing 98-67 after being projected to win by 2.
Bully Metrics: Exceeded projections by 91.5 total points against weak opponents (3 games); underperformed by 179.6 points against quality competition (24 games).
#11: Tulane (17-14)
#214 Tulane faced #346 UTSA as 5-point favorites and won handily 85-52, 28 points above the spread. Tulane fell to #43 Tulsa 90-56, missing the 6-point projection by 40.
Bully Metrics: Exceeded projections by 27.7 total points against weak opponents (1 games); underperformed by 189.5 points against quality competition (19 games).
#12: Queens University (21-13)
Expected to win by 5 over #364 Gardner-Webb, #205 Queens University coasted to a 107-74 win—beating the line by 28. The model had Queens University losing by 9 against #59 Wake Forest. Instead, they lost 111-73.
Bully Metrics: Exceeded projections by 105.5 total points against weak opponents (5 games); underperformed by 97.4 points against quality competition (6 games).
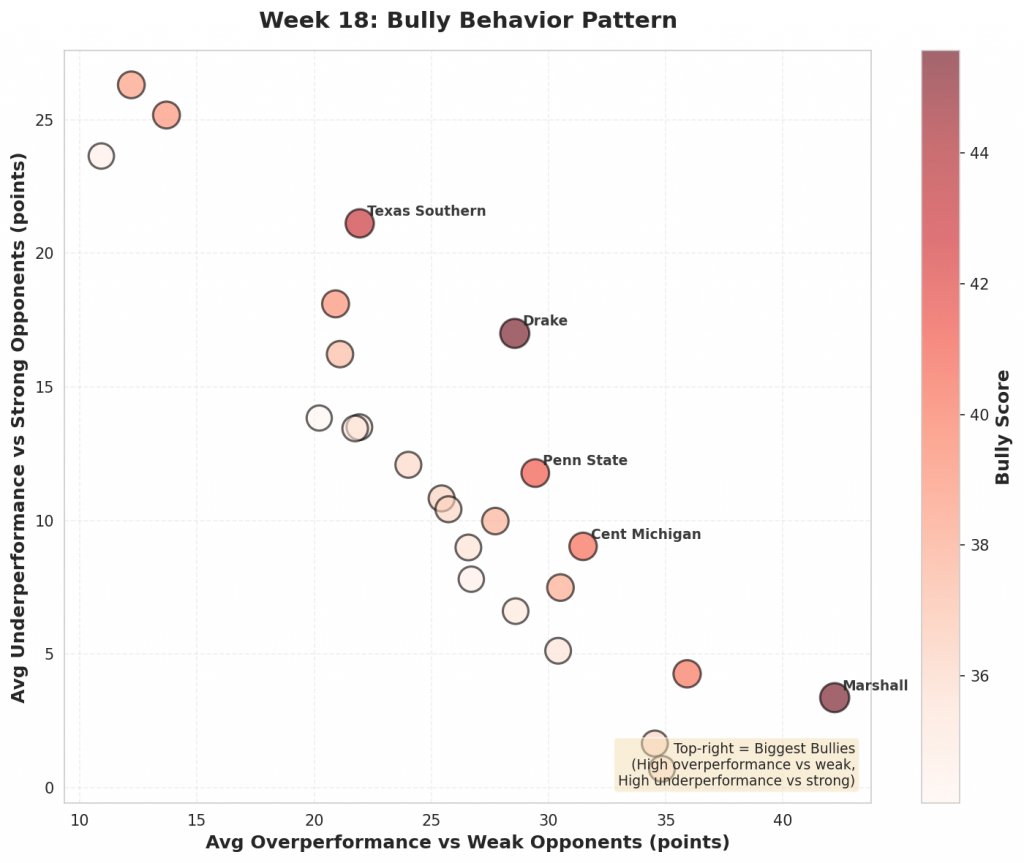
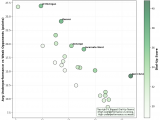
Figure 3: Scatter plot showing the relationship between overperformance against weak opponents (x-axis) and underperformance against strong opponents (y-axis). Bubble size and color indicate bully score magnitude. Top-right quadrant represents the biggest bullies.
#13: High Point (30-4)
#82 High Point cruised to a 93-47 victory against #340 Bryant. Favored by 2, the 46-point margin was +44 versus projection. Against #116 UAB, High Point lost 91-74. They were projected to win by 2.
Bully Metrics: Exceeded projections by 152.6 total points against weak opponents (6 games); underperformed by 43.3 points against quality competition (4 games).
#14: TCU (21-10)
The model gave #44 TCU a 9-point edge over #362 Jackson State. They rolled to a 51-point win, 115-64, finishing 42 beyond the expected margin. Facing #90 Colorado, TCU came up short, losing 87-61 after being projected to lose by 0.
Bully Metrics: Exceeded projections by 103.6 total points against weak opponents (3 games); underperformed by 37.7 points against quality competition (23 games).
#15: Pitt (12-19)
#92 Pitt handled #339 Binghamton, winning 103-63. That 40-point margin was a 26-point swing from the projection. Pitt fell to #9 Louisville 100-59, missing the 4-point projection by 37.
Bully Metrics: Exceeded projections by 51.5 total points against weak opponents (2 games); underperformed by 270.8 points against quality competition (26 games).
#16: Marquette (12-19)
Facing #312 Little Rock, #80 Marquette coasted to a 89-49 win. With a projected spread of 16, the result was 24 points past expectations. The model had Marquette winning by 6 against #39 Indiana. Instead, they lost 100-77.
Bully Metrics: Exceeded projections by 24.0 total points against weak opponents (1 games); underperformed by 326.2 points against quality competition (27 games).
#17: Ball State (12-19)
#260 Ball State was projected to beat #325 Northern Illinois by 9. They cruised to a 79-43 victory, 27 points better than projected. Against #119 Bowling Green, Ball State lost 77-52. They were projected to lose by 0.
Bully Metrics: Exceeded projections by 26.6 total points against weak opponents (1 games); underperformed by 107.8 points against quality competition (12 games).
#18: Michigan (29-2)
Against #248 La Salle, #2 Michigan rolled to a 52-point win, 102-50. The model had them winning by 17; the actual margin was 52, outpacing the projection by 35. Michigan beat #44 TCU 67-63, though the 4-point margin was 6 below the projected spread.
Bully Metrics: Exceeded projections by 34.8 total points against weak opponents (1 games); underperformed by 20.7 points against quality competition (30 games).
#19: St John’s (25-6)
#14 St John’s faced #313 Bucknell as 18-point favorites and won handily 97-49, 30 points above the spread. St John’s fell to #7 UConn 72-40, missing the 0-point projection by 32.
Bully Metrics: Exceeded projections by 30.4 total points against weak opponents (1 games); underperformed by 148.4 points against quality competition (29 games).
#20: UC Riverside (10-22)
Expected to win by 6 over #338 Cal State Bakersfield, #306 UC Riverside took care of business, winning 93-65—beating the line by 22. The model had UC Riverside winning by 4 against #121 Hawai’i. Instead, they lost 88-45.
Bully Metrics: Exceeded projections by 21.9 total points against weak opponents (1 games); underperformed by 175.4 points against quality competition (13 games).
#21: Baylor (16-15)
#63 Baylor cruised to a 113-56 victory against #358 Alcorn State. Favored by 20, the 57-point margin was +37 versus projection. Against #113 Kansas State, Baylor lost 90-74. They were projected to win by 6.
Bully Metrics: Exceeded projections by 85.8 total points against weak opponents (3 games); underperformed by 165.0 points against quality competition (25 games).
#22: Tenn Tech (13-18)
The model gave #320 Tenn Tech a 2-point edge over #308 West Georgia. They pulled away for a 87-59 win, finishing 26 beyond the expected margin. Facing #33 Kentucky, Tenn Tech came up short, losing 104-54 after being projected to lose by 25.
Bully Metrics: Exceeded projections by 65.2 total points against weak opponents (3 games); underperformed by 53.8 points against quality competition (4 games).
#23: UNCG (15-19)
#299 UNCG handled #356 VMI, winning 92-71. That 21-point margin was a 11-point swing from the projection. UNCG fell to #26 NC State 110-64, missing the 1-point projection by 45.
Bully Metrics: Exceeded projections by 10.9 total points against weak opponents (1 games); underperformed by 165.5 points against quality competition (7 games).
#24: Presbyterian (15-18)
Facing #364 Gardner-Webb, #263 Presbyterian coasted to a 92-55 win. With a projected spread of 1, the result was 36 points past expectations. The model had Presbyterian losing by 19 against #37 UCLA. Instead, they lost 86-46.
Bully Metrics: Exceeded projections by 53.4 total points against weak opponents (2 games); underperformed by 54.6 points against quality competition (7 games).
#25: Lindenwood (18-15)
#265 Lindenwood was projected to beat #325 Northern Illinois by 3. They cruised to a 99-64 victory, 32 points better than projected. Against #25 Saint Louis, Lindenwood lost 109-66. They were projected to lose by 13.
Bully Metrics: Exceeded projections by 80.9 total points against weak opponents (4 games); underperformed by 41.5 points against quality competition (3 games).
The Fading Phenomenon: Unpacking the Numbers Behind Bully Teams
College basketball’s efficiency metrics can sometimes be misleading. A recent analysis highlights a group of teams whose numbers may not accurately reflect their true strengths and weaknesses. These teams, which we’ll refer to as “bully” teams, consistently dominate inferior opponents while underperforming against quality competition.
The Bully Profile
When analyzing these teams’ metrics, several key trends emerge:
- Efficiency Inflation: Versus weaker competition, bully teams tend to have artificially inflated efficiency numbers due to their ability to crush inferior opponents efficiently. For instance, Marshall’s performance versus weaker teams is marked by an average of 92 points per game.
- Spread Covering: They are often safe bets to cover large spreads against inferior competition, as they maintain a high level of intensity and effort regardless of the score.
The Pitfall of Overvaluation
However, this trend reverses when bully teams face stronger opponents. Their inflated metrics lead to them being overvalued favorites in these matchups, which can result in underwhelming performances. For example, Drake’s performance versus stronger competition is marked by a struggle to maintain its efficiency numbers.
Actionable Advice for Betting on Bully Teams
When dealing with bully teams, consider the following strategies:
- Safe Bets vs Weak Teams: Back bully teams against inferior opponents when large spreads are involved. Their ability to maintain a high level of intensity will likely lead to them covering the spread.
- Fade vs Strong Teams: Be cautious backing bully teams as favorites in games versus stronger competition, as their inflated metrics may lead to overvaluation.
Example Applications
For instance, Texas Southern’s track record of dominating weaker opponents while underperforming versus stronger teams suggests that they are a team to approach with caution when betting on them as favorites in high-profile matchups. Conversely, when facing inferior teams, they become a more attractive option, given their ability to maintain intensity and cover large spreads.
By understanding the characteristics and limitations of bully teams, bettors can make more informed decisions when placing wagers in college basketball.
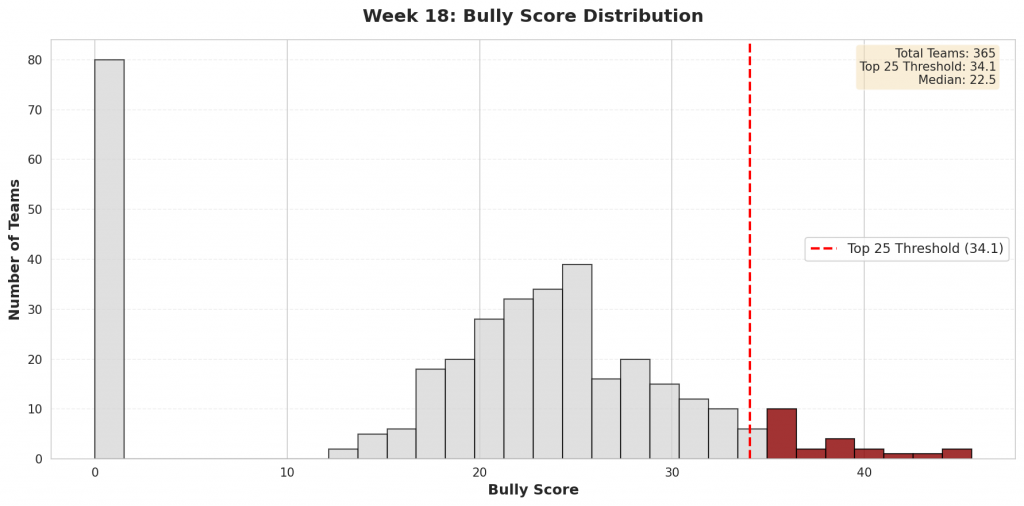
Figure 4: Distribution of bully scores across all Division I teams. The top 25 bullies (highlighted in red) represent teams whose efficiency metrics are most inflated by their performance patterns.
Check back next week for updated bully rankings.