Horizon Update: Week 2
November 16, 2026Strongest Offensive Trends
- Green Bay, Off Reb Pct, Up, Trend Strength: 0.086 – Green Bay has shown an upward trajectory in its performance relative to rebounds distributed by opponents, suggesting a growing defensive impact as the season progresses.
- Detroit Mercy, Off Reb Pct, Down, Trend Strength: -0.026 – Detroit Mercy faces a growing concern regarding its rebounding performance, where a downward shift in winning rebounds per game suggests the team is struggling to secure second-chance opportunities, which contributes to broader challenges in maintaining offensive momentum and controlling the pace of play.
- Detroit Mercy, Shooting, Down, Trend Strength: -0.025 – Detroit Mercy’s enduring inability to connect with its targets has significantly hampered their offensive output, turning what should be a vital scoring engine into a persistent liability throughout the season.
- Cleveland State, Off Reb Pct, Up, Trend Strength: 0.021 – Cleveland State is showing encouraging signs of improvement in its rebounding performance through the second week, with a rising trend that suggests the program may be gaining an edge on the glass as the season progresses.
- IUPUI, Turnovers, Down, Trend Strength: -0.01 – IUPUI has shown measurable improvement in reducing turnovers, a positive development that supports better ball security during their season games so far.
Strongest Defensive Trends
- Oakland, Opp Shooting, Up, Trend Strength: 0.03 – Oakland faces a troubling trajectory as their opponents are capitalizing with greater efficiency on the offensive end, signaling a concerning inability to suppress enemy scoring.
- Cleveland State, Def Reb Pct, Up, Trend Strength: 0.025 – Cleveland State is demonstrating improved control over defensive rebounds, effectively limiting opponents’ second-chance opportunities while securing more possession for their own team.
- N Kentucky, Def Reb Pct, Down, Trend Strength: -0.013 – N Kentucky’s persistent difficulty in securing defensive rebounds continues to undermine their defensive integrity by granting opponents extended possessions and carving open lanes for drives toward the basket.
- Cleveland State, Opp Turnovers, Down, Trend Strength: -0.009 – Cleveland State is struggling to generate defensive pressure as their ability to force opponent turnovers has declined over the course of the season.
- N Kentucky, Opp Turnovers, Down, Trend Strength: -0.008 – N Kentucky’s defensive showing has struggled to keep opponents on their heels, marking a troubling slide in forced turnover production that threatens to hamper their momentum as the season unfolds.
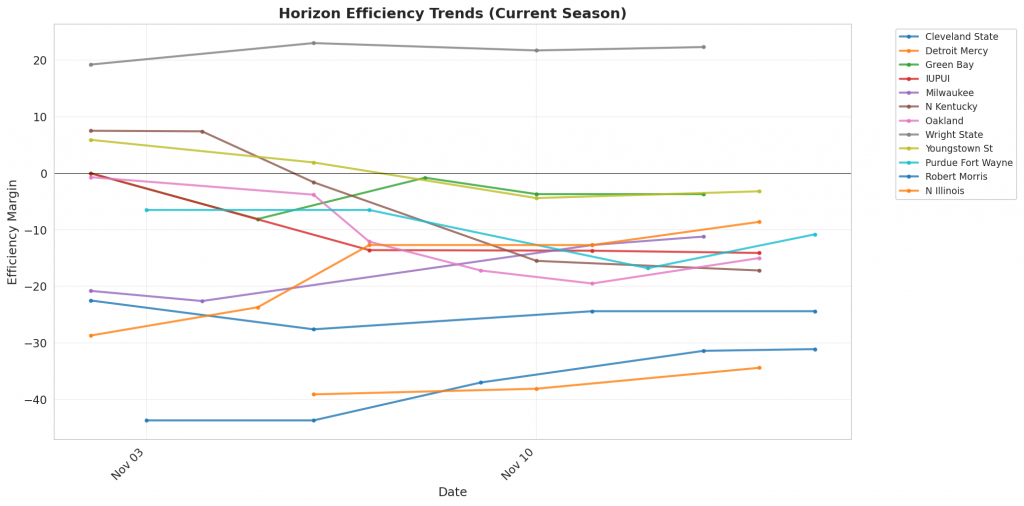
Figure 1: Efficiency margin trends for Horizon teams throughout the season. Teams trending upward show improving performance, while downward trends indicate struggles.
Conference Snapshot
- Week Dates: November 09 – November 15, 2026
- Trending Up (Efficiency):Wright State, Purdue Fort Wayne, N Illinois
- Trending Down (Efficiency):Cleveland State, Detroit Mercy, Green Bay, IUPUI, Milwaukee
Team-by-Team Analysis
Cleveland State
Record: 3-2 | Elo: 1452.3 (ranked 259 of 365) | Efficiency Margin: -31.09 (ranked 356 of 365)
Offensive Trends:
- Off Reb Pct (Offensive Rebounding): Currently ranked 206 of 365 in D1. Trending up strongly 🟢.
- Turnovers (Turnovers): Currently ranked 275 of 365 in D1. Trending up moderately 🔴.
Defensive Trends:
- Opp Turnovers (Opp Turnovers): Currently ranked 360 of 365 in D1. Trending down strongly 🔴.
- Def Reb Pct (Defensive Rebounding): Currently ranked 164 of 365 in D1. Trending up strongly 🟢.
Detroit Mercy
Record: 0-3 | Elo: 1439.3 (ranked 278 of 365) | Efficiency Margin: -34.36 (ranked 363 of 365)
Offensive Trends:
- Shooting (Shooting): Currently ranked 365 of 365 in D1. Trending down strongly 🔴.
- Off Reb Pct (Offensive Rebounding): Currently ranked 264 of 365 in D1. Trending down strongly 🔴.
Defensive Trends:
- Opp Shooting (Opp Shooting): Currently ranked 320 of 365 in D1. Trending up moderately 🔴.
- Opp Turnovers (Opp Turnovers): Currently ranked 364 of 365 in D1. Trending down moderately 🔴.
Green Bay
Record: 3-2 | Elo: 1468.1 (ranked 239 of 365) | Efficiency Margin: -3.70 (ranked 181 of 365)
Offensive Trends:
- Off Reb Pct (Offensive Rebounding): Currently ranked 166 of 365 in D1. Trending up strongly 🟢.
- Shooting (Shooting): Currently ranked 125 of 365 in D1. Trending down moderately 🔴.
Defensive Trends:
- Opp Shooting (Opp Shooting): Currently ranked 349 of 365 in D1. Trending up moderately 🔴.
- Opp Turnovers (Opp Turnovers): Currently ranked 177 of 365 in D1. Trending up moderately 🟢.
IUPUI
Record: 3-1 | Elo: 1345.1 (ranked 360 of 365) | Efficiency Margin: -14.06 (ranked 272 of 365)
Offensive Trends:
- Turnovers (Turnovers): Currently ranked 2 of 365 in D1. Trending down strongly 🟢.
- Off Reb Pct (Offensive Rebounding): Currently ranked 174 of 365 in D1. Trending up strongly 🟢.
Defensive Trends:
- Opp Shooting (Opp Shooting): Currently ranked 235 of 365 in D1. Trending down moderately 🟢.
- Opp Turnovers (Opp Turnovers): Currently ranked 39 of 365 in D1. Trending up weakly 🟢.
Milwaukee
Record: 1-3 | Elo: 1464.2 (ranked 244 of 365) | Efficiency Margin: -11.16 (ranked 251 of 365)
Offensive Trends:
- Off Reb Pct (Offensive Rebounding): Currently ranked 297 of 365 in D1. Trending down strongly 🔴.
- Shooting (Shooting): Currently ranked 282 of 365 in D1. Trending down moderately 🔴.
Defensive Trends:
- Opp Shooting (Opp Shooting): Currently ranked 245 of 365 in D1. Trending down moderately 🟢.
- Opp Turnovers (Opp Turnovers): Currently ranked 282 of 365 in D1. Trending down moderately 🔴.
N Illinois
Record: 3-2 | Elo: 1387.8 (ranked 336 of 365) | Efficiency Margin: -8.59 (ranked 228 of 365)
Offensive Trends:
- Off Reb Pct (Offensive Rebounding): Currently ranked 144 of 365 in D1. Trending up strongly 🟢.
- Shooting (Shooting): Currently ranked 104 of 365 in D1. Trending up moderately 🟢.
Defensive Trends:
- Opp Shooting (Opp Shooting): Currently ranked 301 of 365 in D1. Trending up moderately 🔴.
- Def Reb Pct (Defensive Rebounding): Currently ranked 83 of 365 in D1. Trending up moderately 🟢.
N Kentucky
Record: 2-3 | Elo: 1503.5 (ranked 184 of 365) | Efficiency Margin: -17.16 (ranked 293 of 365)
Offensive Trends:
- Shooting (Shooting): Currently ranked 236 of 365 in D1. Trending down strongly 🔴.
- Turnovers (Turnovers): Currently ranked 295 of 365 in D1. Trending up strongly 🔴.
Defensive Trends:
- Opp Turnovers (Opp Turnovers): Currently ranked 284 of 365 in D1. Trending down strongly 🔴.
- Def Reb Pct (Defensive Rebounding): Currently ranked 290 of 365 in D1. Trending down strongly 🔴.
Oakland
Record: 1-5 | Elo: 1491.4 (ranked 202 of 365) | Efficiency Margin: -15.03 (ranked 282 of 365)
Offensive Trends:
- Turnovers (Turnovers): Currently ranked 309 of 365 in D1. Trending up strongly 🔴.
- Off Reb Pct (Offensive Rebounding): Currently ranked 102 of 365 in D1. Trending up strongly 🟢.
Defensive Trends:
- Opp Shooting (Opp Shooting): Currently ranked 359 of 365 in D1. Trending up strongly 🔴.
- Opp Turnovers (Opp Turnovers): Currently ranked 287 of 365 in D1. Trending up weakly 🟢.
Purdue Fort Wayne
Record: 2-2 | Elo: 1489.2 (ranked 209 of 365) | Efficiency Margin: -10.82 (ranked 248 of 365)
Offensive Trends:
- Off Reb Pct (Offensive Rebounding): Currently ranked 332 of 365 in D1. Trending up strongly 🟢.
- Shooting (Shooting): Currently ranked 143 of 365 in D1. Trending up weakly 🟢.
Defensive Trends:
- Def Reb Pct (Defensive Rebounding): Currently ranked 142 of 365 in D1. Trending up strongly 🟢.
- Opp Shooting (Opp Shooting): Currently ranked 323 of 365 in D1. Trending up moderately 🔴.
Robert Morris
Record: 1-3 | Elo: 1538.6 (ranked 122 of 365) | Efficiency Margin: -24.43 (ranked 341 of 365)
Offensive Trends:
- Turnovers (Turnovers): Currently ranked 354 of 365 in D1. Trending up strongly 🔴.
- Off Reb Pct (Offensive Rebounding): Currently ranked 302 of 365 in D1. Trending up strongly 🟢.
Defensive Trends:
- Def Reb Pct (Defensive Rebounding): Currently ranked 352 of 365 in D1. Trending down strongly 🔴.
- Opp Turnovers (Opp Turnovers): Currently ranked 320 of 365 in D1. Trending down moderately 🔴.
Wright State
Record: 4-0 | Elo: 1575.7 (ranked 72 of 365) | Efficiency Margin: +22.32 (ranked 40 of 365)
Offensive Trends:
- Shooting (Shooting): Currently ranked 14 of 365 in D1. Trending up strongly 🟢.
- Turnovers (Turnovers): Currently ranked 193 of 365 in D1. Trending up weakly 🔴.
Defensive Trends:
- Opp Shooting (Opp Shooting): Currently ranked 39 of 365 in D1. Trending down strongly 🟢.
- Opp Turnovers (Opp Turnovers): Currently ranked 240 of 365 in D1. Trending up weakly 🟢.
Youngstown St
Record: 2-2 | Elo: 1490.0 (ranked 206 of 365) | Efficiency Margin: -3.19 (ranked 177 of 365)
Offensive Trends:
- Shooting (Shooting): Currently ranked 186 of 365 in D1. Trending down strongly 🔴.
- Off Reb Pct (Offensive Rebounding): Currently ranked 254 of 365 in D1. Trending down strongly 🔴.
Defensive Trends:
- Opp Turnovers (Opp Turnovers): Currently ranked 110 of 365 in D1. Trending up moderately 🟢.
- Def Reb Pct (Defensive Rebounding): Currently ranked 270 of 365 in D1. Trending down moderately 🔴.
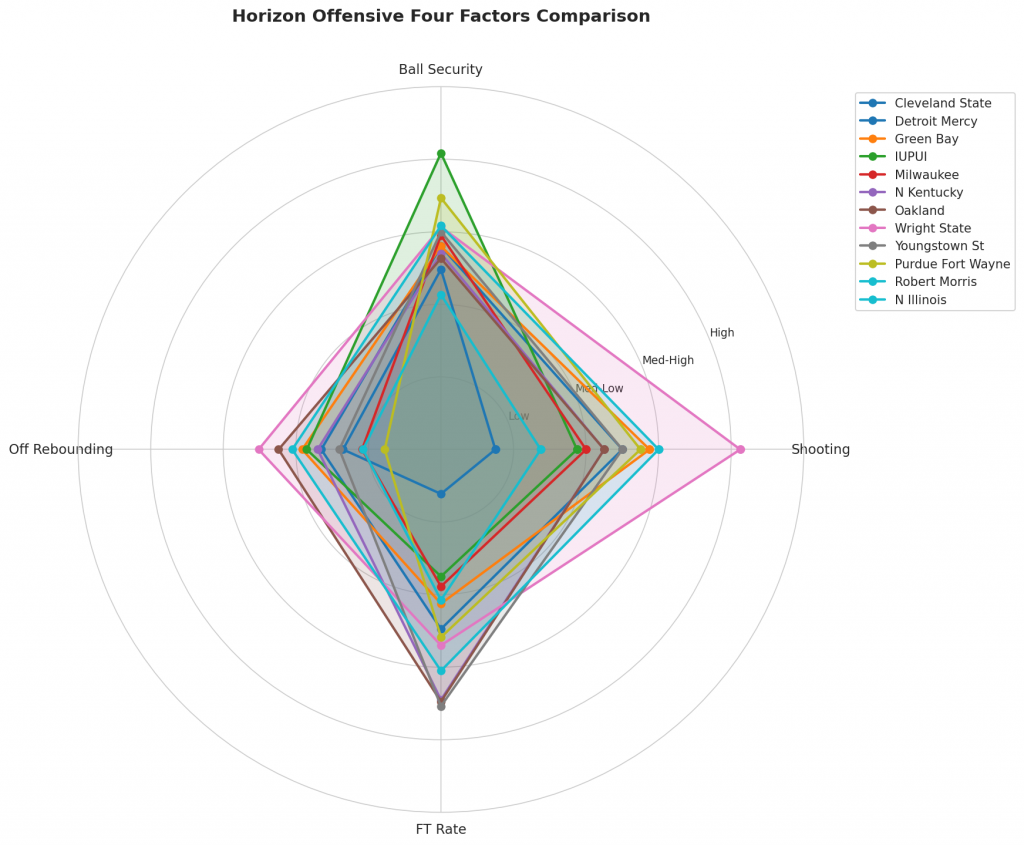
Figure 2: Offensive Four Factors comparison across Horizon teams. The radar chart shows each team’s shooting efficiency (eFG%), ball security (TOV%), offensive rebounding (OREB%), and free throw generation (FT Rate).
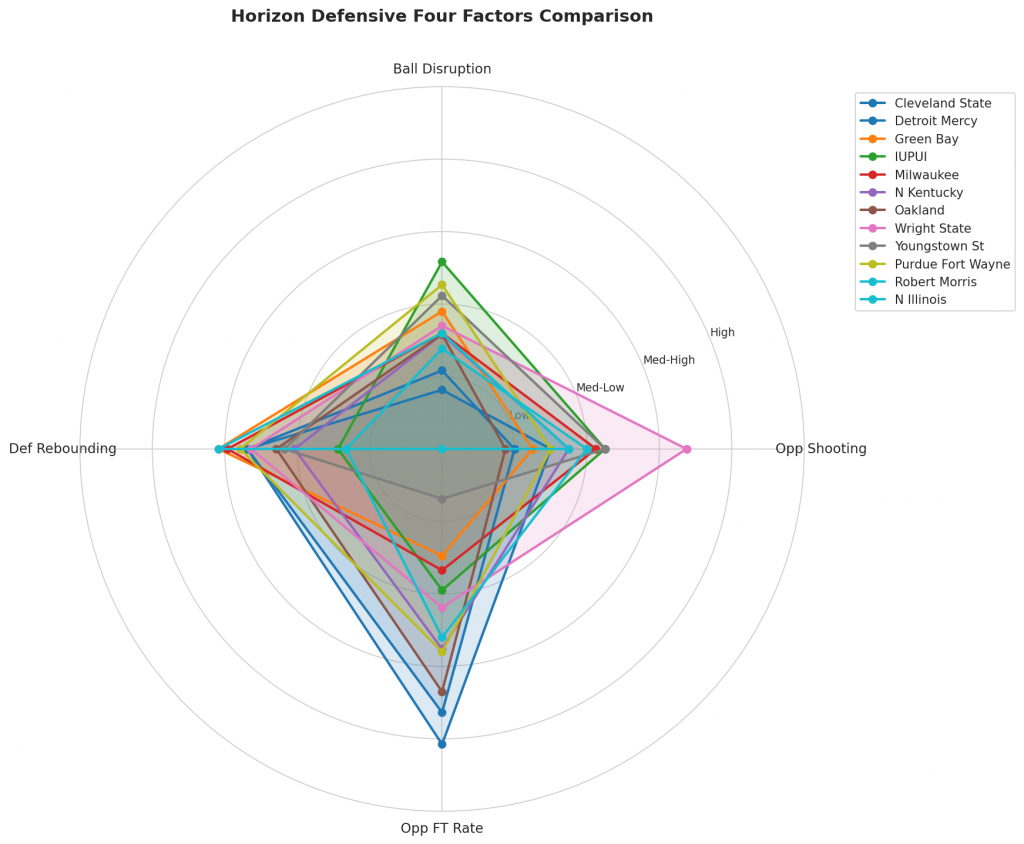
Figure 3: Defensive Four Factors comparison across Horizon teams. The radar chart shows each team’s opponent shooting defense (Opp eFG%), ball disruption (forcing TOV%), defensive rebounding (DREB%), and opponent free throw prevention (Opp FT Rate).
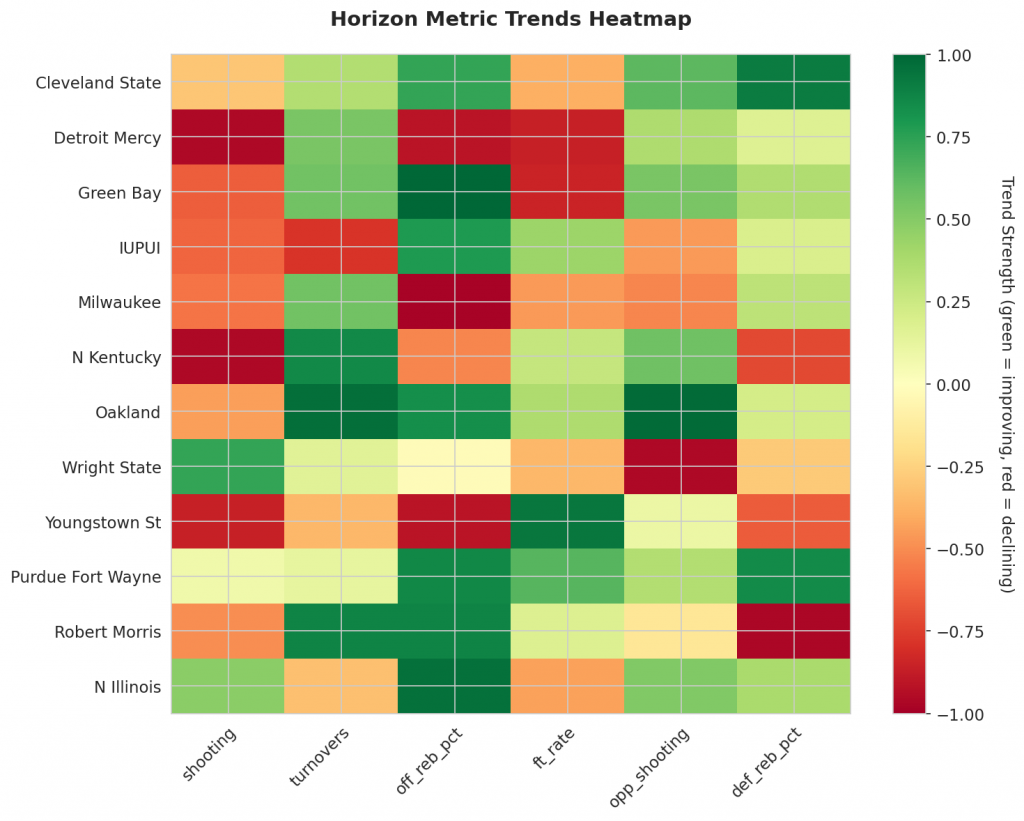
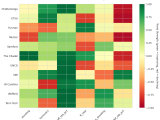
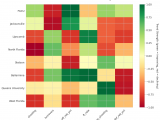
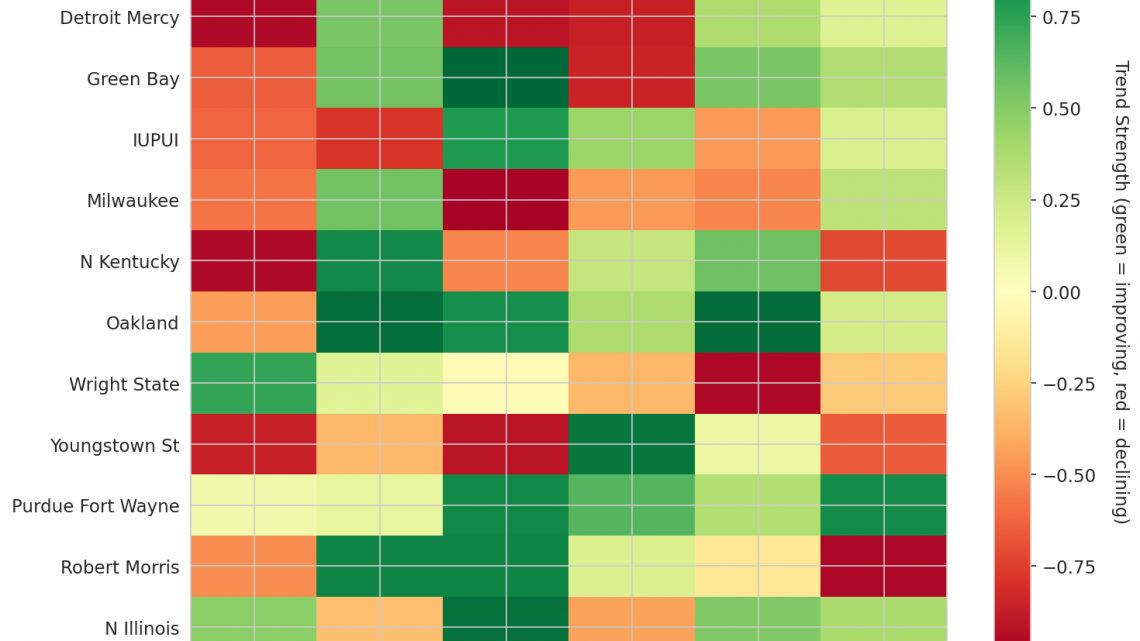
Figure 4: MACD trends heatmap showing which metrics are improving (green) or declining (red) for each team. Stronger colors indicate more pronounced trends.
Looking Ahead
As Horizon teams progress through their season, MACD trending indicators provide a vital lens for distinguishing genuine improvement from unsustainable momentum. By examining the metrics established so far in Week 2, we can isolate which squads are building a sustainable foundation versus those facing statistical regression.
On the offensive end, Cleveland State and Green Bay are demonstrating clear signs of stabilization and growth regarding rebounding efficiency. Cleveland State’s Offensive Rebound Percentage, sitting at a season average of 0.282, is trending up with strong strength, indicating a meaningful increase in second-chance opportunities. Similarly, Green Bay is seeing their own Off Reb Pct (Season Avg: 0.303) trend upward strongly, suggesting they are effectively creating additional scoring chances through improved glass work.
In contrast, Detroit Mercy presents a concerning trajectory for their offensive production. Their Shooting percentage, currently at a season average of 0.360, is trending down with strong strength. This indicates a significant decline in efficiency, warranting close monitoring as the value of their shot-making capability decreases. Furthermore, their ability to secure offensive boards is also deteriorating; Detroit Mercy’s Off Reb Pct (Season Avg: 0.258) is trending down strongly, compounding their offensive struggles by yielding more control to opponents on the glass.
Defensively, Cleveland State and Northern Kentucky are facing challenges despite showing strength in specific areas. Cleveland State is effectively improving their defensive board retention; with a Def Reb Pct of 0.715, they are trending up strongly, successfully grabbing more defensive boards than their season average suggests. However, the trend for forcing opponent turnovers has reversed. Cleveland State’s Opp Turnovers (Season Avg: 0.115) are trending down strongly, marking a worsening ability to create steals and loose balls compared to earlier performances.
Northern Kentucky faces a steeper decline in their defensive identity. While they were previously effective at disrupting offense, their current trend for Opp Turnovers (Season Avg: 0.145) is trending down strongly, indicating a sharp decrease in the volume of turnovers forced per possession. This decline in pressure is compounded by a collapse on the defensive glass. Northern Kentucky’s Def Reb Pct (Season Avg: 0.663) is trending down strongly, meaning they are now allowing more offensive boards to opponents than in previous games, fundamentally altering their transition defense strategy.
These MACD indicators serve as early warning systems or validation of performance shifts. As the season unfolds, these specific metric movements will determine which teams can sustain their current pace and which require immediate tactical adjustments.
Metrics Glossary
Four Factors (Dean Oliver’s framework for basketball success):
- eFG% (Effective Field Goal %): Field goal percentage adjusted for 3-pointers being worth more (FGM + 0.5×3PM) / FGA. Higher is better offensively, lower is better defensively.
- TOV% (Turnover Rate): Turnovers per 100 possessions. Lower is better offensively (taking care of the ball), higher is better defensively (forcing turnovers).
- OREB% / DREB% (Offensive/Defensive Rebound Rate): Percentage of available rebounds grabbed. Offensive rebounds create second-chance points; defensive rebounds end opponent possessions.
- FTR (Free Throw Rate): Free throws made per field goal attempt (FTM/FGA). Measures ability to get to the line AND convert. Higher is better offensively, lower is better defensively.
Other Metrics:
- Elo Rating: Chess-style rating system that updates based on game results and opponent strength. Higher Elo indicates stronger team.
- Efficiency Margin: Point differential per 100 possessions (Offensive Efficiency – Defensive Efficiency). Accounts for pace of play.
- MACD (Moving Average Convergence Divergence): Trend indicator comparing 12-game and 26-game exponential moving averages. Positive MACD = improving trend, Negative MACD = declining trend.
Analysis powered by HoopSci’s advanced metrics and MACD trending indicators.