Modeling College Basketball Scores
November 11, 2025Introduction
Game outcome prediction in college basketball presents both practical and theoretical challenges due to the sport’s inherent variability and complex interaction effects between team statistics. This study investigates whether statistical modeling can exceed baseline prediction accuracy through systematic application of basketball analytics principles and machine learning techniques.
Methodology
Foundational Framework
The analysis begins with the fundamental basketball scoring equation:
Points Scored = Possessions × (Points per Possession)Expressed in analytical terms:
Score = Pace × EfficiencyFor matchup-specific predictions, team efficiency must be estimated relative to opponent defensive capability. The initial approach employed simple arithmetic averaging:
Team A expected efficiency = (Team A offensive efficiency + Team B defensive efficiency) / 2This equal-weighting method, applied without machine learning or complex algorithms, achieved 69.0% win prediction accuracy across the test dataset, establishing a strong baseline for comparison.
Variance Weighting Analysis
Inverse variance weighting was evaluated as a method to weight statistical measurements by their reliability. The hypothesis was that teams with high performance variance should receive lower weight in predictions compared to teams with consistent performance metrics.
Four weighting configurations were tested:
- Simple averaging (no weighting): 69.0% accuracy
- Variance-weighted pace only: 69.0% accuracy
- Variance-weighted efficiency only: 67.9% accuracy
- Variance-weighted all parameters: 67.9% accuracy
Results indicate that inverse variance weighting provided no performance improvement over simple averaging, and in some configurations decreased prediction accuracy by 1.1 percentage points. This suggests that in college basketball prediction, simple arithmetic averaging demonstrates greater robustness than theoretically optimal weighting schemes, possibly due to the introduction of additional noise from variance estimation.
Linear Regression Model
Ridge regression with L2 regularization was implemented to test whether machine learning could improve upon the formula-based approach. The model utilized a single composite feature:
(Home Team Efficiency - Away Team Efficiency) × Game PaceTraining was conducted on 106,767 games spanning 21 seasons (2005-2025), yielding 69.5% win prediction accuracy.
The marginal improvement of 0.5 percentage points over the formula-based method suggests that basketball scoring relationships are predominantly linear. The efficiency differential maps to score differential without requiring non-linear transformations, indicating that simple linear models capture the majority of predictable variance in game outcomes.
Gradient Boosting Models
XGBoost (Extreme Gradient Boosting), an ensemble method using decision trees, was evaluated for its capacity to capture non-linear patterns and feature interactions. Additional predictor variables were incorporated:
- Team strength metrics: Elo rating, Pythagorean win expectation, scoring margin, win percentage
- Venue information: Home, away, or neutral site designation
- Contextual features: Days of rest, game type (conference, tournament, postseason)
Model 6 (11 features) achieved 72.7% accuracy. Model 7 (16 features including contextual variables) achieved 72.8% accuracy.
These results demonstrate that ensemble machine learning methods provide a measurable improvement of 3-4 percentage points over formula-based approaches. However, diminishing returns are evident: the addition of five contextual features yielded only 0.1% accuracy improvement, suggesting that most predictive information is captured by core efficiency and strength metrics.
Results
Model Performance Summary
Seven distinct models were developed and evaluated:
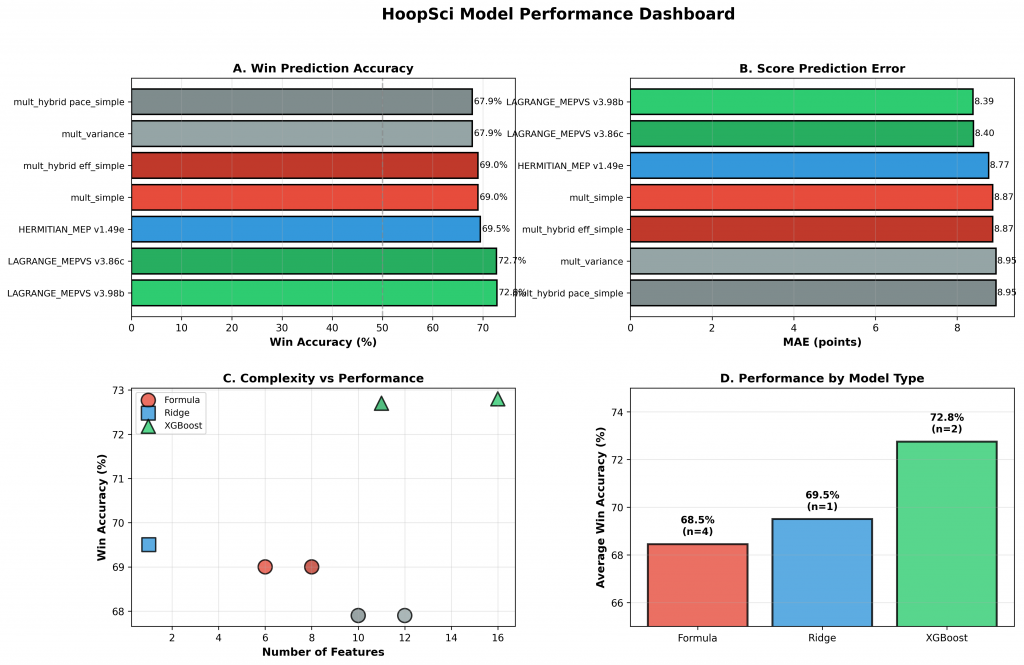
Figure 1: Comprehensive comparison of all seven models across multiple performance dimensions. Panel A shows win prediction accuracy, Panel B shows score prediction error (MAE), Panel C illustrates the complexity-performance tradeoff, and Panel D compares average performance by model type.
Formula-Based Models (Models 1-4)
Pure formula-based predictions using Score = Efficiency × Pace
- Best performer: mult_simple (69.0% accuracy, 8.87 MAE)
- Poorest performer: mult_variance (67.9% accuracy, 8.95 MAE)
- Training set: 22,557 games (2022-2025)
- Computational cost: Minimal (no training required)
- Interpretability: Complete
Linear Model (Model 5)
HERMITIAN_MEP v1.49e (Ridge Regression)
- Accuracy: 69.5% (8.77 MAE)
- Features: 1 (efficiency differential × pace)
- Training set: 106,767 games (2005-2025, 21 seasons)
- Computational cost: Low
- Interpretability: High (linear coefficients)
Ensemble Models (Models 6-7)
LAGRANGE_MEPVS v3.86c (XGBoost, 11 features)
- Accuracy: 72.7% (8.40 MAE)
- Features: efficiency + strength + venue
LAGRANGE_MEPVS v3.98b (XGBoost, 16 features) – Production Model
- Accuracy: 72.8% (8.39 MAE)
- Features: efficiency + strength + venue + context
- Training set: 106,767 games (21 seasons)
- Computational cost: Low inference, high training
- Interpretability: Low (ensemble black box)
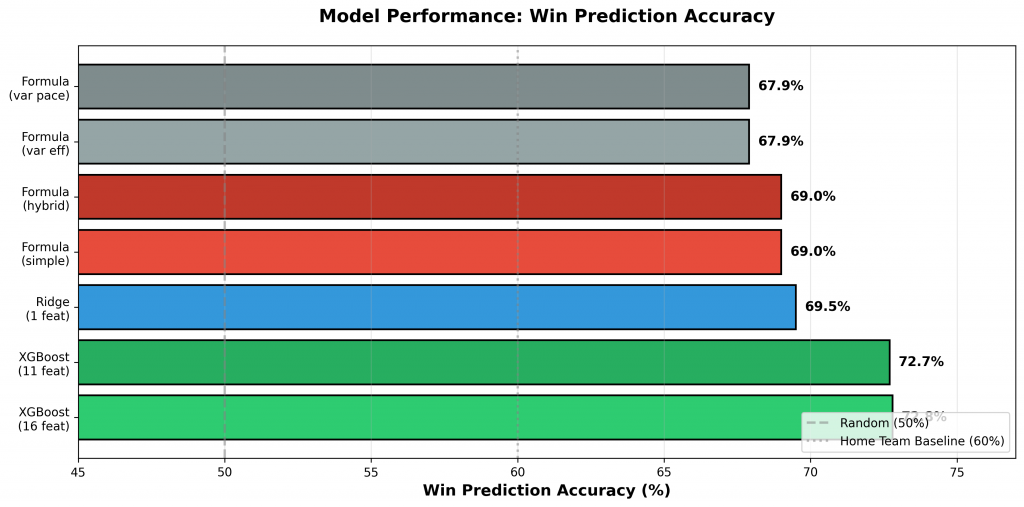
Figure 2: Win prediction accuracy ranked from best to worst performing models. Baseline references show random selection (50%) and naive home team selection (60%). Machine learning models achieve 72-73% accuracy while formula-based models reach 67-69%.
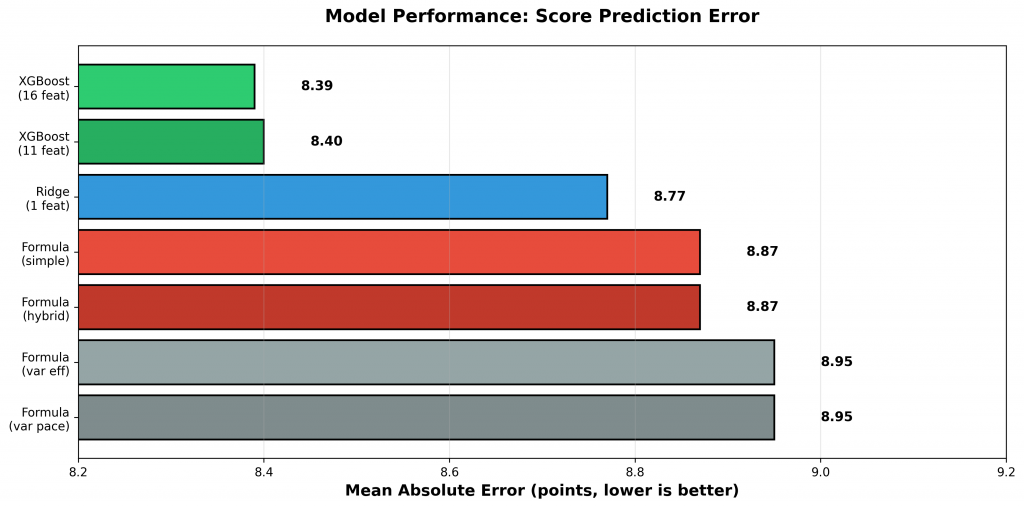
Figure 3: Mean Absolute Error (MAE) for score predictions, showing average point difference between predicted and actual scores. Lower values indicate better score prediction accuracy. XGBoost models achieve the lowest error at approximately 8.4 points per team.
Discussion
Key Findings
1. Domain Knowledge Provides Substantial Baseline Performance
Formula-based models incorporating fundamental basketball physics achieved 69% accuracy, demonstrating that domain knowledge encodes significant predictive power independent of machine learning techniques. This baseline performance suggests that sports prediction applications should prioritize domain-specific models before exploring complex algorithms.
2. Simple Averaging Outperforms Theoretical Optimal Weighting
Contrary to statistical theory suggesting inverse variance weighting as optimal, empirical results demonstrate that simple arithmetic averaging produces superior or equivalent prediction accuracy. This discrepancy between theoretical optimality and empirical performance may result from estimation noise in variance calculations or model misspecification regarding the true data generating process.
3. Linear Relationships Dominate Basketball Scoring
A single feature (efficiency differential × pace) captures 69.5% of predictable game outcomes, indicating that basketball scoring relationships are fundamentally linear. The direct mapping from efficiency differential to score differential requires minimal non-linear transformation, suggesting that linear models capture the majority of systematic variance.
4. Machine Learning Provides Modest Incremental Gains
XGBoost ensemble methods incorporating team strength features improve accuracy from 69% to 73%, representing a measurable but modest 3-4 percentage point improvement. Non-linear patterns and feature interaction effects contribute incremental predictive value but do not fundamentally alter the prediction problem’s structure.
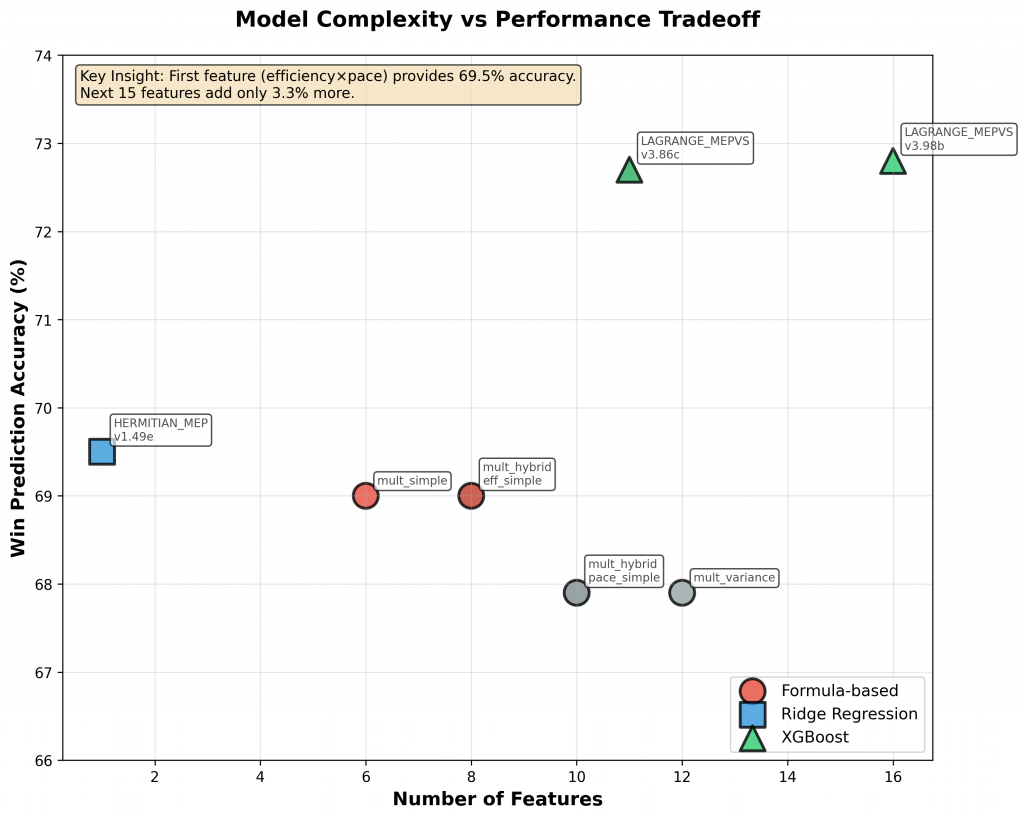
Figure 4: Model complexity (number of features) versus win prediction accuracy. The first feature (efficiency × pace) provides 69.5% accuracy. Adding 15 more features to XGBoost models yields only 3.3 percentage points of additional accuracy, demonstrating diminishing returns from increased model complexity.
5. Historical Data Benefits Machine Learning More Than Formula Models
Formula models trained on 4 seasons achieved 69.0% accuracy, while ML models trained on 21 seasons achieved 72.8% accuracy. This differential benefit from additional training data reflects the fundamental difference between models encoding domain physics (formulas) and models discovering empirical patterns (machine learning). Formula-based approaches are data-efficient, requiring only recent data to estimate current team capabilities, while machine learning methods benefit from extensive historical examples to learn interaction patterns.
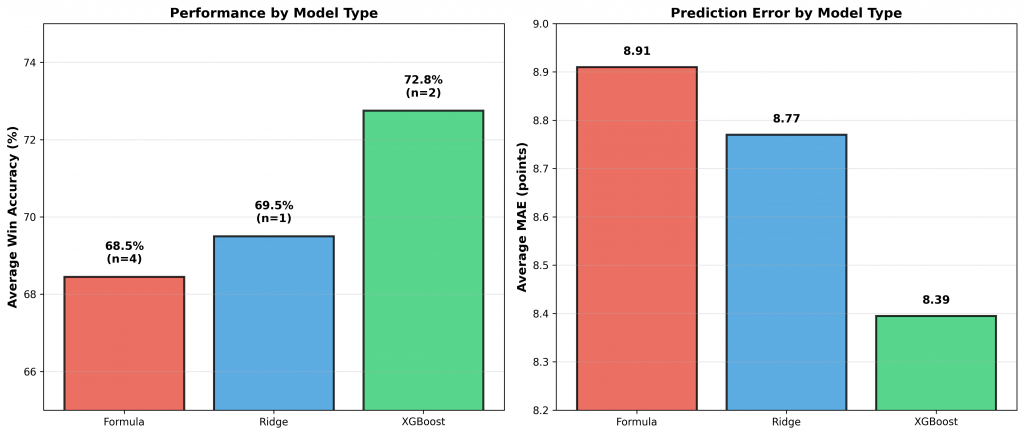
Figure 5: Average performance by model type. Left panel shows win prediction accuracy: Formula-based models average 68.5%, Ridge regression achieves 69.5%, and XGBoost models average 72.8%. Right panel shows Mean Absolute Error with XGBoost models demonstrating the lowest prediction error.
Performance Contextualization
The achieved accuracy of 72.8% can be contextualized relative to baseline and theoretical benchmarks:
- Random selection (coin flip): 50%
- Naive home team selection: ~60%
- Best formula model: 69%
- Best ML model: 72.8%
- Professional betting lines: ~75% (estimated)
- Theoretical maximum: ~80-85% (estimated)
While the developed models do not exceed professional betting line performance (which incorporates non-public information such as injury reports and real-time betting market dynamics), they demonstrate competitive performance for an academic research project utilizing only publicly available data.
Beyond prediction accuracy, this research has established a comprehensive analytical framework comprising:
- Automated data collection pipeline
- Feature engineering system
- Model training infrastructure
- Performance monitoring system
- Multiple models optimized for different use cases (interpretability vs accuracy)
Error Analysis
The best-performing model exhibits a Mean Absolute Error (MAE) of 8.39 points per team. While this may initially appear substantial, it should be interpreted in context: in a typical 75-70 game, a prediction of 78-73 represents correct winner identification despite imperfect score estimation. Win prediction accuracy remains the primary evaluation metric, as exact score prediction is substantially more difficult and less practically relevant.
Several factors constrain maximum achievable accuracy:
- Unobserved information: Player injuries, lineup changes, and in-game adjustments are not captured in season-aggregate statistics
- Stochastic variance: Basketball outcomes contain inherent randomness from shooting variance, officiating, and situational momentum effects
- Model limitations: Team-level aggregated statistics do not capture player-specific matchup effects or tactical adjustments
Given these fundamental constraints, 73% win accuracy represents reasonable performance for models using only publicly available team-aggregate statistics.
Future Research Directions
Short-Term Extensions
Model Ensembling: Combining predictions from multiple models through weighted averaging or stacking could reduce prediction variance. Estimated performance gain: +0.5-1.0 percentage points.
Strength of Schedule Adjustments: While partially captured through Elo ratings, direct strength-of-schedule features based on opponent quality distributions may provide additional predictive information.
Medium-Term Research Directions
Player-Level Modeling: Rather than relying solely on team-aggregate statistics, future work will model individual player production and in-team interaction effects, aggregating player-level predictions to generate team score forecasts. This approach could better account for lineup changes, rotation patterns, and player-specific matchup advantages.
Momentum and Trending Analysis: Team performance trends represent a specialty focus area for HoopSci. Rather than applying arbitrary rolling averages or exponential moving averages with pre-defined parameters, systematic experimentation will identify optimal trend detection approaches. This includes testing various window sizes, weighting schemes, and decay functions to capture teams “on a roll” versus teams “in a slump.”
Game Context Effects: Investigation into efficiency metric reliability during non-competitive game situations. When games become blowouts and teams substitute reserve players, do efficiency statistics remain predictive? Systematic analysis will determine whether garbage-time statistics should be weighted differently or excluded from team performance metrics.
Feature Engineering Expansion: Substantial opportunities remain for feature-level improvements before advancing to more complex modeling architectures. Exhaustive exploration of basketball-specific features, interaction terms, and domain-informed transformations will be prioritized over architectural complexity.
Technical Implementation
System Architecture
Data Collection Layer:
- Automated data collection pipeline from publicly available sources
- MySQL relational database storing 100,000+ games and 1,000,000+ player records
- Daily data processing and update system
Feature Engineering Pipeline:
- Dean Oliver’s Four Factors (effective field goal percentage, turnover rate, offensive rebound percentage, free throw rate)
- Dual efficiency calculation system (ratio-based for rankings, margin-based for machine learning)
- Tempo-free statistics (per-100-possession normalization)
- Bootstrap averaging for early-season estimate stabilization
Model Training Infrastructure:
- Scikit-learn for linear models (Ridge regression with L2 regularization)
- XGBoost for ensemble methods (gradient boosted decision trees)
- MLflow experiment tracking system for parameter logging and performance monitoring
- 5-fold cross-validation for model robustness validation
Production Deployment:
- Serialized models (pickle format, ~1 MB per model)
- MySQL model registry tracking 7 production-deployed models
- Automated prediction pipeline generating daily game forecasts
- Continuous performance monitoring and accuracy tracking
Implementation: Python codebase comprising approximately 10,000 lines across data collection, feature engineering, statistical modeling, and web interface generation modules.
Research Objectives
This research establishes a performance baseline using simple, interpretable models as a foundation for systematic improvement through feature addition and controlled complexity increases. Primary objectives:
- Baseline Establishment: Create simple formula-based and linear models that establish minimum acceptable performance levels against which feature additions can be measured. The current baseline (67.9% – 72.8% accuracy) provides a solid foundation for evaluating incremental improvements.
- Infrastructure Development: Build comprehensive data processing, feature engineering, and model evaluation systems that enable rapid experimentation and systematic testing of new approaches.
- Methodological Rigor: Demonstrate principled development approach with honest reporting of negative results (variance weighting, diminishing returns from complexity) and realistic performance assessment (competitive but not exceptional accuracy).
- Educational Content: Document basketball analytics methodology to inform and engage the basketball analytics community, demonstrating what works, what doesn’t, and why.
The baseline models provide a reference point for future enhancements. Each new feature, interaction term, or modeling approach can be evaluated against this established performance level, ensuring that added complexity yields measurable improvements rather than just theoretical sophistication.
Conclusions
Following extensive development, evaluation of multiple approaches, and training on 21 seasons of basketball data, the primary methodological conclusion is:
Prioritize simplicity, validate incrementally, and add complexity only when empirically justified.
The optimal model selection depends on use case requirements:
- Formula-based models (69% accuracy): Six input parameters, instantaneous computation, complete interpretability. Suitable for applications prioritizing transparency and computational efficiency.
- Machine learning models (73% accuracy): Sixteen engineered features, extended training time, limited interpretability. Appropriate for applications prioritizing maximum prediction accuracy.
- Single-feature linear model (Model 5, 69.5% accuracy): Demonstrates that efficiency differential × pace captures fundamental basketball scoring dynamics, providing theoretical insight into the sport’s mathematical structure.
The trade-off between model complexity and performance gain represents a key decision point for practitioners: a 3-4 percentage point accuracy improvement requires substantially increased computational resources and reduced interpretability.
Data Access
Model predictions and performance data are available through the hoopsci.com platform, which provides:
- Daily game predictions from all seven models
- Comparative model performance analytics
- Historical prediction accuracy tracking
- Comprehensive methodology documentation
Acknowledgments
Data Sources: Publicly available game statistics, schedules, and play-by-play records
Methodological Foundation: Dean Oliver (Four Factors framework), Ken Pomeroy (tempo-free statistics), Bart Torvik (efficiency rating systems)
Software: Python, MySQL (database), Scikit-learn (linear models), XGBoost (ensemble methods), MLflow (experiment tracking)
Contributors: Neill White (system architecture, data engineering pipeline) and Claude Code (model development, statistical analysis, documentation)
Appendix: Model Nomenclature
The model naming convention employs mathematical terminology combined with feature set abbreviations:
- LAGRANGE_MEPVS: Lagrange + Margin Efficiency Pace Venue Strength
- HERMITIAN_MEP: Hermitian + Margin Efficiency Pace
Feature set abbreviations:
- MEP: Margin Efficiency Pace
- MEPVS: Margin Efficiency Pace Venue Strength
- MEPVSC: MEPVS + Context
Example: LAGRANGE_MEPVS v3.98b represents an XGBoost ensemble (880 KB serialized model) trained on 106,767 games with 16 engineered features including efficiency, pace, venue, and contextual variables.