Atlantic Sun Update: Week 1
November 16, 2025The Atlantic Sun enters Week 1 with teams showing diverse trending patterns. This analysis examines each team’s performance trends using MACD (Moving Average Convergence Divergence) indicators to identify not just where teams stand, but where they’re headed.
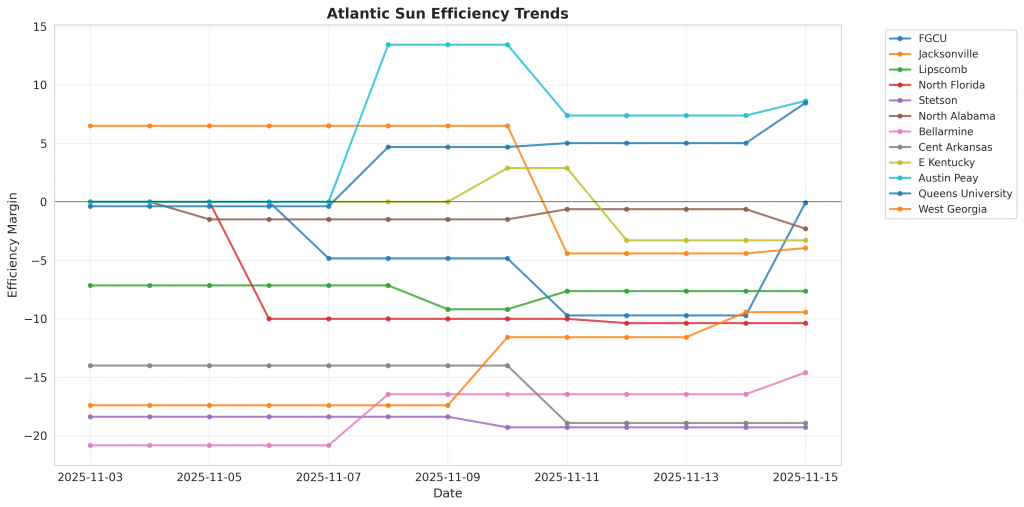
Figure 1: Efficiency margin trends for Atlantic Sun teams throughout the season. Teams trending upward show improving performance, while downward trends indicate struggles.
Conference Snapshot
- Week Dates: November 03 – November 09, 2025
- Trending Up (Efficiency): Queens University
- Trending Down (Efficiency): FGCU, Jacksonville, Lipscomb, North Florida, Stetson
Team-by-Team Analysis
Austin Peay
Record: 3-1 | Elo: 1468.7 (ranked 229 of 365) | Efficiency Margin: +8.63 (ranked 161 of 365)
Offensive Trends:
- TOV_PCT (Turnover Rate (turnovers per 100 possessions – lower is better)): Currently ranked 251 of 365 in D1. Trending up moderately.
- FTR (Free Throw Rate (FTM/FGA – getting to the line and converting)): Currently ranked 162 of 365 in D1. Trending up strongly.
Bellarmine
Record: 0-3 | Elo: 1326.9 (ranked 358 of 365) | Efficiency Margin: -14.59 (ranked 341 of 365)
Defensive Trends:
- EFG (eFG% Allowed (lower is better – opponents shooting less efficiently)): Currently ranked 365 of 365 in D1. Trending up strongly.
- FTR (FTR Allowed (opponent free throws – lower is better)): Currently ranked 263 of 365 in D1. Trending up strongly.
Cent Arkansas
Record: 0-2 | Elo: 1362.0 (ranked 345 of 365) | Efficiency Margin: -18.92 (ranked 354 of 365)
Insufficient games played for meaningful trend analysis (MACD requires 12+ games).
E Kentucky
Record: 1-2 | Elo: 1495.1 (ranked 191 of 365) | Efficiency Margin: -3.29 (ranked 277 of 365)
Offensive Trends:
- OR_PCT (Offensive Rebound Rate (% of available offensive rebounds grabbed)): Currently ranked 260 of 365 in D1. Trending down strongly.
- FTR (Free Throw Rate (FTM/FGA – getting to the line and converting)): Currently ranked 284 of 365 in D1. Trending up moderately.
Defensive Trends:
- TOV_PCT (Forced Turnover Rate (causing opponent turnovers – higher is better)): Currently ranked 356 of 365 in D1. Trending down strongly.
FGCU
Record: 2-2 | Elo: 1498.3 (ranked 184 of 365) | Efficiency Margin: -0.08 (ranked 240 of 365)
Offensive Trends:
- EFG (Effective Field Goal % (adjusts for 3-pointers being worth more)): Currently ranked 194 of 365 in D1. Trending down moderately.
Defensive Trends:
- EFG (eFG% Allowed (lower is better – opponents shooting less efficiently)): Currently ranked 352 of 365 in D1. Trending up strongly.
- FTR (FTR Allowed (opponent free throws – lower is better)): Currently ranked 283 of 365 in D1. Trending up strongly.
Jacksonville
Record: 1-2 | Elo: 1494.2 (ranked 192 of 365) | Efficiency Margin: -3.96 (ranked 284 of 365)
Defensive Trends:
- FTR (FTR Allowed (opponent free throws – lower is better)): Currently ranked 300 of 365 in D1. Trending up moderately.
Lipscomb
Record: 0-3 | Elo: 1546.7 (ranked 115 of 365) | Efficiency Margin: -7.64 (ranked 309 of 365)
Offensive Trends:
- EFG (Effective Field Goal % (adjusts for 3-pointers being worth more)): Currently ranked 318 of 365 in D1. Trending down strongly.
Defensive Trends:
- EFG (eFG% Allowed (lower is better – opponents shooting less efficiently)): Currently ranked 361 of 365 in D1. Trending up strongly.
- FTR (FTR Allowed (opponent free throws – lower is better)): Currently ranked 65 of 365 in D1. Trending up strongly.
North Alabama
Record: 1-2 | Elo: 1526.0 (ranked 146 of 365) | Efficiency Margin: -2.30 (ranked 268 of 365)
Offensive Trends:
- FTR (Free Throw Rate (FTM/FGA – getting to the line and converting)): Currently ranked 148 of 365 in D1. Trending up strongly.
North Florida
Record: 0-2 | Elo: 1453.1 (ranked 258 of 365) | Efficiency Margin: -10.37 (ranked 329 of 365)
Offensive Trends:
- EFG (Effective Field Goal % (adjusts for 3-pointers being worth more)): Currently ranked 338 of 365 in D1. Trending down strongly.
Defensive Trends:
- DR_PCT (Defensive Rebound Rate (% of available defensive rebounds secured)): Currently ranked 365 of 365 in D1. Trending down strongly.
Queens University
Record: 1-3 | Elo: 1486.6 (ranked 209 of 365) | Efficiency Margin: +8.46 (ranked 162 of 365)
Defensive Trends:
- FTR (FTR Allowed (opponent free throws – lower is better)): Currently ranked 172 of 365 in D1. Trending up moderately.
- DR_PCT (Defensive Rebound Rate (% of available defensive rebounds secured)): Currently ranked 265 of 365 in D1. Trending down strongly.
Stetson
Record: 0-2 | Elo: 1392.0 (ranked 325 of 365) | Efficiency Margin: -19.28 (ranked 356 of 365)
Offensive Trends:
- FTR (Free Throw Rate (FTM/FGA – getting to the line and converting)): Currently ranked 112 of 365 in D1. Trending up strongly.
Defensive Trends:
- FTR (FTR Allowed (opponent free throws – lower is better)): Currently ranked 167 of 365 in D1. Trending up strongly.
- DR_PCT (Defensive Rebound Rate (% of available defensive rebounds secured)): Currently ranked 327 of 365 in D1. Trending down strongly.
West Georgia
Record: 1-2 | Elo: 1387.4 (ranked 328 of 365) | Efficiency Margin: -9.44 (ranked 322 of 365)
Defensive Trends:
- DR_PCT (Defensive Rebound Rate (% of available defensive rebounds secured)): Currently ranked 248 of 365 in D1. Trending down strongly.
- FTR (FTR Allowed (opponent free throws – lower is better)): Currently ranked 218 of 365 in D1. Trending up strongly.
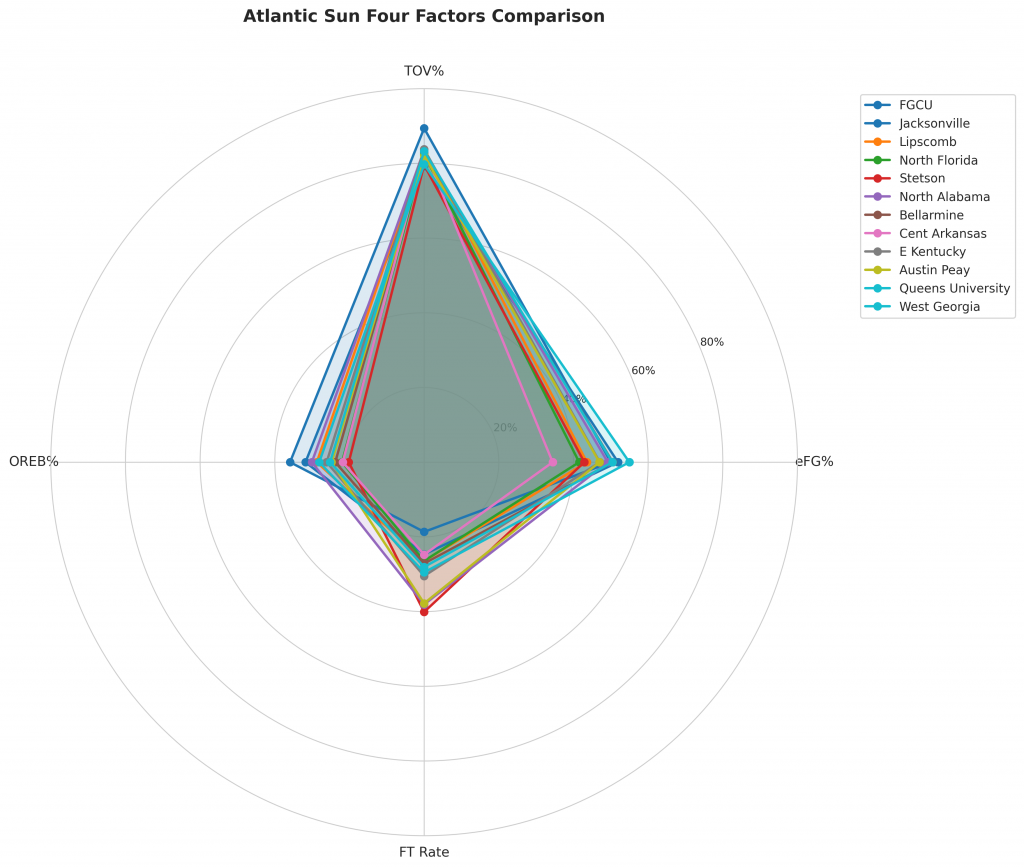
Figure 2: Four Factors comparison across Atlantic Sun teams. The radar chart shows each team’s offensive efficiency (eFG%), ball security (TOV%), rebounding (OREB%), and free throw generation (FT Rate).
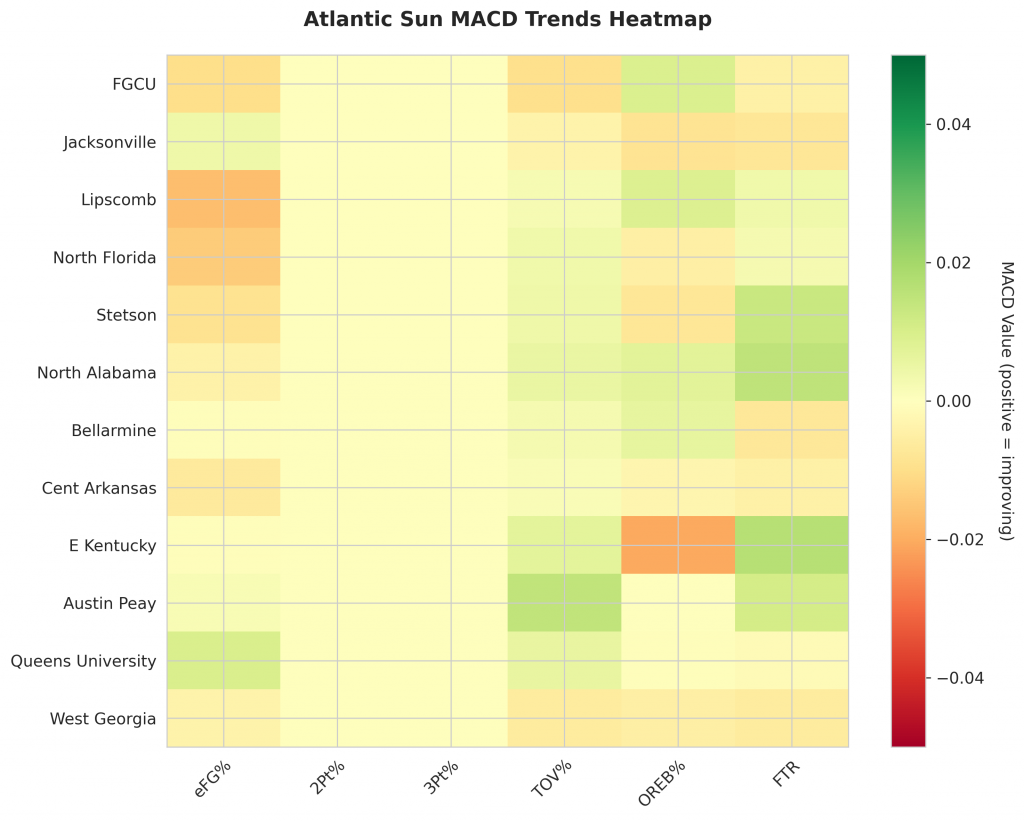
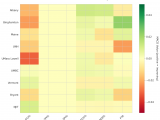
Figure 3: MACD trends heatmap showing which metrics are improving (green) or declining (red) for each team. Stronger colors indicate more pronounced trends.
Looking Ahead
As Atlantic Sun teams continue their season, the MACD trending indicators will help identify which teams are genuinely improving versus those riding unsustainable momentum. Check back next week for updated analysis.
Metrics Glossary
Four Factors (Dean Oliver’s framework for basketball success):
- eFG% (Effective Field Goal %): Field goal percentage adjusted for 3-pointers being worth more (FGM + 0.5×3PM) / FGA. Higher is better offensively, lower is better defensively.
- TOV% (Turnover Rate): Turnovers per 100 possessions. Lower is better offensively (taking care of the ball), higher is better defensively (forcing turnovers).
- OREB% / DREB% (Offensive/Defensive Rebound Rate): Percentage of available rebounds grabbed. Offensive rebounds create second-chance points; defensive rebounds end opponent possessions.
- FTR (Free Throw Rate): Free throws made per field goal attempt (FTM/FGA). Measures ability to get to the line AND convert. Higher is better offensively, lower is better defensively.
Other Metrics:
- Elo Rating: Chess-style rating system that updates based on game results and opponent strength. Higher Elo indicates stronger team.
- Efficiency Margin: Point differential per 100 possessions (Offensive Efficiency – Defensive Efficiency). Accounts for pace of play.
- MACD (Moving Average Convergence Divergence): Trend indicator comparing 12-game and 26-game exponential moving averages. Positive MACD = improving trend, Negative MACD = declining trend.
Analysis powered by HoopSci’s advanced metrics and MACD trending indicators.