Big 12 Update: Week 1
November 16, 2025The Big 12 enters Week 1 with teams showing diverse trending patterns. This analysis examines each team’s performance trends using MACD (Moving Average Convergence Divergence) indicators to identify not just where teams stand, but where they’re headed.
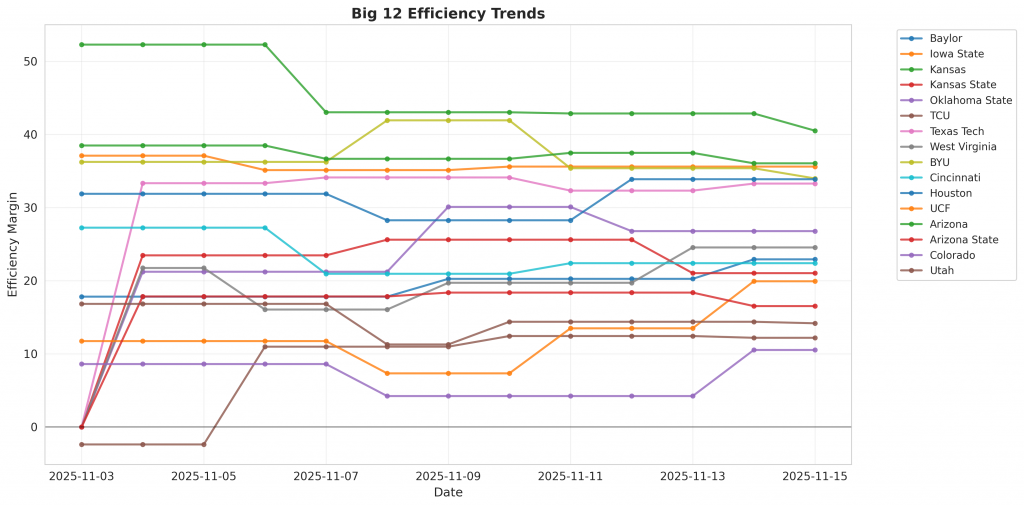
Figure 1: Efficiency margin trends for Big 12 teams throughout the season. Teams trending upward show improving performance, while downward trends indicate struggles.
Conference Snapshot
- Week Dates: November 03 – November 09, 2025
- Trending Down (Efficiency): Baylor, Iowa State, Kansas, Kansas State, Oklahoma State
Team-by-Team Analysis
Arizona
Record: 4-0 | Elo: 1688.5 (ranked 12 of 365) | Efficiency Margin: +36.06 (ranked 18 of 365)
Offensive Trends:
- FTR (Free Throw Rate (FTM/FGA – getting to the line and converting)): Currently ranked 140 of 365 in D1. Trending up moderately.
Defensive Trends:
- DR_PCT (Defensive Rebound Rate (% of available defensive rebounds secured)): Currently ranked 178 of 365 in D1. Trending down moderately.
Arizona State
Record: 2-1 | Elo: 1496.7 (ranked 186 of 365) | Efficiency Margin: +16.54 (ranked 106 of 365)
Insufficient games played for meaningful trend analysis (MACD requires 12+ games).
BYU
Record: 3-1 | Elo: 1660.0 (ranked 19 of 365) | Efficiency Margin: +33.99 (ranked 25 of 365)
Offensive Trends:
- OR_PCT (Offensive Rebound Rate (% of available offensive rebounds grabbed)): Currently ranked 158 of 365 in D1. Trending down moderately.
- TOV_PCT (Turnover Rate (turnovers per 100 possessions – lower is better)): Currently ranked 9 of 365 in D1. Trending down strongly.
Defensive Trends:
- FTR (FTR Allowed (opponent free throws – lower is better)): Currently ranked 46 of 365 in D1. Trending down moderately.
- DR_PCT (Defensive Rebound Rate (% of available defensive rebounds secured)): Currently ranked 68 of 365 in D1. Trending down moderately.
Baylor
Record: 3-0 | Elo: 1624.2 (ranked 43 of 365) | Efficiency Margin: +22.93 (ranked 67 of 365)
Offensive Trends:
- FTR (Free Throw Rate (FTM/FGA – getting to the line and converting)): Currently ranked 90 of 365 in D1. Trending up strongly.
Defensive Trends:
- FTR (FTR Allowed (opponent free throws – lower is better)): Currently ranked 19 of 365 in D1. Trending down strongly.
Cincinnati
Record: 3-0 | Elo: 1577.4 (ranked 82 of 365) | Efficiency Margin: +22.41 (ranked 72 of 365)
Offensive Trends:
- FTR (Free Throw Rate (FTM/FGA – getting to the line and converting)): Currently ranked 20 of 365 in D1. Trending up strongly.
- OR_PCT (Offensive Rebound Rate (% of available offensive rebounds grabbed)): Currently ranked 263 of 365 in D1. Trending down strongly.
Colorado
Record: 3-0 | Elo: 1549.7 (ranked 111 of 365) | Efficiency Margin: +10.54 (ranked 146 of 365)
Offensive Trends:
- FTR (Free Throw Rate (FTM/FGA – getting to the line and converting)): Currently ranked 6 of 365 in D1. Trending up strongly.
Defensive Trends:
- EFG (eFG% Allowed (lower is better – opponents shooting less efficiently)): Currently ranked 316 of 365 in D1. Trending up strongly.
- FTR (FTR Allowed (opponent free throws – lower is better)): Currently ranked 182 of 365 in D1. Trending up strongly.
Houston
Record: 3-0 | Elo: 1785.0 (ranked 1 of 365) | Efficiency Margin: +33.89 (ranked 26 of 365)
Insufficient games played for meaningful trend analysis (MACD requires 12+ games).
Iowa State
Record: 3-0 | Elo: 1668.1 (ranked 16 of 365) | Efficiency Margin: +35.61 (ranked 21 of 365)
Offensive Trends:
- FTR (Free Throw Rate (FTM/FGA – getting to the line and converting)): Currently ranked 243 of 365 in D1. Trending down strongly.
Defensive Trends:
- FTR (FTR Allowed (opponent free throws – lower is better)): Currently ranked 130 of 365 in D1. Trending up strongly.
Kansas
Record: 3-1 | Elo: 1628.9 (ranked 39 of 365) | Efficiency Margin: +40.53 (ranked 8 of 365)
Offensive Trends:
- FTR (Free Throw Rate (FTM/FGA – getting to the line and converting)): Currently ranked 159 of 365 in D1. Trending up strongly.
Kansas State
Record: 3-0 | Elo: 1571.8 (ranked 87 of 365) | Efficiency Margin: +21.04 (ranked 79 of 365)
Offensive Trends:
- EFG (Effective Field Goal % (adjusts for 3-pointers being worth more)): Currently ranked 1 of 365 in D1. Trending up strongly.
Oklahoma State
Record: 3-0 | Elo: 1547.0 (ranked 113 of 365) | Efficiency Margin: +26.79 (ranked 46 of 365)
Defensive Trends:
- EFG (eFG% Allowed (lower is better – opponents shooting less efficiently)): Currently ranked 31 of 365 in D1. Trending down strongly.
TCU
Record: 2-2 | Elo: 1532.7 (ranked 132 of 365) | Efficiency Margin: +12.21 (ranked 138 of 365)
Defensive Trends:
- FTR (FTR Allowed (opponent free throws – lower is better)): Currently ranked 33 of 365 in D1. Trending down strongly.
Texas Tech
Record: 3-1 | Elo: 1670.5 (ranked 15 of 365) | Efficiency Margin: +33.29 (ranked 28 of 365)
Defensive Trends:
- FTR (FTR Allowed (opponent free throws – lower is better)): Currently ranked 157 of 365 in D1. Trending up moderately.
UCF
Record: 3-1 | Elo: 1564.8 (ranked 93 of 365) | Efficiency Margin: +19.93 (ranked 84 of 365)
Offensive Trends:
- EFG (Effective Field Goal % (adjusts for 3-pointers being worth more)): Currently ranked 18 of 365 in D1. Trending up strongly.
- FTR (Free Throw Rate (FTM/FGA – getting to the line and converting)): Currently ranked 105 of 365 in D1. Trending up moderately.
Utah
Record: 4-0 | Elo: 1542.0 (ranked 119 of 365) | Efficiency Margin: +14.19 (ranked 121 of 365)
Defensive Trends:
- EFG (eFG% Allowed (lower is better – opponents shooting less efficiently)): Currently ranked 159 of 365 in D1. Trending up strongly.
West Virginia
Record: 4-0 | Elo: 1569.8 (ranked 89 of 365) | Efficiency Margin: +24.56 (ranked 61 of 365)
Offensive Trends:
- FTR (Free Throw Rate (FTM/FGA – getting to the line and converting)): Currently ranked 45 of 365 in D1. Trending up strongly.
Defensive Trends:
- FTR (FTR Allowed (opponent free throws – lower is better)): Currently ranked 140 of 365 in D1. Trending up moderately.
- DR_PCT (Defensive Rebound Rate (% of available defensive rebounds secured)): Currently ranked 17 of 365 in D1. Trending up strongly.
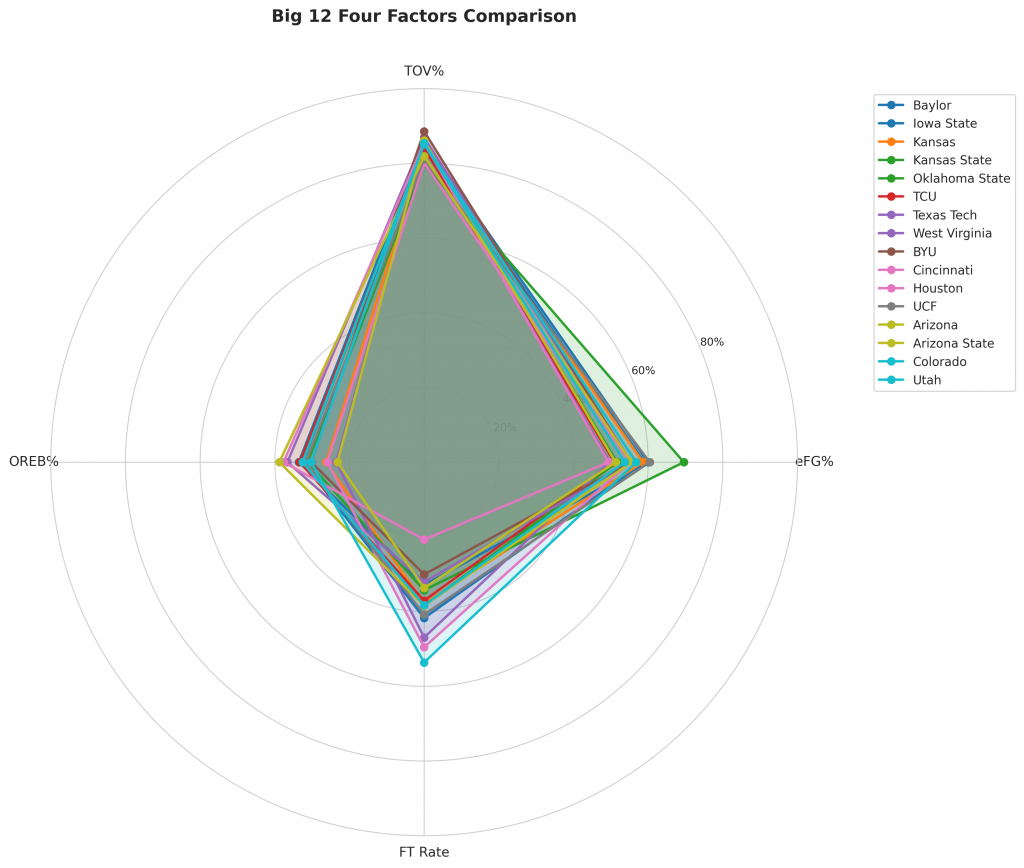
Figure 2: Four Factors comparison across Big 12 teams. The radar chart shows each team’s offensive efficiency (eFG%), ball security (TOV%), rebounding (OREB%), and free throw generation (FT Rate).
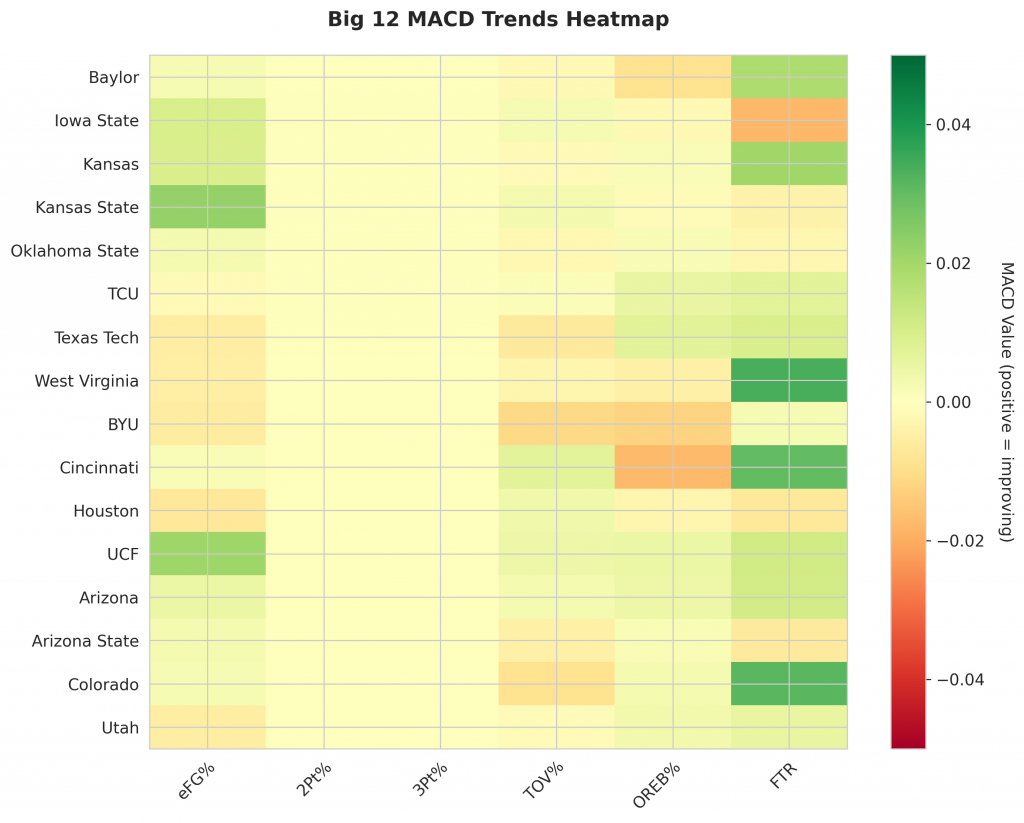
Figure 3: MACD trends heatmap showing which metrics are improving (green) or declining (red) for each team. Stronger colors indicate more pronounced trends.
Looking Ahead
As Big 12 teams continue their season, the MACD trending indicators will help identify which teams are genuinely improving versus those riding unsustainable momentum. Check back next week for updated analysis.
Metrics Glossary
Four Factors (Dean Oliver’s framework for basketball success):
- eFG% (Effective Field Goal %): Field goal percentage adjusted for 3-pointers being worth more (FGM + 0.5×3PM) / FGA. Higher is better offensively, lower is better defensively.
- TOV% (Turnover Rate): Turnovers per 100 possessions. Lower is better offensively (taking care of the ball), higher is better defensively (forcing turnovers).
- OREB% / DREB% (Offensive/Defensive Rebound Rate): Percentage of available rebounds grabbed. Offensive rebounds create second-chance points; defensive rebounds end opponent possessions.
- FTR (Free Throw Rate): Free throws made per field goal attempt (FTM/FGA). Measures ability to get to the line AND convert. Higher is better offensively, lower is better defensively.
Other Metrics:
- Elo Rating: Chess-style rating system that updates based on game results and opponent strength. Higher Elo indicates stronger team.
- Efficiency Margin: Point differential per 100 possessions (Offensive Efficiency – Defensive Efficiency). Accounts for pace of play.
- MACD (Moving Average Convergence Divergence): Trend indicator comparing 12-game and 26-game exponential moving averages. Positive MACD = improving trend, Negative MACD = declining trend.
Analysis powered by HoopSci’s advanced metrics and MACD trending indicators.