Ohio Valley Update: Week 2
November 19, 2025The Ohio Valley enters Week 2 with teams showing diverse trending patterns. This analysis examines each team’s performance trends using MACD (Moving Average Convergence Divergence) indicators to identify not just where teams stand, but where they’re headed.
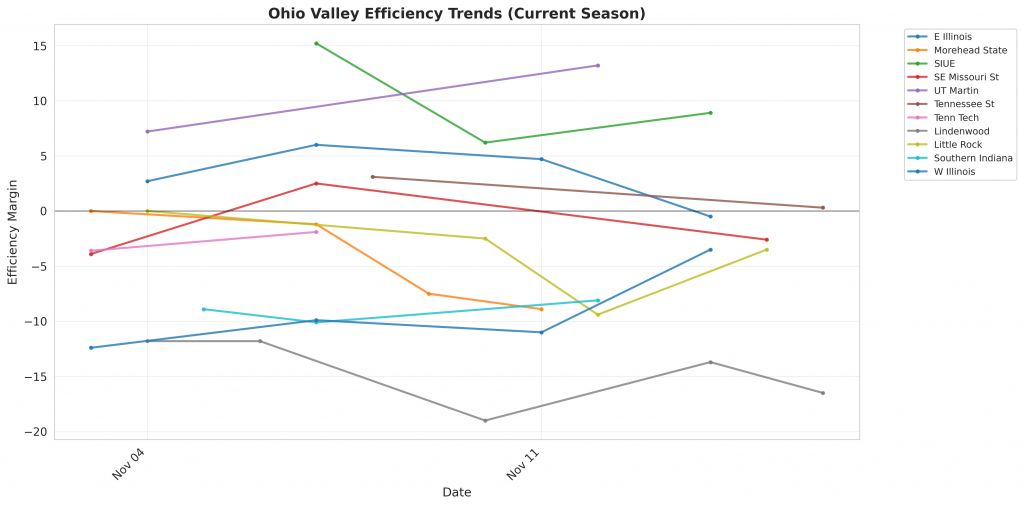
Figure 1: Efficiency margin trends for Ohio Valley teams throughout the season. Teams trending upward show improving performance, while downward trends indicate struggles.
Conference Snapshot
- Week Dates: November 10 – November 16, 2025
- Trending Up (Efficiency): UT Martin, Tenn Tech
- Trending Down (Efficiency): E Illinois, Morehead State, SIUE, SE Missouri St, Tennessee St
Team-by-Team Analysis
E Illinois
Record: 1-3 | Elo: 1400.4 (ranked 315 of 365) | Efficiency Margin: -0.54 (ranked 246 of 365)
Offensive Trends:
- Shooting (Shooting): Currently ranked 340 of 365 in D1. Trending down strongly.
- Off Reb Pct (Offensive Rebounding): Currently ranked 300 of 365 in D1. Trending down strongly.
Defensive Trends:
- Def Reb Pct (Defensive Rebounding): Currently ranked 222 of 365 in D1. Trending down strongly.
- Opp FGM Per Poss (Opp FG Makes Per Possession (%)): Currently ranked 180 of 365 in D1. Trending up strongly.
Lindenwood
Record: 2-3 | Elo: 1412.6 (ranked 304 of 365) | Efficiency Margin: -16.51 (ranked 352 of 365)
Offensive Trends:
- Balls Stolen Per Poss (Balls Stolen Per Possession): Currently ranked 333 of 365 in D1. Trending up strongly.
- Off Tempo (Offensive Possessions Per Game): Currently ranked 55 of 365 in D1. Trending up strongly.
Defensive Trends:
- Opp Shooting (Opp Shooting): Currently ranked 342 of 365 in D1. Trending up strongly.
- Def Reb Pct (Defensive Rebounding): Currently ranked 197 of 365 in D1. Trending down strongly.
Little Rock
Record: 2-2 | Elo: 1487.7 (ranked 204 of 365) | Efficiency Margin: -3.51 (ranked 282 of 365)
Offensive Trends:
- Turnovers (Turnovers): Currently ranked 362 of 365 in D1. Trending up strongly.
- FGM Per Poss (Field Goal Makes Per Possession (%)): Currently ranked 218 of 365 in D1. Trending down strongly.
Defensive Trends:
- Opp Shooting (Opp Shooting): Currently ranked 328 of 365 in D1. Trending up strongly.
- Opp FGM Per Poss (Opp FG Makes Per Possession (%)): Currently ranked 312 of 365 in D1. Trending up strongly.
Morehead State
Record: 1-3 | Elo: 1460.7 (ranked 244 of 365) | Efficiency Margin: -8.94 (ranked 321 of 365)
Offensive Trends:
- Shooting (Shooting): Currently ranked 245 of 365 in D1. Trending down strongly.
- FT Rate (FTA/FGA (%)): Currently ranked 360 of 365 in D1. Trending down strongly.
Defensive Trends:
- Opp Shooting (Opp Shooting): Currently ranked 345 of 365 in D1. Trending up strongly.
- Def Reb Pct (Defensive Rebounding): Currently ranked 298 of 365 in D1. Trending down strongly.
SE Missouri St
Record: 0-3 | Elo: 1463.9 (ranked 238 of 365) | Efficiency Margin: -2.59 (ranked 271 of 365)
Offensive Trends:
- Off Reb Pct (Offensive Rebounding): Currently ranked 331 of 365 in D1. Trending down strongly.
- FGM Per Poss (Field Goal Makes Per Possession (%)): Currently ranked 237 of 365 in D1. Trending down strongly.
Defensive Trends:
- Opp Shooting (Opp Shooting): Currently ranked 351 of 365 in D1. Trending up strongly.
- Def Reb Pct (Defensive Rebounding): Currently ranked 242 of 365 in D1. Trending down strongly.
SIUE
Record: 2-1 | Elo: 1522.7 (ranked 150 of 365) | Efficiency Margin: +8.93 (ranked 156 of 365)
Offensive Trends:
- Shooting (Shooting): Currently ranked 281 of 365 in D1. Trending down strongly.
- Adj Off Eff (Adjusted Offensive Efficiency): Currently ranked 321 of 365 in D1. Trending down strongly.
Defensive Trends:
- Def Reb Pct (Defensive Rebounding): Currently ranked 269 of 365 in D1. Trending down strongly.
- Opp FGA Per Poss (Opp FG Attempts Per Possession (%)): Currently ranked 333 of 365 in D1. Trending up strongly.
Southern Indiana
Record: 0-3 | Elo: 1344.9 (ranked 350 of 365) | Efficiency Margin: -8.15 (ranked 317 of 365)
Offensive Trends:
- Shooting (Shooting): Currently ranked 360 of 365 in D1. Trending down strongly.
- FGM Per Poss (Field Goal Makes Per Possession (%)): Currently ranked 352 of 365 in D1. Trending down strongly.
Defensive Trends:
- Def Reb Pct (Defensive Rebounding): Currently ranked 287 of 365 in D1. Trending down strongly.
- Opp FTA Per Poss (Opp Free Throw Attempts Per Possession (%)): Currently ranked 328 of 365 in D1. Trending up strongly.
Tenn Tech
Record: 0-2 | Elo: 1406.3 (ranked 310 of 365) | Efficiency Margin: -1.88 (ranked 262 of 365)
Offensive Trends:
- Turnovers (Turnovers): Currently ranked 357 of 365 in D1. Trending up strongly.
- FT Pct (FTM/FTA (%)): Currently ranked 365 of 365 in D1. Trending down strongly.
Defensive Trends:
- Opp Shooting (Opp Shooting): Currently ranked 267 of 365 in D1. Trending up strongly.
- Opp Turnovers (Opp Turnovers): Currently ranked 63 of 365 in D1. Trending up strongly.
Tennessee St
Record: 0-2 | Elo: 1460.3 (ranked 245 of 365) | Efficiency Margin: +0.32 (ranked 238 of 365)
Offensive Trends:
- Off Reb Pct (Offensive Rebounding): Currently ranked 189 of 365 in D1. Trending down strongly.
- 2PM Per Poss (2 Point Makes Per Possession (%)): Currently ranked 312 of 365 in D1. Trending down strongly.
Defensive Trends:
- Opp Shooting (Opp Shooting): Currently ranked 319 of 365 in D1. Trending up strongly.
- Def Reb Pct (Defensive Rebounding): Currently ranked 349 of 365 in D1. Trending down strongly.
UT Martin
Record: 2-0 | Elo: 1474.2 (ranked 223 of 365) | Efficiency Margin: +13.22 (ranked 127 of 365)
Offensive Trends:
- Shooting (Shooting): Currently ranked 18 of 365 in D1. Trending up strongly.
- Turnovers (Turnovers): Currently ranked 352 of 365 in D1. Trending up strongly.
Defensive Trends:
- Opp Turnovers (Opp Turnovers): Currently ranked 24 of 365 in D1. Trending up strongly.
- Def Reb Pct (Defensive Rebounding): Currently ranked 306 of 365 in D1. Trending down strongly.
W Illinois
Record: 0-4 | Elo: 1402.3 (ranked 313 of 365) | Efficiency Margin: -3.46 (ranked 280 of 365)
Offensive Trends:
- Off Reb Pct (Offensive Rebounding): Currently ranked 254 of 365 in D1. Trending down strongly.
- FGA Per Poss (Field Goal Attempts Per Possession (%)): Currently ranked 242 of 365 in D1. Trending down strongly.
Defensive Trends:
- Def Reb Pct (Defensive Rebounding): Currently ranked 180 of 365 in D1. Trending down strongly.
- Opp FGA Per Poss (Opp FG Attempts Per Possession (%)): Currently ranked 317 of 365 in D1. Trending up strongly.
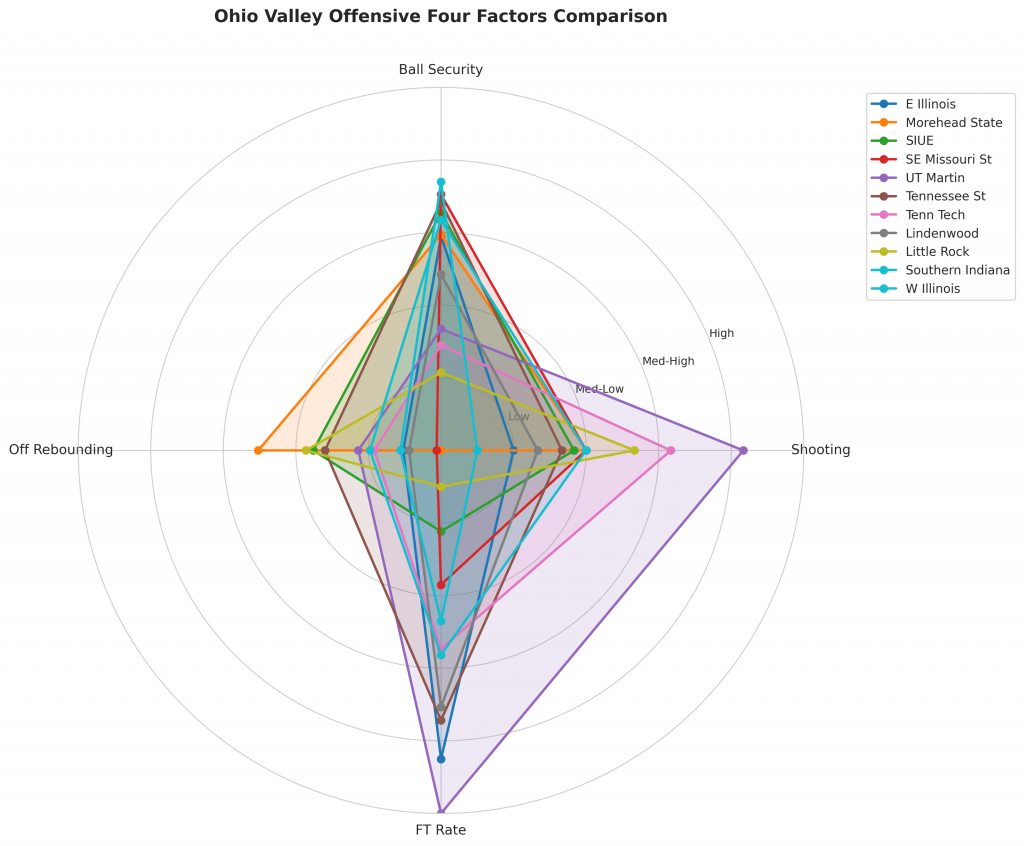
Figure 2: Offensive Four Factors comparison across Ohio Valley teams. The radar chart shows each team’s shooting efficiency (eFG%), ball security (TOV%), offensive rebounding (OREB%), and free throw generation (FT Rate).
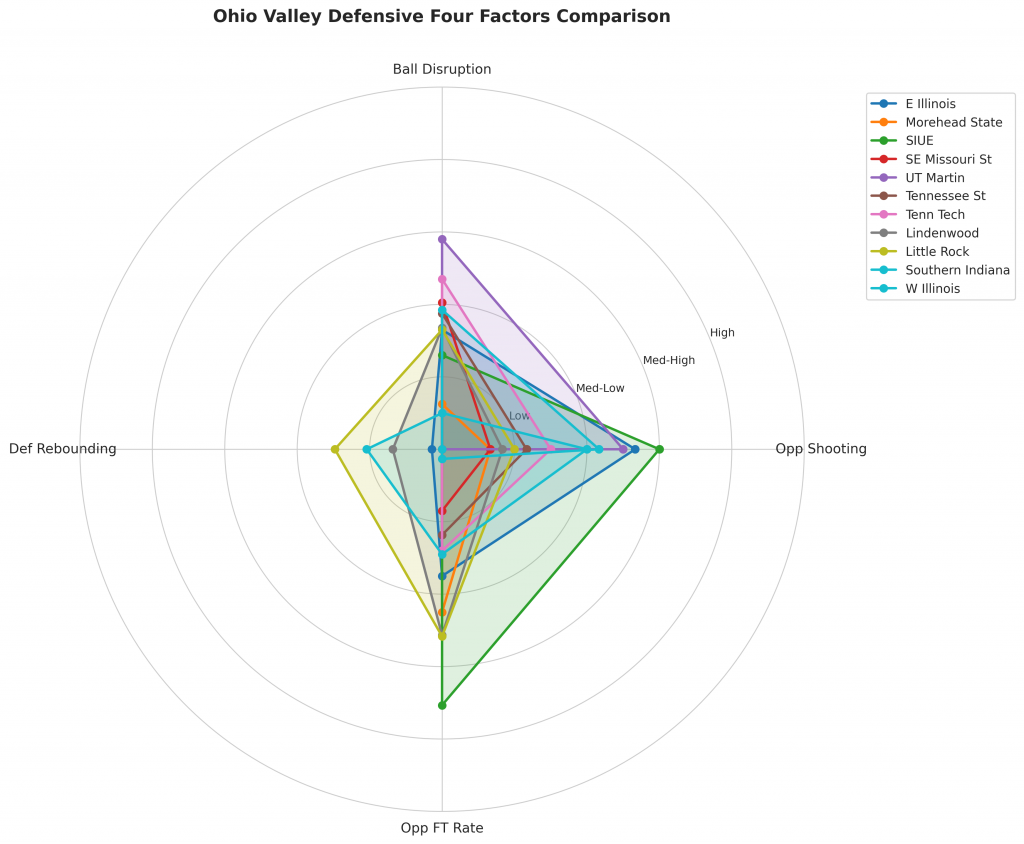
Figure 3: Defensive Four Factors comparison across Ohio Valley teams. The radar chart shows each team’s opponent shooting defense (Opp eFG%), ball disruption (forcing TOV%), defensive rebounding (DREB%), and opponent free throw prevention (Opp FT Rate).
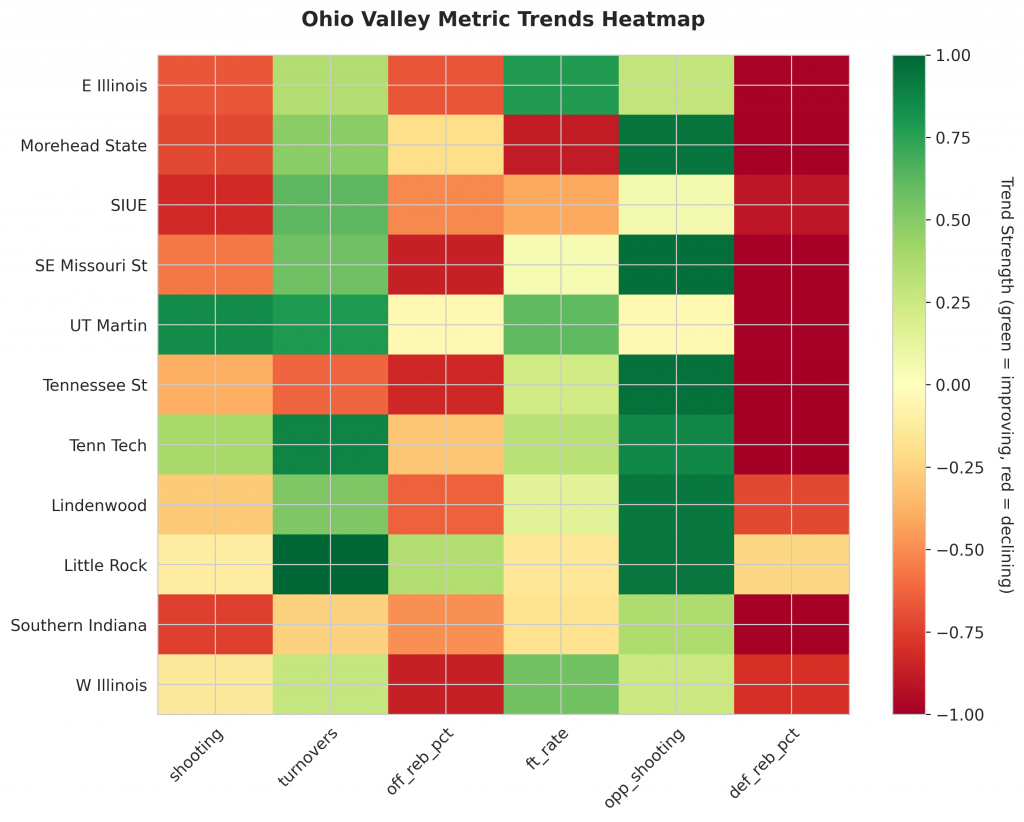
Figure 4: MACD trends heatmap showing which metrics are improving (green) or declining (red) for each team. Stronger colors indicate more pronounced trends.
Looking Ahead
As Ohio Valley teams continue their season, the MACD trending indicators will help identify which teams are genuinely improving versus those riding unsustainable momentum. Check back next week for updated analysis.
Metrics Glossary
Four Factors (Dean Oliver’s framework for basketball success):
- eFG% (Effective Field Goal %): Field goal percentage adjusted for 3-pointers being worth more (FGM + 0.5×3PM) / FGA. Higher is better offensively, lower is better defensively.
- TOV% (Turnover Rate): Turnovers per 100 possessions. Lower is better offensively (taking care of the ball), higher is better defensively (forcing turnovers).
- OREB% / DREB% (Offensive/Defensive Rebound Rate): Percentage of available rebounds grabbed. Offensive rebounds create second-chance points; defensive rebounds end opponent possessions.
- FTR (Free Throw Rate): Free throws made per field goal attempt (FTM/FGA). Measures ability to get to the line AND convert. Higher is better offensively, lower is better defensively.
Other Metrics:
- Elo Rating: Chess-style rating system that updates based on game results and opponent strength. Higher Elo indicates stronger team.
- Efficiency Margin: Point differential per 100 possessions (Offensive Efficiency – Defensive Efficiency). Accounts for pace of play.
- MACD (Moving Average Convergence Divergence): Trend indicator comparing 12-game and 26-game exponential moving averages. Positive MACD = improving trend, Negative MACD = declining trend.
Analysis powered by HoopSci’s advanced metrics and MACD trending indicators.