Ohio Valley Update: Week 4
December 1, 2025The Ohio Valley enters Week 4 with teams showing diverse trending patterns. This analysis examines each team’s performance trends using MACD (Moving Average Convergence Divergence) indicators to identify not just where teams stand, but where they’re headed.
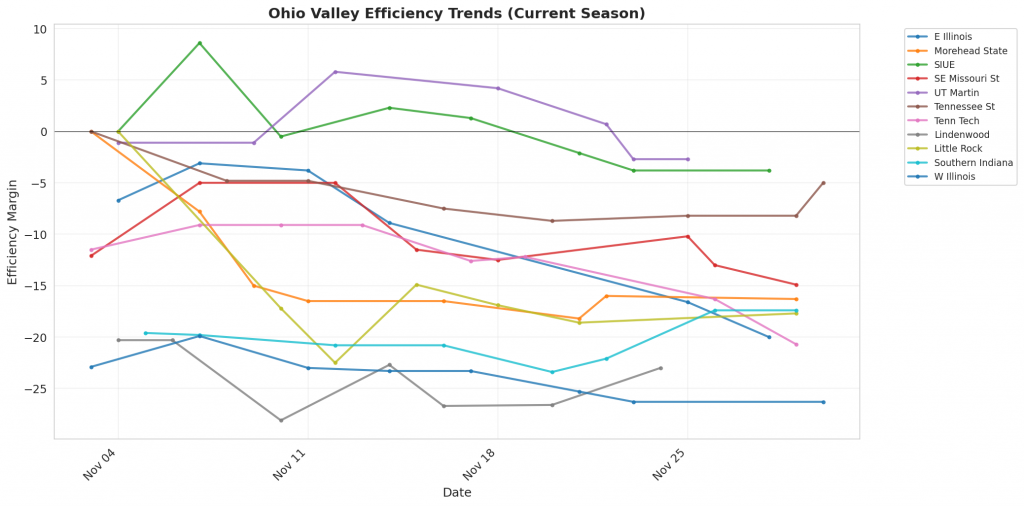
Figure 1: Efficiency margin trends for Ohio Valley teams throughout the season. Teams trending upward show improving performance, while downward trends indicate struggles.
Conference Snapshot
- Week Dates: November 24 – November 30, 2025
- Trending Up (Efficiency): E Illinois, Morehead State, SIUE, UT Martin, Southern Indiana
- Trending Down (Efficiency): SE Missouri St, Tennessee St, Tenn Tech, Lindenwood, Little Rock
Team-by-Team Analysis
E Illinois
Record: 1-5 | Elo: 1390.5 (ranked 321 of 365) | Efficiency Margin: -20.02 (ranked 319 of 365)
Offensive Trends:
- Turnovers (Turnovers): Currently ranked 302 of 365 in D1. Trending up strongly 🔴.
- Off Reb Pct (Offensive Rebounding): Currently ranked 360 of 365 in D1. Trending down strongly 🔴.
Defensive Trends:
- Opp Shooting (Opp Shooting): Currently ranked 308 of 365 in D1. Trending up strongly 🔴.
- Def Reb Pct (Defensive Rebounding): Currently ranked 358 of 365 in D1. Trending down strongly 🔴.
Lindenwood
Record: 3-4 | Elo: 1416.4 (ranked 293 of 365) | Efficiency Margin: -23.00 (ranked 337 of 365)
Offensive Trends:
- Assists per FGM (Assists/FGM (%)): Currently ranked 205 of 365 in D1. Trending up strongly 🟢.
- Off Tempo (Offensive Possessions Per Game): Currently ranked 46 of 365 in D1. Trending up strongly 🟢.
Defensive Trends:
- Opp FGA Per Poss (Opp FG Attempts Per Possession (%)): Currently ranked 114 of 365 in D1. Trending down strongly 🟢.
- Opp Assists per FGM (Opp Assists/FGM (%)): Currently ranked 317 of 365 in D1. Trending up strongly 🔴.
Little Rock
Record: 2-5 | Elo: 1467.4 (ranked 231 of 365) | Efficiency Margin: -17.66 (ranked 305 of 365)
Offensive Trends:
- Turnovers (Turnovers): Currently ranked 365 of 365 in D1. Trending up strongly 🔴.
- 3PM Per Poss (3 Point Makes Per Possession (%)): Currently ranked 322 of 365 in D1. Trending down strongly 🔴.
Defensive Trends:
- Opp Shooting (Opp Shooting): Currently ranked 359 of 365 in D1. Trending up strongly 🔴.
- Opp FGM Per Poss (Opp FG Makes Per Possession (%)): Currently ranked 335 of 365 in D1. Trending up strongly 🔴.
Morehead State
Record: 3-5 | Elo: 1450.7 (ranked 254 of 365) | Efficiency Margin: -16.26 (ranked 289 of 365)
Offensive Trends:
- Turnovers (Turnovers): Currently ranked 346 of 365 in D1. Trending up strongly 🔴.
- Off Reb Pct (Offensive Rebounding): Currently ranked 44 of 365 in D1. Trending up strongly 🟢.
Defensive Trends:
- Def Reb Pct (Defensive Rebounding): Currently ranked 336 of 365 in D1. Trending down strongly 🔴.
- Opp FGA Per Poss (Opp FG Attempts Per Possession (%)): Currently ranked 354 of 365 in D1. Trending up strongly 🔴.
SE Missouri St
Record: 2-6 | Elo: 1451.1 (ranked 253 of 365) | Efficiency Margin: -14.94 (ranked 280 of 365)
Offensive Trends:
- Off Reb Pct (Offensive Rebounding): Currently ranked 177 of 365 in D1. Trending up strongly 🟢.
- 3PM Per Poss (3 Point Makes Per Possession (%)): Currently ranked 326 of 365 in D1. Trending down strongly 🔴.
Defensive Trends:
- Opp Shooting (Opp Shooting): Currently ranked 345 of 365 in D1. Trending up strongly 🔴.
- Opp FT Rate (Opp FTA/FGA (%)): Currently ranked 357 of 365 in D1. Trending up strongly 🔴.
SIUE
Record: 5-3 | Elo: 1515.3 (ranked 164 of 365) | Efficiency Margin: -3.76 (ranked 194 of 365)
Offensive Trends:
- Off Reb Pct (Offensive Rebounding): Currently ranked 45 of 365 in D1. Trending up strongly 🟢.
- Adj Off Eff (Adjusted Offensive Efficiency): Currently ranked 269 of 365 in D1. Trending down strongly 🔴.
Defensive Trends:
- Opp Turnovers (Opp Turnovers): Currently ranked 344 of 365 in D1. Trending down strongly 🟢.
- Def Reb Pct (Defensive Rebounding): Currently ranked 225 of 365 in D1. Trending down strongly 🔴.
Southern Indiana
Record: 3-5 | Elo: 1346.9 (ranked 352 of 365) | Efficiency Margin: -17.37 (ranked 301 of 365)
Offensive Trends:
- Off Reb Pct (Offensive Rebounding): Currently ranked 65 of 365 in D1. Trending up strongly 🟢.
- Adj Off Eff (Adjusted Offensive Efficiency): Currently ranked 350 of 365 in D1. Trending down strongly 🔴.
Defensive Trends:
- Opp Shooting (Opp Shooting): Currently ranked 74 of 365 in D1. Trending down strongly 🟢.
- Opp FG Pct (%) (Opp FGM/FGA (%)): Currently ranked 134 of 365 in D1. Trending down strongly 🟢.
Tenn Tech
Record: 3-5 | Elo: 1399.1 (ranked 313 of 365) | Efficiency Margin: -20.70 (ranked 322 of 365)
Offensive Trends:
- Off Reb Pct (Offensive Rebounding): Currently ranked 78 of 365 in D1. Trending up strongly 🟢.
- 2Pt Rate (2 Point Attempts/FGA (%)): Currently ranked 199 of 365 in D1. Trending up strongly 🟢.
Defensive Trends:
- Opp Shooting (Opp Shooting): Currently ranked 294 of 365 in D1. Trending up strongly 🔴.
- Def Reb Pct (Defensive Rebounding): Currently ranked 269 of 365 in D1. Trending down strongly 🔴.
Tennessee St
Record: 5-3 | Elo: 1488.8 (ranked 200 of 365) | Efficiency Margin: -5.03 (ranked 205 of 365)
Offensive Trends:
- Off Reb Pct (Offensive Rebounding): Currently ranked 6 of 365 in D1. Trending up strongly 🟢.
- 2Pt Rate (2 Point Attempts/FGA (%)): Currently ranked 58 of 365 in D1. Trending up strongly 🟢.
Defensive Trends:
- Opp FGA Per Poss (Opp FG Attempts Per Possession (%)): Currently ranked 7 of 365 in D1. Trending down strongly 🟢.
- Opp FG Pct (%) (Opp FGM/FGA (%)): Currently ranked 320 of 365 in D1. Trending up strongly 🔴.
UT Martin
Record: 5-2 | Elo: 1462.4 (ranked 239 of 365) | Efficiency Margin: -2.66 (ranked 187 of 365)
Offensive Trends:
- Turnovers (Turnovers): Currently ranked 364 of 365 in D1. Trending up strongly 🔴.
- Off Reb Pct (Offensive Rebounding): Currently ranked 24 of 365 in D1. Trending up strongly 🟢.
Defensive Trends:
- Opp Turnovers (Opp Turnovers): Currently ranked 230 of 365 in D1. Trending down strongly 🟢.
- Def Reb Pct (Defensive Rebounding): Currently ranked 230 of 365 in D1. Trending down strongly 🔴.
W Illinois
Record: 2-6 | Elo: 1376.4 (ranked 330 of 365) | Efficiency Margin: -26.28 (ranked 347 of 365)
Offensive Trends:
- Off Reb Pct (Offensive Rebounding): Currently ranked 53 of 365 in D1. Trending up strongly 🟢.
- FT Pct (FTM/FTA (%)): Currently ranked 326 of 365 in D1. Trending down strongly 🔴.
Defensive Trends:
- Opp 2Pt Rate (Opp 2 Point Attempts/FGA (%)): Currently ranked 146 of 365 in D1. Trending down strongly 🟢.
- Opp 2PM Per Poss (Opp 2 Point Makes Per Possession (%)): Currently ranked 235 of 365 in D1. Trending down strongly 🟢.

Figure 2: Offensive Four Factors comparison across Ohio Valley teams. The radar chart shows each team’s shooting efficiency (eFG%), ball security (TOV%), offensive rebounding (OREB%), and free throw generation (FT Rate).
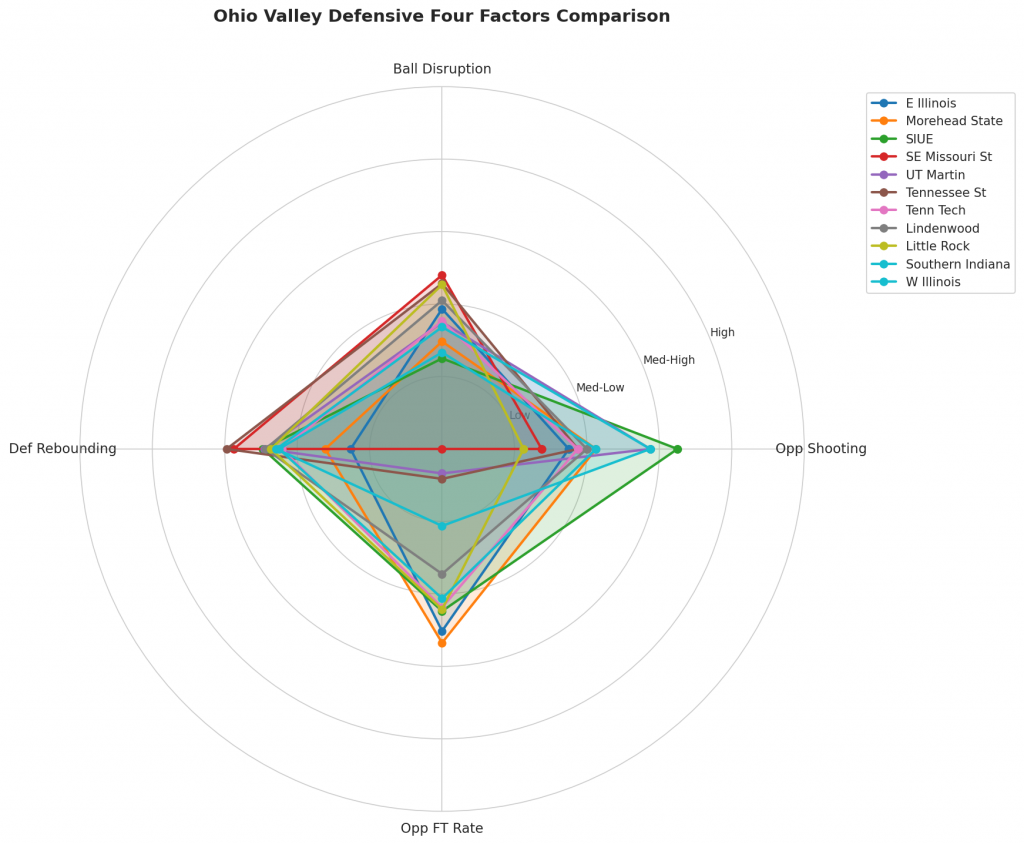
Figure 3: Defensive Four Factors comparison across Ohio Valley teams. The radar chart shows each team’s opponent shooting defense (Opp eFG%), ball disruption (forcing TOV%), defensive rebounding (DREB%), and opponent free throw prevention (Opp FT Rate).

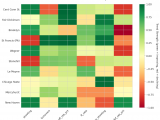
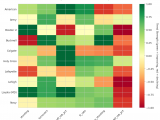
Figure 4: MACD trends heatmap showing which metrics are improving (green) or declining (red) for each team. Stronger colors indicate more pronounced trends.
Looking Ahead
As Ohio Valley teams continue their season, the MACD trending indicators will help identify which teams are genuinely improving versus those riding unsustainable momentum. Check back next week for updated analysis.
Metrics Glossary
Four Factors (Dean Oliver’s framework for basketball success):
- eFG% (Effective Field Goal %): Field goal percentage adjusted for 3-pointers being worth more (FGM + 0.5×3PM) / FGA. Higher is better offensively, lower is better defensively.
- TOV% (Turnover Rate): Turnovers per 100 possessions. Lower is better offensively (taking care of the ball), higher is better defensively (forcing turnovers).
- OREB% / DREB% (Offensive/Defensive Rebound Rate): Percentage of available rebounds grabbed. Offensive rebounds create second-chance points; defensive rebounds end opponent possessions.
- FTR (Free Throw Rate): Free throws made per field goal attempt (FTM/FGA). Measures ability to get to the line AND convert. Higher is better offensively, lower is better defensively.
Other Metrics:
- Elo Rating: Chess-style rating system that updates based on game results and opponent strength. Higher Elo indicates stronger team.
- Efficiency Margin: Point differential per 100 possessions (Offensive Efficiency – Defensive Efficiency). Accounts for pace of play.
- MACD (Moving Average Convergence Divergence): Trend indicator comparing 12-game and 26-game exponential moving averages. Positive MACD = improving trend, Negative MACD = declining trend.
Analysis powered by HoopSci’s advanced metrics and MACD trending indicators.