Summit League Update: Week 6
December 15, 2025The Summit League enters Week 6 with teams showing diverse trending patterns. This analysis examines each team’s performance trends using MACD (Moving Average Convergence Divergence) indicators to identify not just where teams stand, but where they’re headed.
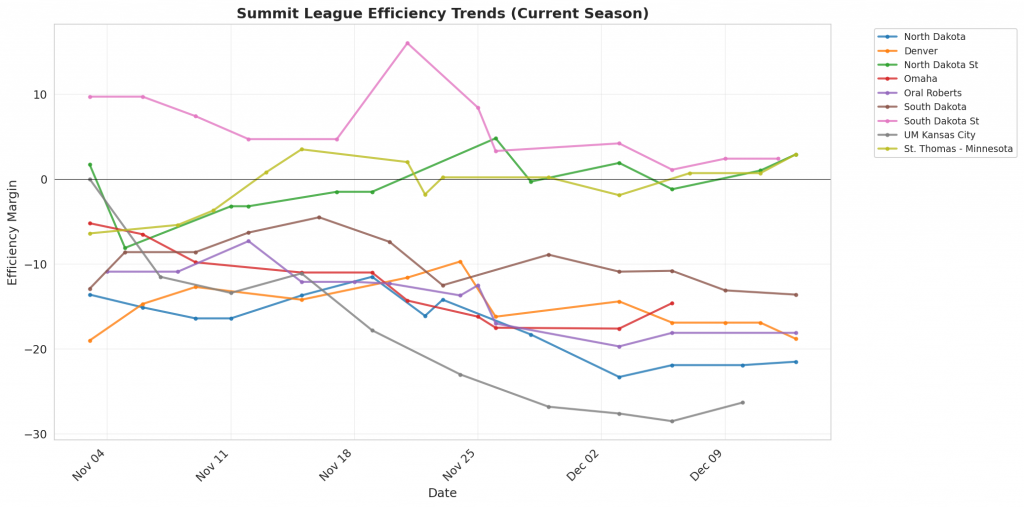
Figure 1: Efficiency margin trends for Summit League teams throughout the season. Teams trending upward show improving performance, while downward trends indicate struggles.
Conference Snapshot
- Week Dates: December 08 – December 14, 2025
- Trending Up (Efficiency): Denver, Oral Roberts, St. Thomas – Minnesota
- Trending Down (Efficiency): North Dakota, North Dakota St, Omaha, South Dakota, South Dakota St
Team-by-Team Analysis
Denver
Record: 5-7 | Elo: 1396.9 (ranked 318 of 365) | Efficiency Margin: -18.78 (ranked 311 of 365)
Offensive Trends:
- Shooting (Shooting): Currently ranked 148 of 365 in D1. Trending up strongly 🟢.
- Off Reb Pct (Offensive Rebounding): Currently ranked 185 of 365 in D1. Trending up strongly 🟢.
Defensive Trends:
- Opp Shooting (Opp Shooting): Currently ranked 364 of 365 in D1. Trending up strongly 🔴.
- Def Reb Pct (Defensive Rebounding): Currently ranked 328 of 365 in D1. Trending down strongly 🔴.
North Dakota
Record: 4-9 | Elo: 1384.6 (ranked 327 of 365) | Efficiency Margin: -21.52 (ranked 322 of 365)
Offensive Trends:
- Shooting (Shooting): Currently ranked 332 of 365 in D1. Trending down strongly 🔴.
- Turnovers (Turnovers): Currently ranked 147 of 365 in D1. Trending up strongly 🔴.
Defensive Trends:
- Opp Turnovers (Opp Turnovers): Currently ranked 18 of 365 in D1. Trending up strongly 🔴.
- Def Reb Pct (Defensive Rebounding): Currently ranked 282 of 365 in D1. Trending down strongly 🔴.
North Dakota St
Record: 9-3 | Elo: 1569.6 (ranked 96 of 365) | Efficiency Margin: +2.90 (ranked 135 of 365)
Offensive Trends:
- Off Reb Pct (Offensive Rebounding): Currently ranked 105 of 365 in D1. Trending up strongly 🟢.
- FT Rate (FTA/FGA (%)): Currently ranked 227 of 365 in D1. Trending up strongly 🟢.
Defensive Trends:
- Opp Turnovers (Opp Turnovers): Currently ranked 35 of 365 in D1. Trending up strongly 🔴.
- Opp FT Rate (Opp FTA/FGA (%)): Currently ranked 123 of 365 in D1. Trending up strongly 🔴.
Omaha
Record: 3-7 | Elo: 1481.7 (ranked 215 of 365) | Efficiency Margin: -14.56 (ranked 285 of 365)
Offensive Trends:
- Shooting (Shooting): Currently ranked 183 of 365 in D1. Trending down strongly 🔴.
- FGM Per Poss (Field Goal Makes Per Possession (%)): Currently ranked 238 of 365 in D1. Trending down strongly 🔴.
Defensive Trends:
- Opp 2Pt Rate (Opp 2 Point Attempts/FGA (%)): Currently ranked 8 of 365 in D1. Trending down strongly 🟢.
- Opp 2PA Per Poss (Opp 2 Point Attempts Per Possession (%)): Currently ranked 13 of 365 in D1. Trending down strongly 🟢.
Oral Roberts
Record: 5-7 | Elo: 1376.7 (ranked 334 of 365) | Efficiency Margin: -18.06 (ranked 307 of 365)
Offensive Trends:
- Turnovers (Turnovers): Currently ranked 310 of 365 in D1. Trending up strongly 🔴.
- Off Reb Pct (Offensive Rebounding): Currently ranked 272 of 365 in D1. Trending up strongly 🟢.
Defensive Trends:
- Opp Turnovers (Opp Turnovers): Currently ranked 194 of 365 in D1. Trending up strongly 🔴.
- Def Reb Pct (Defensive Rebounding): Currently ranked 336 of 365 in D1. Trending down strongly 🔴.
South Dakota
Record: 6-6 | Elo: 1458.1 (ranked 246 of 365) | Efficiency Margin: -13.56 (ranked 277 of 365)
Offensive Trends:
- Turnovers (Turnovers): Currently ranked 259 of 365 in D1. Trending up strongly 🔴.
- FT Rate (FTA/FGA (%)): Currently ranked 10 of 365 in D1. Trending up strongly 🟢.
Defensive Trends:
- Opp Shooting (Opp Shooting): Currently ranked 294 of 365 in D1. Trending up strongly 🔴.
- Opp FGM Per Poss (Opp FG Makes Per Possession (%)): Currently ranked 332 of 365 in D1. Trending up strongly 🔴.
South Dakota St
Record: 7-5 | Elo: 1539.3 (ranked 127 of 365) | Efficiency Margin: +2.38 (ranked 141 of 365)
Offensive Trends:
- Off Reb Pct (Offensive Rebounding): Currently ranked 150 of 365 in D1. Trending up strongly 🟢.
- FT Pct (FTM/FTA (%)): Currently ranked 258 of 365 in D1. Trending down strongly 🔴.
Defensive Trends:
- Opp Turnovers (Opp Turnovers): Currently ranked 171 of 365 in D1. Trending up strongly 🔴.
- Def Reb Pct (Defensive Rebounding): Currently ranked 6 of 365 in D1. Trending down strongly 🔴.
St. Thomas – Minnesota
Record: 9-4 | Elo: 1563.7 (ranked 99 of 365) | Efficiency Margin: +2.87 (ranked 136 of 365)
Offensive Trends:
- Off Reb Pct (Offensive Rebounding): Currently ranked 364 of 365 in D1. Trending up strongly 🟢.
- 2PM Per Poss (2 Point Makes Per Possession (%)): Currently ranked 126 of 365 in D1. Trending up strongly 🟢.
Defensive Trends:
- Opp FT Pct (Opp FTM/FTA (%)): Currently ranked 225 of 365 in D1. Trending down strongly 🟢.
- Opp Points per Poss (Opp Points per Possession): Currently ranked 124 of 365 in D1. Trending down strongly 🟢.
UM Kansas City
Record: 1-9 | Elo: 1358.6 (ranked 349 of 365) | Efficiency Margin: -26.33 (ranked 348 of 365)
Offensive Trends:
- Shooting (Shooting): Currently ranked 350 of 365 in D1. Trending down strongly 🔴.
- Turnovers (Turnovers): Currently ranked 322 of 365 in D1. Trending up strongly 🔴.
Defensive Trends:
- Opp Turnovers (Opp Turnovers): Currently ranked 103 of 365 in D1. Trending up strongly 🔴.
- Def Reb Pct (Defensive Rebounding): Currently ranked 338 of 365 in D1. Trending down strongly 🔴.
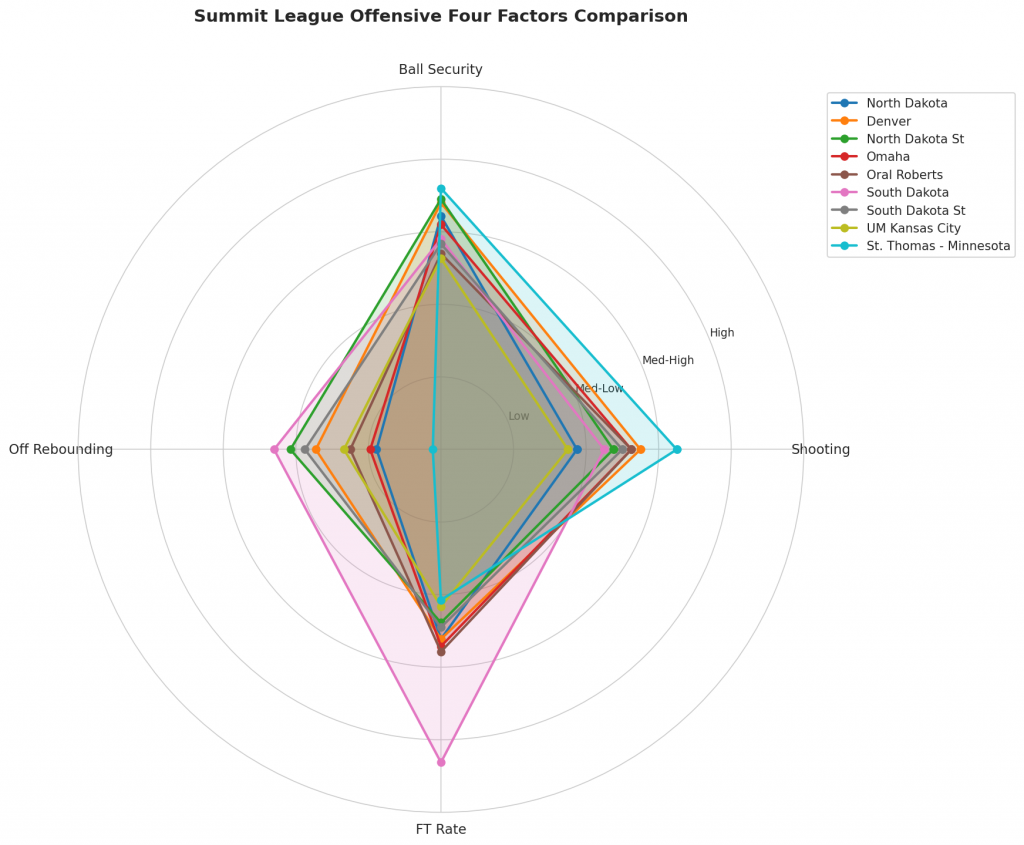
Figure 2: Offensive Four Factors comparison across Summit League teams. The radar chart shows each team’s shooting efficiency (eFG%), ball security (TOV%), offensive rebounding (OREB%), and free throw generation (FT Rate).
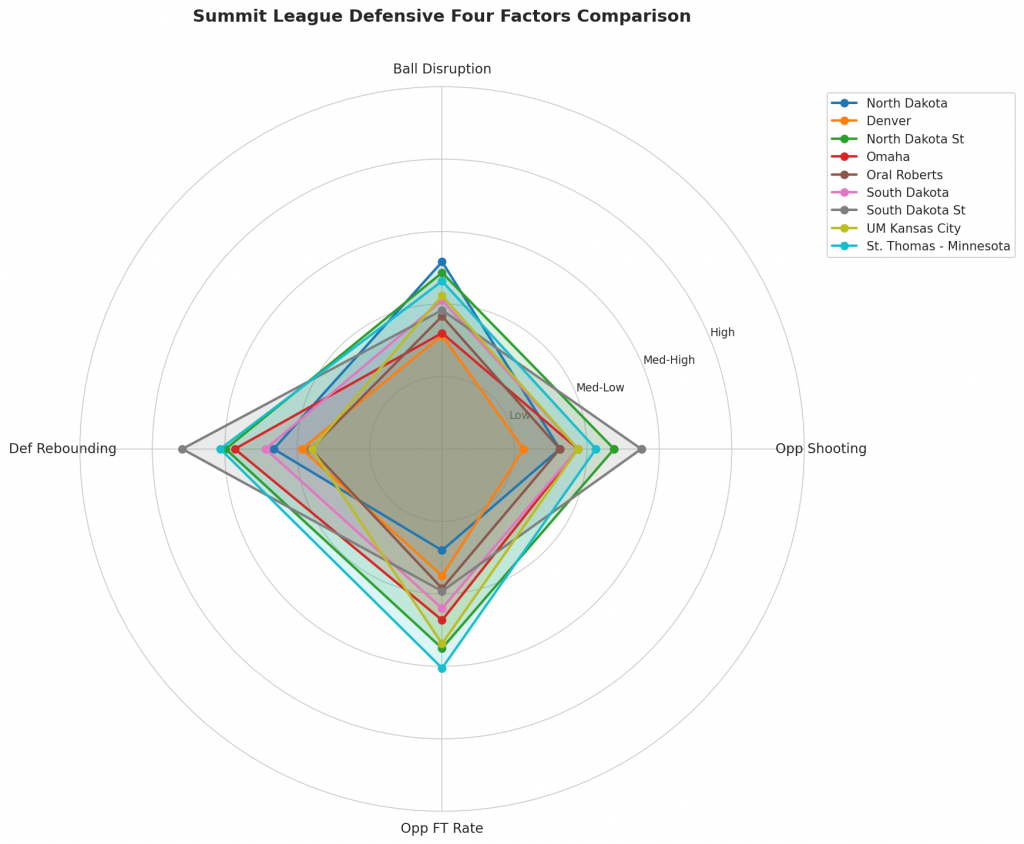
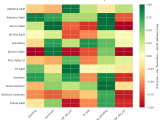
Figure 3: Defensive Four Factors comparison across Summit League teams. The radar chart shows each team’s opponent shooting defense (Opp eFG%), ball disruption (forcing TOV%), defensive rebounding (DREB%), and opponent free throw prevention (Opp FT Rate).
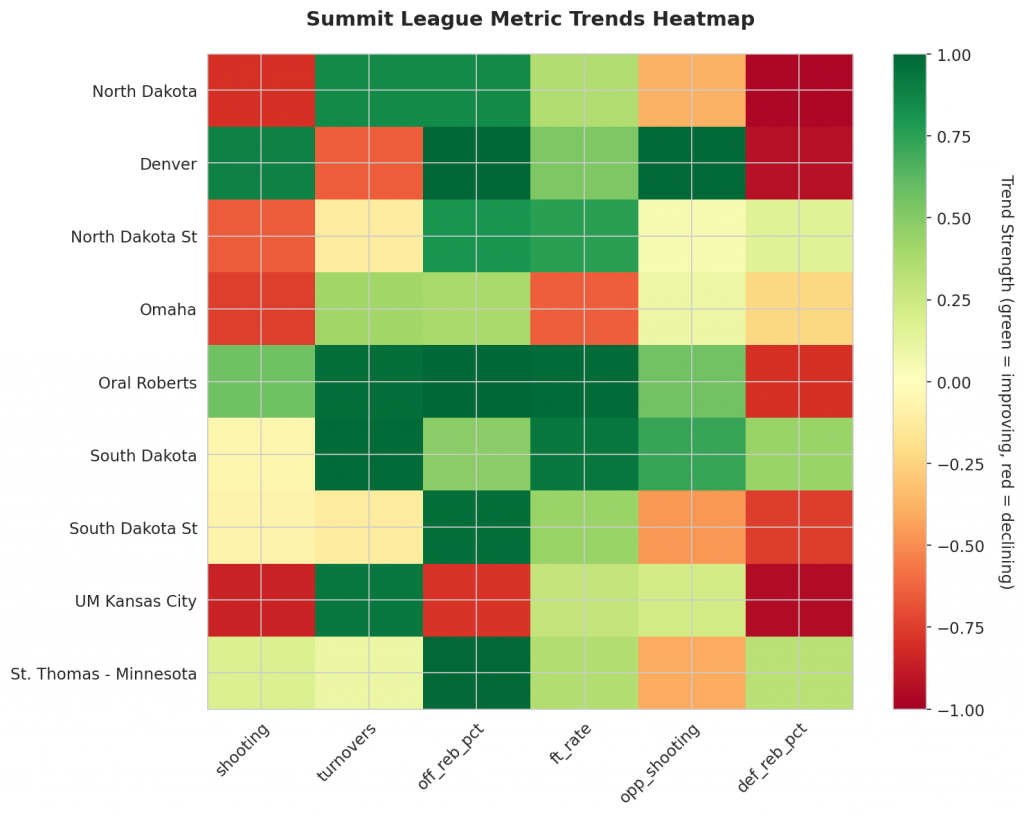
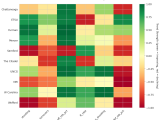
Figure 4: MACD trends heatmap showing which metrics are improving (green) or declining (red) for each team. Stronger colors indicate more pronounced trends.
Looking Ahead
As Summit League teams continue their season, the MACD trending indicators will help identify which teams are genuinely improving versus those riding unsustainable momentum. Check back next week for updated analysis.
Metrics Glossary
Four Factors (Dean Oliver’s framework for basketball success):
- eFG% (Effective Field Goal %): Field goal percentage adjusted for 3-pointers being worth more (FGM + 0.5×3PM) / FGA. Higher is better offensively, lower is better defensively.
- TOV% (Turnover Rate): Turnovers per 100 possessions. Lower is better offensively (taking care of the ball), higher is better defensively (forcing turnovers).
- OREB% / DREB% (Offensive/Defensive Rebound Rate): Percentage of available rebounds grabbed. Offensive rebounds create second-chance points; defensive rebounds end opponent possessions.
- FTR (Free Throw Rate): Free throws made per field goal attempt (FTM/FGA). Measures ability to get to the line AND convert. Higher is better offensively, lower is better defensively.
Other Metrics:
- Elo Rating: Chess-style rating system that updates based on game results and opponent strength. Higher Elo indicates stronger team.
- Efficiency Margin: Point differential per 100 possessions (Offensive Efficiency – Defensive Efficiency). Accounts for pace of play.
- MACD (Moving Average Convergence Divergence): Trend indicator comparing 12-game and 26-game exponential moving averages. Positive MACD = improving trend, Negative MACD = declining trend.
Analysis powered by HoopSci’s advanced metrics and MACD trending indicators.