Week 7: The Dial-Up Report
December 23, 2025Some teams are enigmas. They rise to the occasion against top-tier competition, looking like tournament contenders, only to turn around and sleepwalk through games against inferior opponents.
This weekly feature identifies the “Dial-Up” teams in Division I basketball: squads that consistently overperform against strong opponents but “phone it in” and underperform against weaker ones.
The rankings below highlight teams that play to the level of their competition—for better or worse.
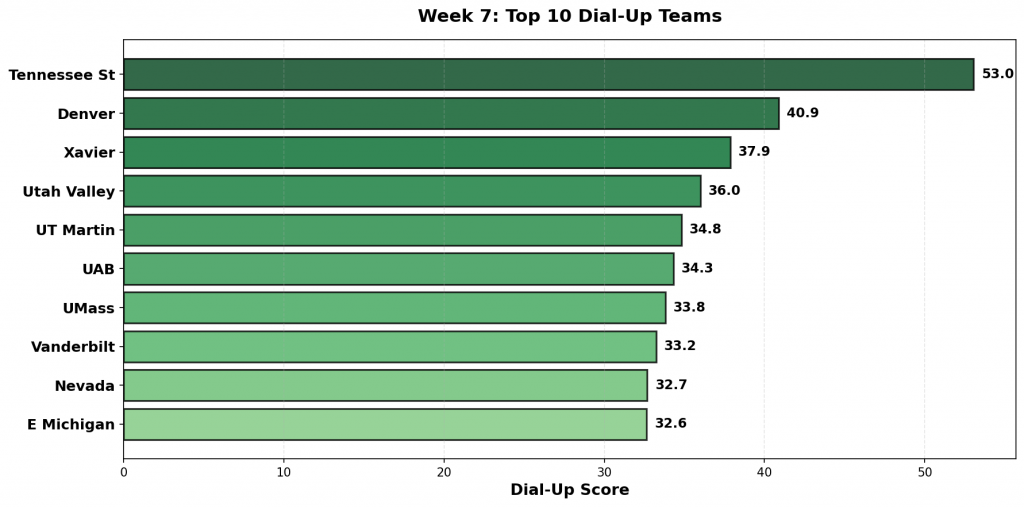
Figure 1: Top 10 teams with the highest Dial-Up scores in Week 7. Scores reflect the combination of overperformance against strong opponents and underperformance against weak ones.
#1: Tennessee St (7-5)
Against #131 UNLV, #270 Tennessee St pulled off a big win, 63-60. The model expected a margin of -8, but they performed 12 points better than projected. Facing #320 Alabama A&M, #270 Tennessee St suffered a bad loss, 53-80. Favored by 14, they underperformed by 42 points.
Dial-Up Metrics: Exceeded projections by 11.5 total points against strong opponents (1 games); underperformed by 41.5 points against weak competition (1 games).
#2: Denver (7-7)
Against #88 Colorado State, #288 Denver pulled off a big win, 83-81. The model expected a margin of -19, but they performed outpacing the projection by 21. Facing #227 Cal State Fullerton, #288 Denver suffered a bad loss, 86-105. Favored by 6, they underperformed by 24 points.
Dial-Up Metrics: Exceeded projections by 49.2 total points against strong opponents (3 games); underperformed by 24.5 points against weak competition (1 games).
#3: Xavier (9-4)
Against #38 West Virginia, #110 Xavier pulled off a big win, 78-68. The model expected a margin of -10, but they performed beating the line by 20. Facing #225 Le Moyne, #110 Xavier struggled to put away Le Moyne, winning just 74-69. Favored by 22, they underperformed by 17 points.
Dial-Up Metrics: Exceeded projections by 20.5 total points against strong opponents (1 games); underperformed by 17.4 points against weak competition (1 games).
#4: Utah Valley (10-3)
Against #176 South Dakota State, #73 Utah Valley pulled off a big win, 75-52. The model expected a margin of 4, but they performed +19 versus projection. Facing #206 Fresno State, #73 Utah Valley suffered a bad loss, 74-75. Favored by 16, they underperformed by 17 points.
Dial-Up Metrics: Exceeded projections by 19.3 total points against strong opponents (1 games); underperformed by 16.7 points against weak competition (1 games).
#5: UT Martin (9-4)
Against #112 Bradley, #193 UT Martin pulled off a big win, 78-67. The model expected a margin of -16, but they performed 27 points better than projected. Facing #207 Southern Miss, #193 UT Martin suffered a bad loss, 60-70. Favored by 8, they underperformed by 18 points.
Dial-Up Metrics: Exceeded projections by 43.2 total points against strong opponents (2 games); underperformed by 26.4 points against weak competition (2 games).
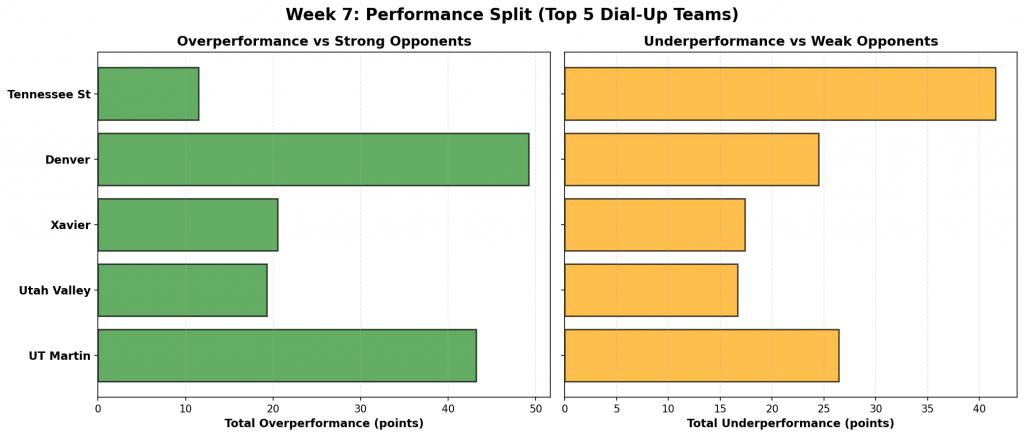
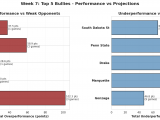
Figure 2: Performance comparison for the top 5 Dial-Up teams. Green bars show total overperformance against strong opponents; orange bars show total underperformance against weak opponents.
#6: UAB (9-4)
Against #82 High Point, #121 UAB pulled off a big win, 91-74. The model expected a margin of -2, but they performed outpacing the projection by 19. Facing #258 Alabama State, #121 UAB suffered a bad loss, 74-77. Favored by 15, they underperformed by 18 points.
Dial-Up Metrics: Exceeded projections by 32.5 total points against strong opponents (2 games); underperformed by 36.2 points against weak competition (2 games).
#7: UMass (8-4)
Against #140 Florida State, #142 UMass pulled off a big win, 103-95. The model expected a margin of -8, but they performed beating the line by 16. Facing #239 Green Bay, #142 UMass suffered a bad loss, 75-79. Favored by 14, they underperformed by 18 points.
Dial-Up Metrics: Exceeded projections by 15.7 total points against strong opponents (1 games); underperformed by 18.1 points against weak competition (1 games).
#8: Vanderbilt (12-0)
Against #181 Lipscomb, #14 Vanderbilt pulled off a big win, 105-61. The model expected a margin of -0, but they performed +44 versus projection. Facing #247 Central Arkansas, #14 Vanderbilt struggled to put away Central Arkansas, winning just 83-72. Favored by 20, they underperformed by 9 points.
Dial-Up Metrics: Exceeded projections by 171.4 total points against strong opponents (7 games); underperformed by 8.8 points against weak competition (1 games).
#9: Nevada (9-3)
Against #89 San Francisco, #100 Nevada pulled off a big win, 81-65. The model expected a margin of -12, but they performed 28 points better than projected. Facing #204 UC Davis, #100 Nevada suffered a bad loss, 71-75. Favored by 11, they underperformed by 15 points.
Dial-Up Metrics: Exceeded projections by 70.0 total points against strong opponents (4 games); underperformed by 15.2 points against weak competition (1 games).
#10: E Michigan (6-6)
Against #90 Cincinnati, #175 E Michigan pulled off a big win, 64-56. The model expected a margin of -13, but they performed outpacing the projection by 21. Facing #329 IU Indianapolis, #175 E Michigan suffered a bad loss, 83-90. Favored by 5, they underperformed by 12 points.
Dial-Up Metrics: Exceeded projections by 21.0 total points against strong opponents (1 games); underperformed by 11.7 points against weak competition (1 games).
#11: Loyola-Chicago (4-9)
Against #119 Santa Clara, #302 Loyola-Chicago pulled off a big win, 80-78. The model expected a margin of -3, but they performed beating the line by 5. Facing #328 Northern Illinois, #302 Loyola-Chicago suffered a bad loss, 59-76. Favored by 19, they underperformed by 36 points.
Dial-Up Metrics: Exceeded projections by 5.4 total points against strong opponents (1 games); underperformed by 107.1 points against weak competition (4 games).
#12: Michigan (11-0)
Against #2 Gonzaga, #1 Michigan pulled off a big win, 101-61. The model expected a margin of 1, but they performed +39 versus projection.
Dial-Up Metrics: Exceeded projections by 192.6 total points against strong opponents (6 games).
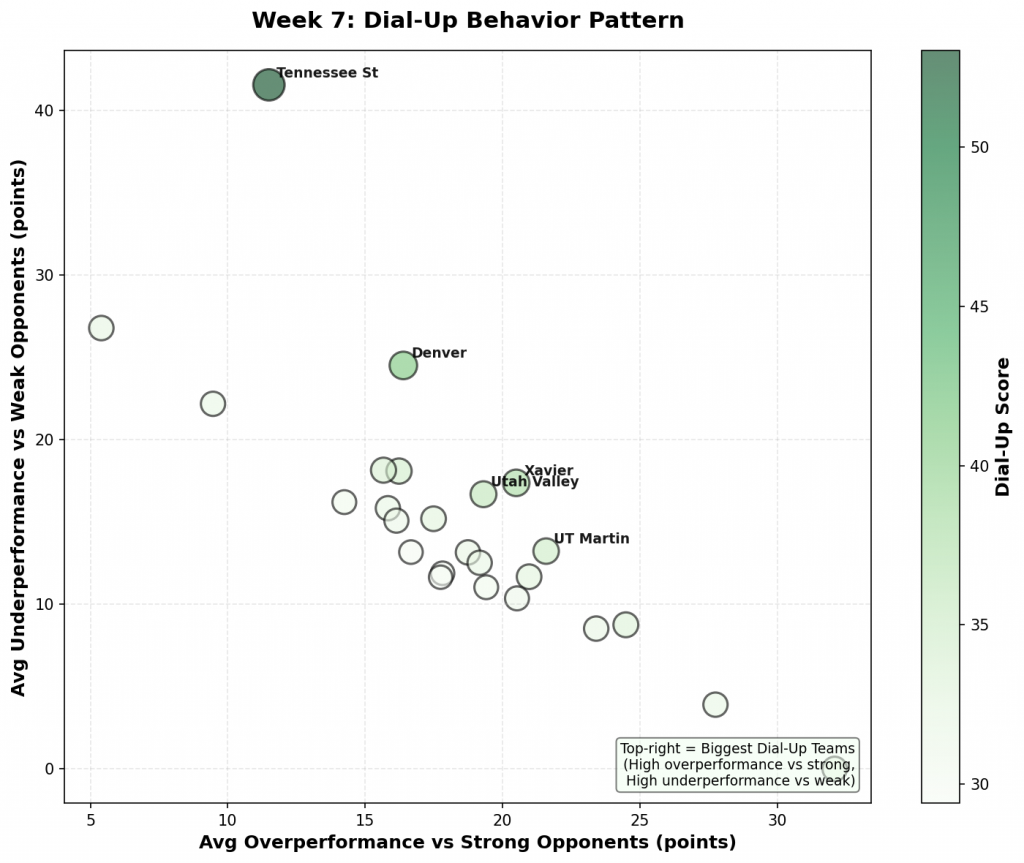
Figure 3: Scatter plot showing the relationship between overperformance against strong opponents (x-axis) and underperformance against weak opponents (y-axis). Bubble size and color indicate Dial-Up score magnitude. Top-right quadrant represents the biggest Dial-Up teams.
#13: Utah State (10-1)
Against #88 Colorado State, #20 Utah State pulled off a big win, 100-58. The model expected a margin of -1, but they performed 43 points better than projected. Facing #200 Weber State, #20 Utah State struggled to put away Weber State, winning just 83-73. Favored by 18, they underperformed by 8 points.
Dial-Up Metrics: Exceeded projections by 93.7 total points against strong opponents (4 games); underperformed by 8.5 points against weak competition (1 games).
#14: UNLV (5-6)
Against #116 Memphis, #131 UNLV pulled off a big win, 92-78. The model expected a margin of -7, but they performed outpacing the projection by 21. Facing #193 UT Martin, #131 UNLV suffered a bad loss, 81-86. Favored by 11, they underperformed by 16 points.
Dial-Up Metrics: Exceeded projections by 37.5 total points against strong opponents (2 games); underperformed by 39.4 points against weak competition (3 games).
#15: Winthrop (8-6)
Against #153 Mercer, #160 Winthrop pulled off a big win, 105-69. The model expected a margin of 7, but they performed beating the line by 29. Facing #248 Coastal Carolina, #160 Winthrop suffered a bad loss, 66-72. Favored by 9, they underperformed by 15 points.
Dial-Up Metrics: Exceeded projections by 38.3 total points against strong opponents (2 games); underperformed by 37.5 points against weak competition (3 games).
#16: SIUE (7-5)
Against #138 Drake, #216 SIUE pulled off a big win, 61-59. The model expected a margin of -14, but they performed +16 versus projection. Facing #309 Air Force, #216 SIUE suffered a bad loss, 63-77. Favored by 9, they underperformed by 23 points.
Dial-Up Metrics: Exceeded projections by 15.8 total points against strong opponents (1 games); underperformed by 47.5 points against weak competition (3 games).
#17: Indiana (9-3)
Against #133 Penn State, #29 Indiana pulled off a big win, 113-72. The model expected a margin of 1, but they performed 40 points better than projected. Facing #286 Incarnate Word, #29 Indiana struggled to put away Incarnate Word, winning just 69-61. Favored by 12, they underperformed by 4 points.
Dial-Up Metrics: Exceeded projections by 83.3 total points against strong opponents (3 games); underperformed by 7.8 points against weak competition (2 games).
#18: Kent State (10-2)
Against #94 UNC Wilmington, #136 Kent State pulled off a big win, 86-77. The model expected a margin of -2, but they performed outpacing the projection by 11. Facing #240 Portland, #136 Kent State suffered a bad loss, 78-88. Favored by 12, they underperformed by 22 points.
Dial-Up Metrics: Exceeded projections by 18.9 total points against strong opponents (2 games); underperformed by 22.2 points against weak competition (1 games).
#19: Youngstown St (8-5)
Against #103 Grand Canyon, #161 Youngstown St pulled off a big win, 90-81. The model expected a margin of -7, but they performed beating the line by 16. Facing #192 Toledo, #161 Youngstown St suffered a bad loss, 75-92. Favored by 4, they underperformed by 21 points.
Dial-Up Metrics: Exceeded projections by 16.1 total points against strong opponents (1 games); underperformed by 30.1 points against weak competition (2 games).
#20: UNC Wilmington (10-2)
Against #182 Navy, #94 UNC Wilmington pulled off a big win, 87-57. The model expected a margin of 10, but they performed +20 versus projection. Facing #226 Howard, #94 UNC Wilmington suffered a bad loss, 66-67. Favored by 16, they underperformed by 17 points.
Dial-Up Metrics: Exceeded projections by 20.5 total points against strong opponents (1 games); underperformed by 41.4 points against weak competition (4 games).
#21: Bethune-Cookman (3-8)
Against #62 Auburn, #275 Bethune-Cookman battled tough in a 90-95 loss. The model expected a margin of -28, but they performed 23 points better than projected. Facing #254 Stony Brook, #275 Bethune-Cookman suffered a bad loss, 54-61. Favored by 9, they underperformed by 16 points.
Dial-Up Metrics: Exceeded projections by 28.5 total points against strong opponents (2 games); underperformed by 16.2 points against weak competition (1 games).
#22: Yale (11-1)
Against #147 Quinnipiac, #50 Yale pulled off a big win, 97-60. The model expected a margin of 8, but they performed outpacing the projection by 29. Facing #239 Green Bay, #50 Yale struggled to put away Green Bay, winning just 73-67. Favored by 22, they underperformed by 16 points.
Dial-Up Metrics: Exceeded projections by 58.2 total points against strong opponents (3 games); underperformed by 33.1 points against weak competition (3 games).
#23: Lipscomb (7-5)
Against #154 Marshall, #181 Lipscomb pulled off a big win, 90-67. The model expected a margin of 6, but they performed beating the line by 17. Facing #253 UNC Asheville, #181 Lipscomb suffered a bad loss, 64-69. Favored by 8, they underperformed by 13 points.
Dial-Up Metrics: Exceeded projections by 16.7 total points against strong opponents (1 games); underperformed by 26.3 points against weak competition (2 games).
#24: Incarnate Word (6-6)
Against #65 McNeese, #286 Incarnate Word pulled off a big win, 71-67. The model expected a margin of -14, but they performed +18 versus projection. Facing #256 New Orleans, #286 Incarnate Word suffered a bad loss, 83-84. Favored by 11, they underperformed by 12 points.
Dial-Up Metrics: Exceeded projections by 17.8 total points against strong opponents (1 games); underperformed by 11.9 points against weak competition (1 games).
#25: Loyola Mary (8-4)
Against #169 Troy, #129 Loyola Mary pulled off a big win, 74-63. The model expected a margin of -7, but they performed 18 points better than projected. Facing #254 Stony Brook, #129 Loyola Mary suffered a bad loss, 68-71. Favored by 9, they underperformed by 12 points.
Dial-Up Metrics: Exceeded projections by 17.8 total points against strong opponents (1 games); underperformed by 11.6 points against weak competition (1 games).
What This Means
These rankings highlight teams that are dangerous underdogs but risky favorites. They have the ceiling to beat anyone in the country but the floor to lose to anyone.
Actionable Advice
- High Value as Underdogs: These teams often perform best when the lights are brightest. Look for them to cover spreads or pull off moneyline upsets against Top 50 competition.
- High Risk as Favorites: Be extremely cautious backing these teams as double-digit favorites against sub-200 opponents. Their tendency to “phone it in” makes them prime candidates to let inferior teams hang around and cover the spread.
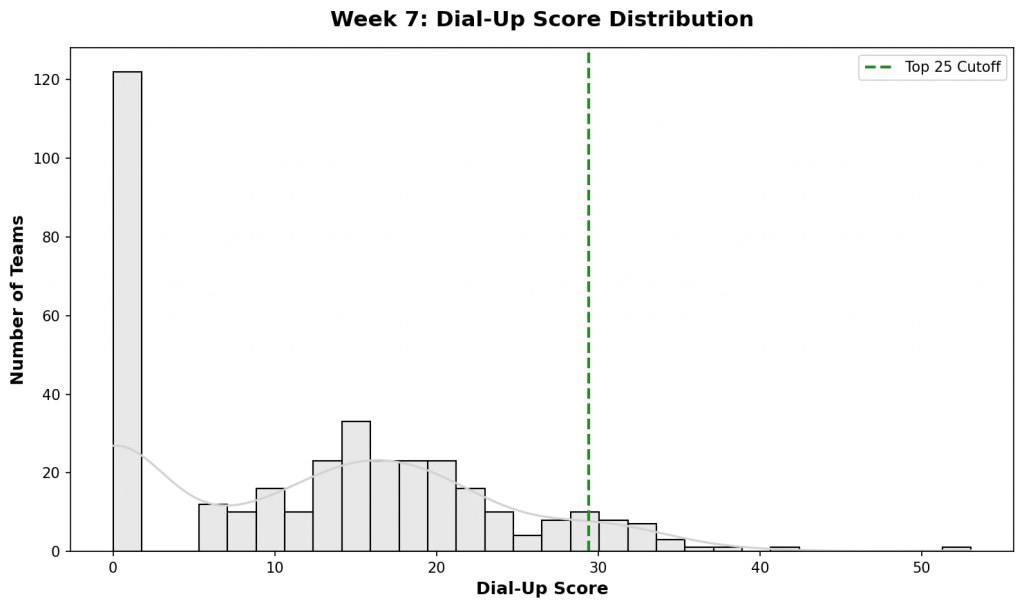
Figure 4: Distribution of Dial-Up scores across all Division I teams. The top 25 teams (highlighted in green) represent those with the most extreme performance splits based on opponent quality.
Check back next week for updated rankings.